| Param | Original file | Final file |
|---|---|---|
| Filename | modeM0/AS1A11_083T01_9000005242_36782cztM0_level2.evt | modeM0/AS1A11_083T01_9000005242_36782cztM0_level2_quad_clean.evt |
| Size (bytes) | 540,604,800 | 45,302,400 |
| Size | 515.6 MB | 43.2 MB |
| Events in quadrant A | 2,833,928 | 273,562 |
| Events in quadrant B | 5,955,090 | 227,009 |
| Events in quadrant C | 3,231,599 | 261,144 |
| Events in quadrant D | 3,997,763 | 242,915 |
| Mode SS | |||
|---|---|---|---|
| Quadrant | BADHDUFLAG | Total packets | Discarded packets |
| A | 0 | 106 | 0 |
| B | 0 | 106 | 0 |
| C | 0 | 106 | 0 |
| D | 0 | 106 | 0 |
| Mode M9 | |||
|---|---|---|---|
| Quadrant | BADHDUFLAG | Total packets | Discarded packets |
| A | 0 | 36 | 0 |
| B | 0 | 36 | 0 |
| C | 0 | 36 | 0 |
| D | 0 | 37 | 0 |
| Mode M0 | |||
|---|---|---|---|
| Quadrant | BADHDUFLAG | Total packets | Discarded packets |
| A | 0 | 11348 | 3 |
| B | 0 | 21172 | 2 |
| C | 0 | 12507 | 2 |
| D | 0 | 15261 | 2 |
| Quadrant | Total seconds | Saturated seconds | Saturation percentage |
|---|---|---|---|
| A | 5227 | 10 | 0.191314% |
| B | 5227 | 963 | 18.423570% |
| C | 5227 | 131 | 2.506218% |
| D | 5227 | 325 | 6.217716% |
Noise dominated data is calculated using 1-second bins in cleaned event files. If a bin has >2000 counts, and if more than 50% of those come from <1% of pixels, then it is considered to be noise-dominated and hence unusable.
| Quadrant | # 1 sec bins | Bins with >0 counts | Bins with >2000 counts | High rate bins dominated by noise | Noise dominated (total time) | Noise dominated (detector-on time) | Marked lightcurve |
|---|---|---|---|---|---|---|---|
| A | 7320 | 5228 | 3 | 3 | 0.04% | 0.06% | 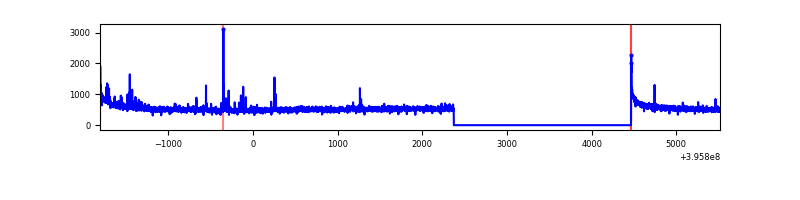 |
| B | 7320 | 5228 | 771 | 771 | 10.53% | 14.75% | 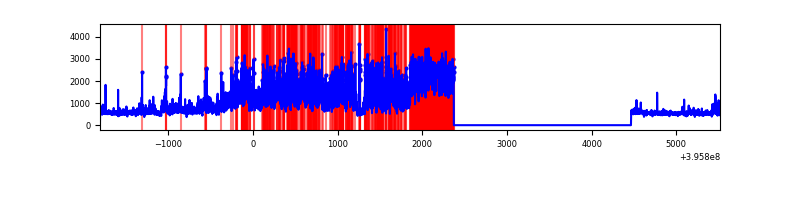 |
| C | 7320 | 5228 | 118 | 118 | 1.61% | 2.26% | 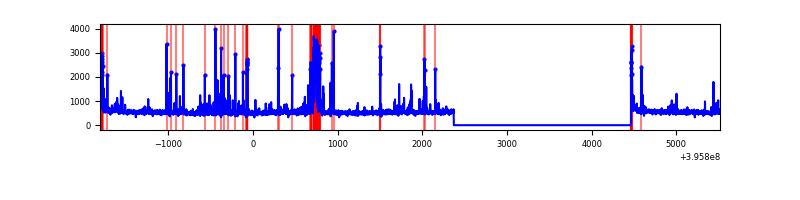 |
| D | 7320 | 5228 | 290 | 290 | 3.96% | 5.55% | 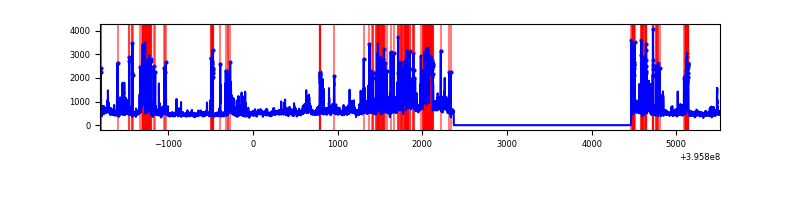 |
Top three noisy pixels from each quadrant. If the there are fewer than three noisy pixels in the level2.evt file, extra rows are filled as -1
| Pixel properties | Quadrant properties | ||||||
|---|---|---|---|---|---|---|---|
| Quadrant | DetID | PixID | Counts | Sigma | Mean | Median | Sigma |
| A | 10 | 83 | 213991 | 1611.8 | 660 | 647 | 132.4 |
| A | 9 | 143 | 38125 | 283.14 | 660 | 647 | 132.4 |
| A | 7 | 16 | 19066 | 139.15 | 660 | 647 | 132.4 |
| B | 12 | 1 | 3249165 | 27830.9 | 623 | 609 | 116.7 |
| B | 4 | 171 | 123403 | 1052.0 | 623 | 609 | 116.7 |
| B | 0 | 213 | 37211 | 313.58 | 623 | 609 | 116.7 |
| C | 14 | 254 | 488705 | 3365.81 | 627 | 631 | 145.0 |
| C | 15 | 214 | 219319 | 1508.09 | 627 | 631 | 145.0 |
| C | 0 | 10 | 33823 | 228.9 | 627 | 631 | 145.0 |
| D | 13 | 249 | 494565 | 3340.83 | 614 | 598 | 147.9 |
| D | 12 | 233 | 332895 | 2247.41 | 614 | 598 | 147.9 |
| D | 13 | 171 | 201305 | 1357.43 | 614 | 598 | 147.9 |
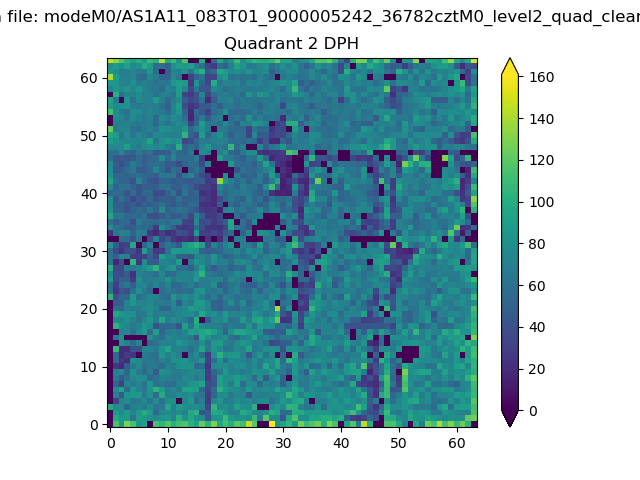
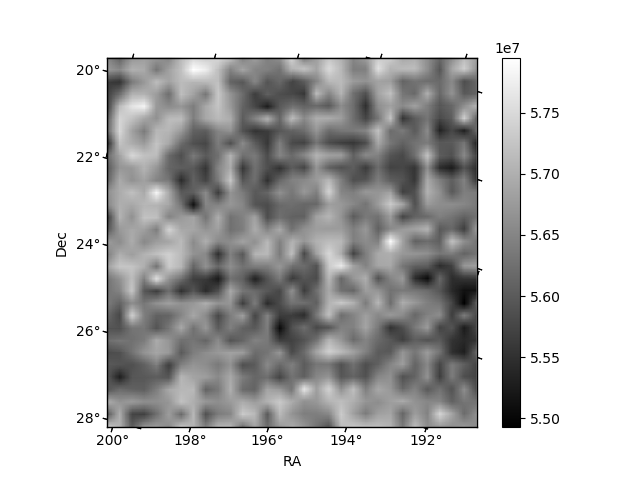
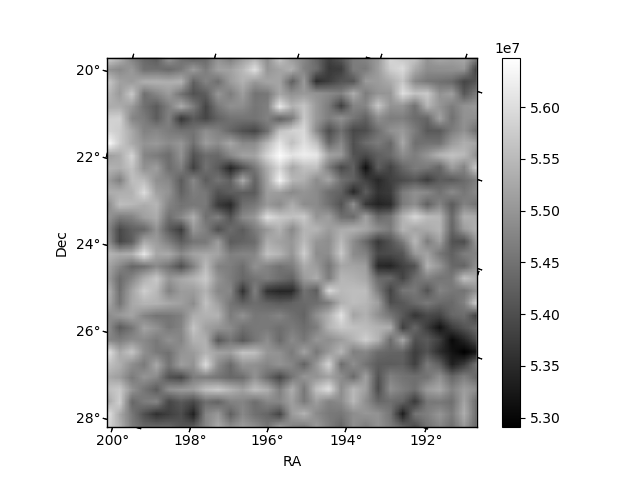
Histogram calculated using DETX and DETY for each event in the final _common_clean file
| Quadrant A | 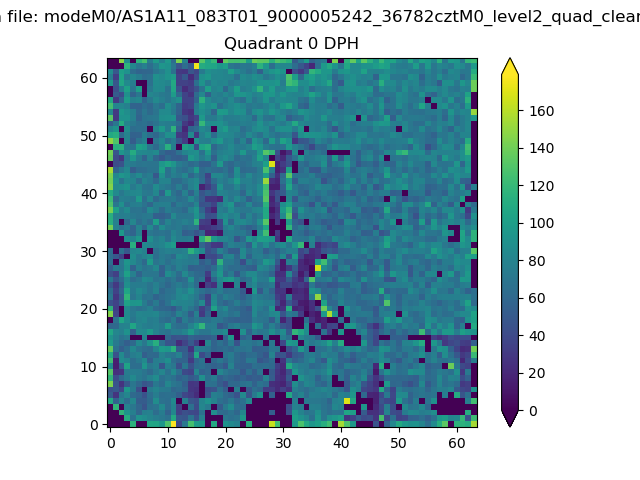 |
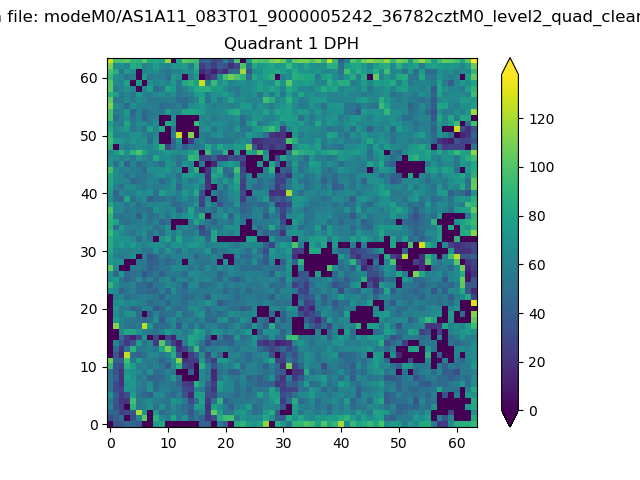 |
Quadrant B |
|---|---|---|---|
| Quadrant D | 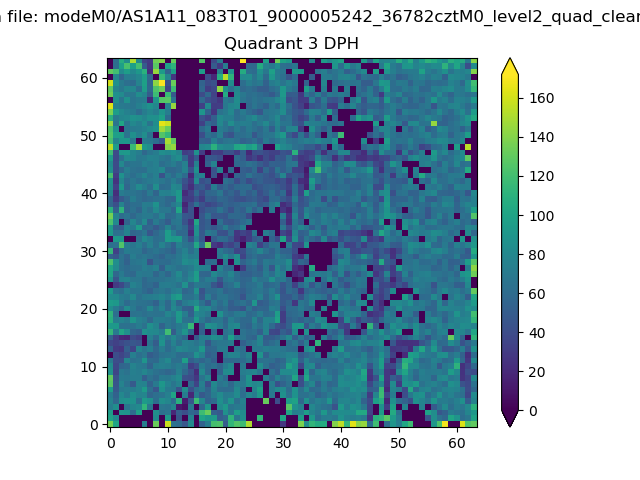 |
 |
Quadrant C |
| Plot type | Count rate plots | Images |
|---|---|---|
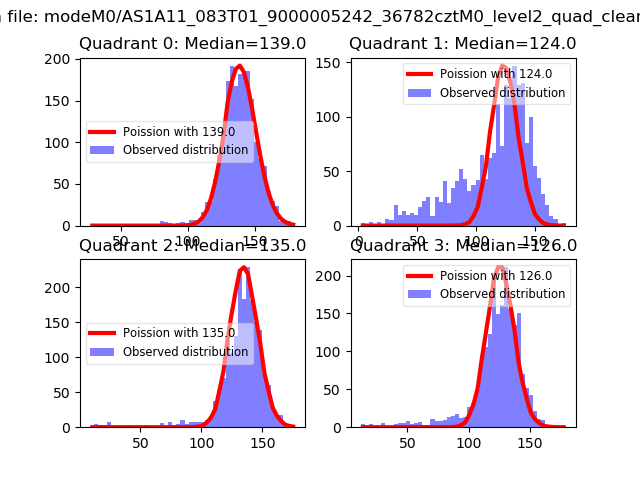
| Comparison with Poisson distribution Blue bars denote a histogram of data divided into 1 sec bins. Red curve is a Poisson curve with rate = median count rate of data. |
 |
 |
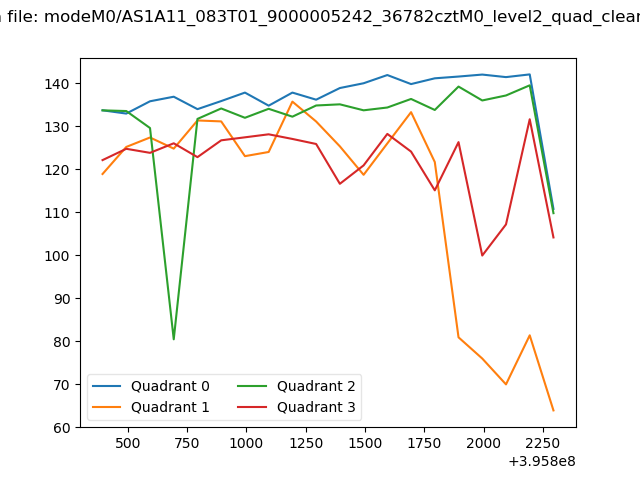
| Quadrant-wise count rates Data is divided into 100 sec bins |
 |
|
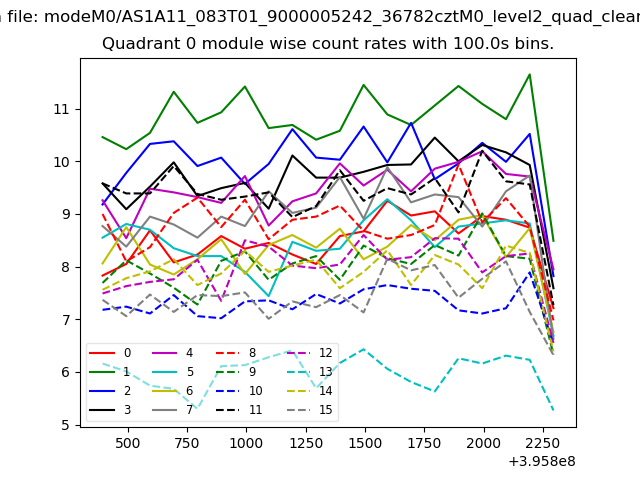
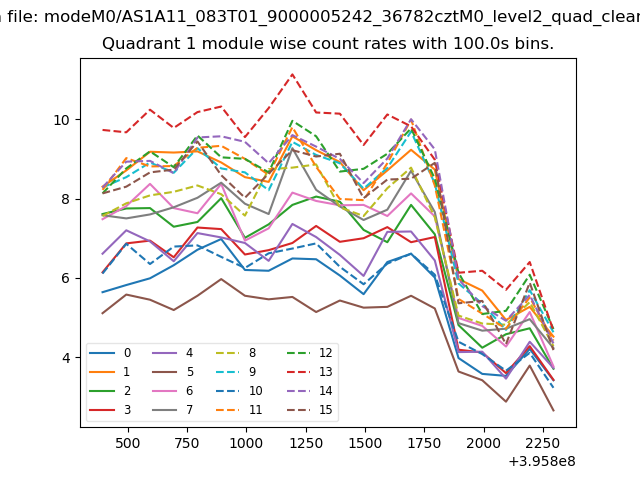
| Module-wise count rates for Quadrant A Data is divided into 100 sec bins |
 |
 |
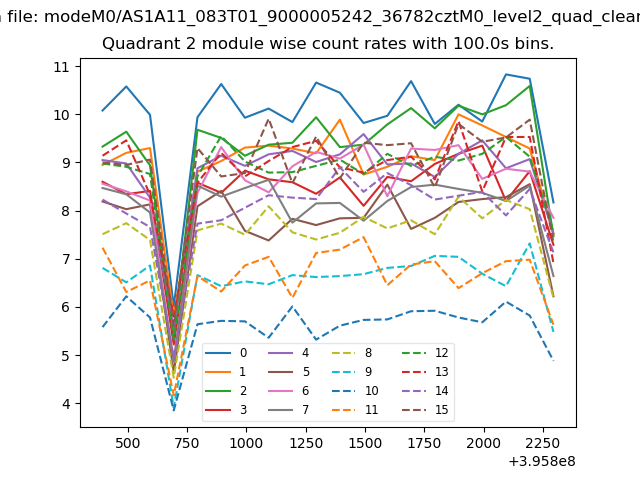
| Module-wise count rates for Quadrant B Data is divided into 100 sec bins |
 |
 |
| Module-wise count rates for Quadrant C Data is divided into 100 sec bins |
 |
 |
| Module-wise count rates for Quadrant D Data is divided into 100 sec bins |
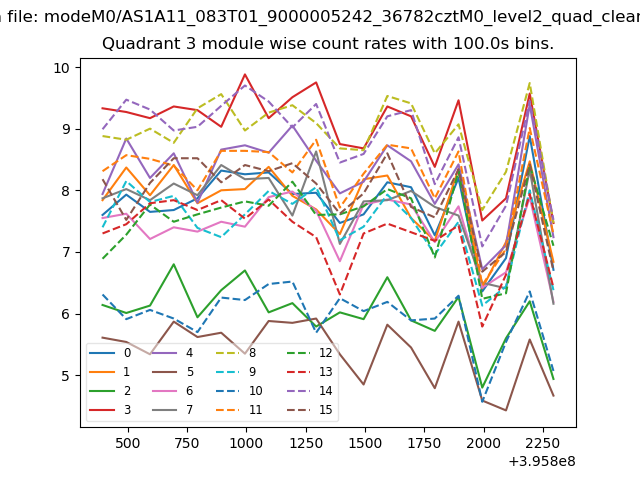 |
 |
| Parameter | Plot |
|---|---|
| CZT HV Monitor | 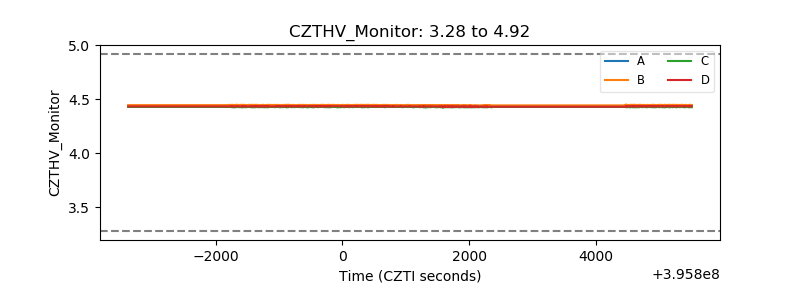 |
| D_VDD | 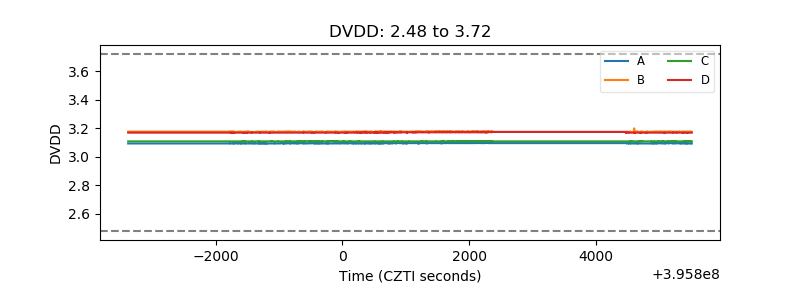 |
| Temperature 1 | 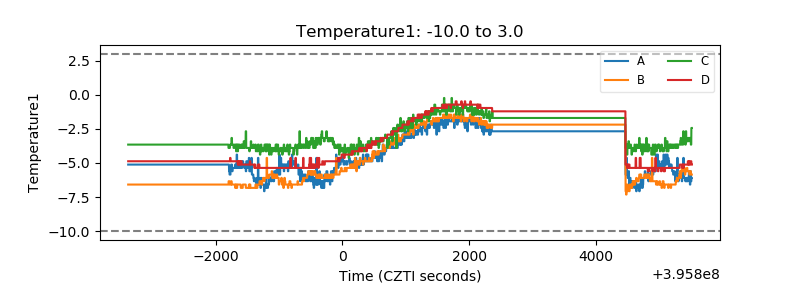 |
| Veto HV Monitor |  |
| Veto LLD |  |
| Alpha Counter |  |
| _CPM_Rate | 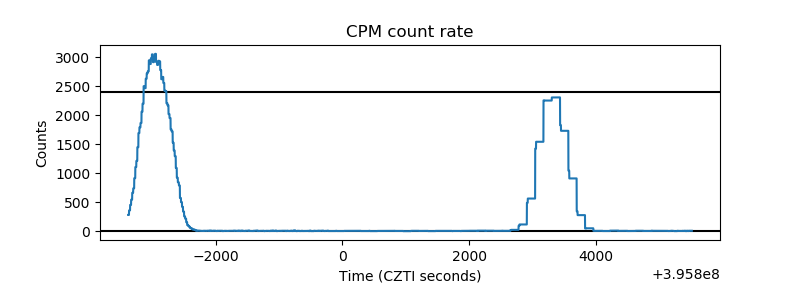 |
| CZT Counter | 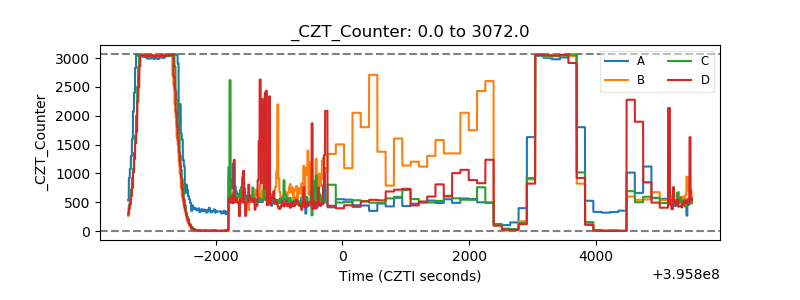 |
| +2.5 Volts monitor | 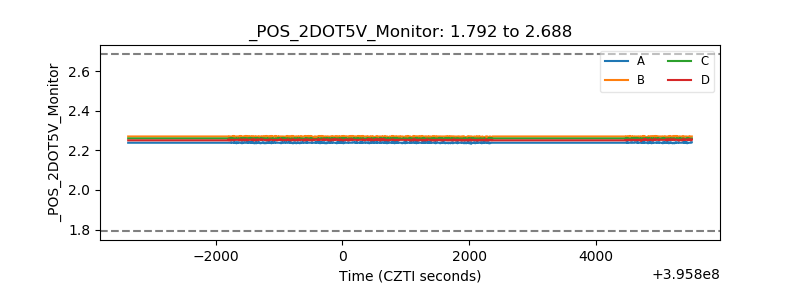 |
| +5 Volts monitor |  |
| _ROLL_ROT | 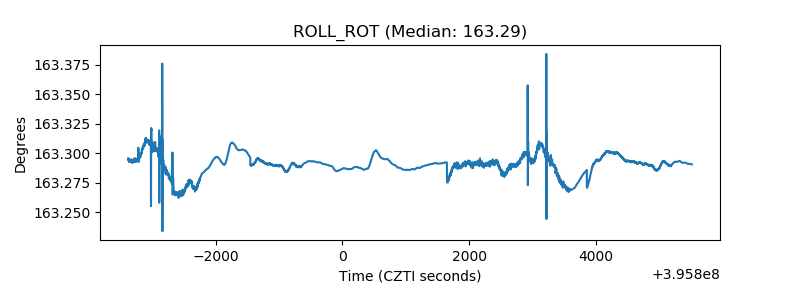 |
| _Roll_DEC | 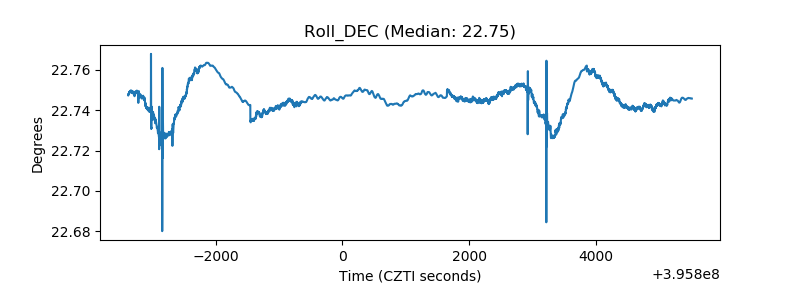 |
| _Roll_RA | 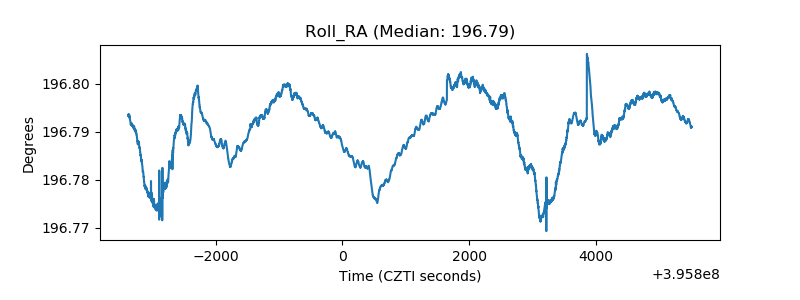 |
| Veto Counter | 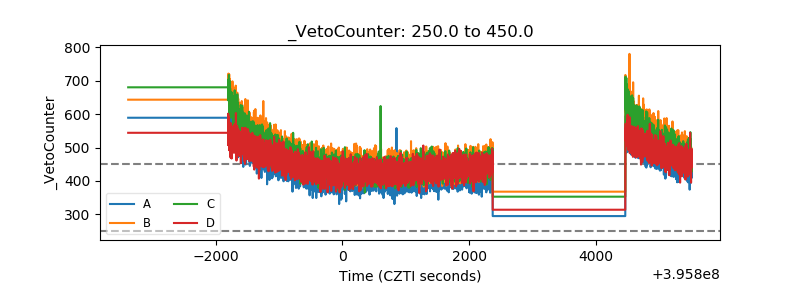 |