| Param | Original file | Final file |
|---|---|---|
| Filename | modeM0/AS1A11_083T01_9000005242_36783cztM0_level2.evt | modeM0/AS1A11_083T01_9000005242_36783cztM0_level2_quad_clean.evt |
| Size (bytes) | 532,163,520 | 48,997,440 |
| Size | 507.5 MB | 46.7 MB |
| Events in quadrant A | 2,729,981 | 329,834 |
| Events in quadrant B | 6,447,512 | 168,795 |
| Events in quadrant C | 2,883,000 | 320,320 |
| Events in quadrant D | 3,707,067 | 303,052 |
| Mode SS | |||
|---|---|---|---|
| Quadrant | BADHDUFLAG | Total packets | Discarded packets |
| A | 0 | 104 | 0 |
| B | 0 | 104 | 0 |
| C | 0 | 104 | 0 |
| D | 0 | 104 | 0 |
| Mode M9 | |||
|---|---|---|---|
| Quadrant | BADHDUFLAG | Total packets | Discarded packets |
| A | 0 | 31 | 0 |
| B | 0 | 31 | 0 |
| C | 0 | 31 | 0 |
| D | 0 | 32 | 0 |
| Mode M0 | |||
|---|---|---|---|
| Quadrant | BADHDUFLAG | Total packets | Discarded packets |
| A | 0 | 10966 | 3 |
| B | 0 | 22589 | 2 |
| C | 0 | 11350 | 2 |
| D | 0 | 14365 | 2 |
| Quadrant | Total seconds | Saturated seconds | Saturation percentage |
|---|---|---|---|
| A | 5147 | 12 | 0.233146% |
| B | 5147 | 1733 | 33.670099% |
| C | 5147 | 37 | 0.718865% |
| D | 5147 | 314 | 6.100641% |
Noise dominated data is calculated using 1-second bins in cleaned event files. If a bin has >2000 counts, and if more than 50% of those come from <1% of pixels, then it is considered to be noise-dominated and hence unusable.
| Quadrant | # 1 sec bins | Bins with >0 counts | Bins with >2000 counts | High rate bins dominated by noise | Noise dominated (total time) | Noise dominated (detector-on time) | Marked lightcurve |
|---|---|---|---|---|---|---|---|
| A | 7271 | 5148 | 2 | 2 | 0.03% | 0.04% | 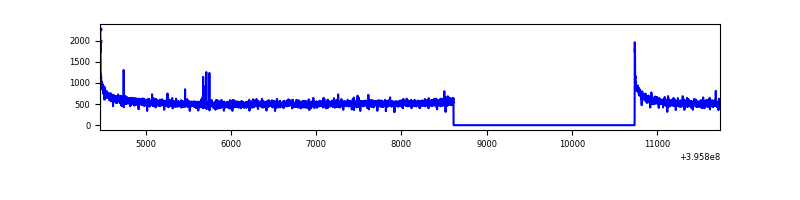 |
| B | 7270 | 5146 | 1238 | 1238 | 17.03% | 24.06% | 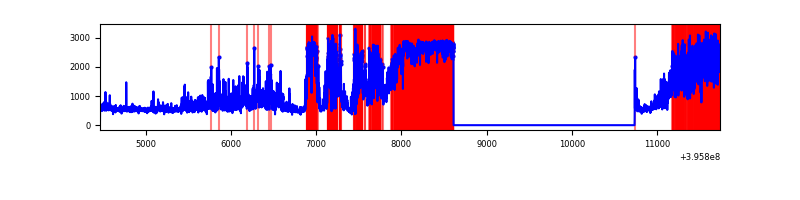 |
| C | 7271 | 5148 | 27 | 27 | 0.37% | 0.52% | 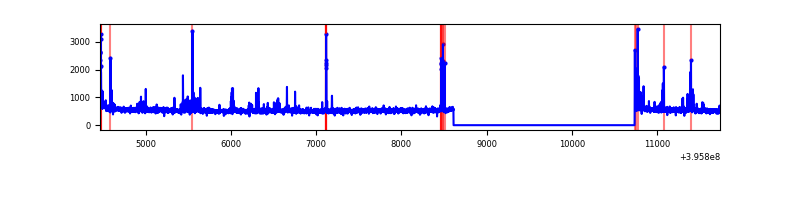 |
| D | 7271 | 5148 | 282 | 282 | 3.88% | 5.48% | 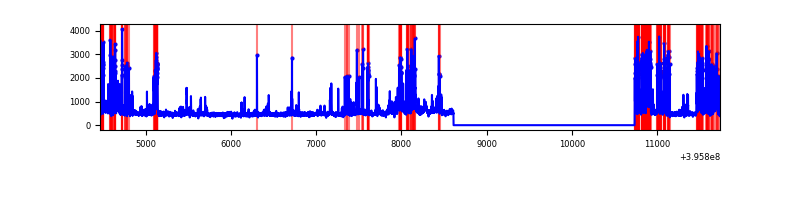 |
Top three noisy pixels from each quadrant. If the there are fewer than three noisy pixels in the level2.evt file, extra rows are filled as -1
| Pixel properties | Quadrant properties | ||||||
|---|---|---|---|---|---|---|---|
| Quadrant | DetID | PixID | Counts | Sigma | Mean | Median | Sigma |
| A | 10 | 83 | 214947 | 1664.57 | 647 | 637 | 128.7 |
| A | 13 | 254 | 8418 | 60.44 | 647 | 637 | 128.7 |
| A | 13 | 6 | 7771 | 55.41 | 647 | 637 | 128.7 |
| B | 12 | 1 | 4347111 | 46534.94 | 497 | 485 | 93.4 |
| B | 5 | 255 | 29218 | 307.61 | 497 | 485 | 93.4 |
| B | 12 | 2 | 20826 | 217.77 | 497 | 485 | 93.4 |
| C | 15 | 214 | 224282 | 1553.53 | 620 | 626 | 144.0 |
| C | 0 | 207 | 110007 | 759.77 | 620 | 626 | 144.0 |
| C | 0 | 10 | 51647 | 354.4 | 620 | 626 | 144.0 |
| D | 12 | 6 | 637657 | 4348.5 | 605 | 590 | 146.5 |
| D | 13 | 171 | 245437 | 1671.28 | 605 | 590 | 146.5 |
| D | 13 | 249 | 238285 | 1622.46 | 605 | 590 | 146.5 |
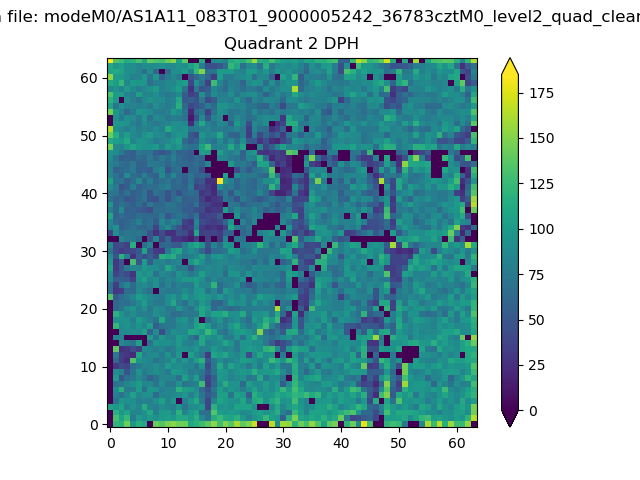
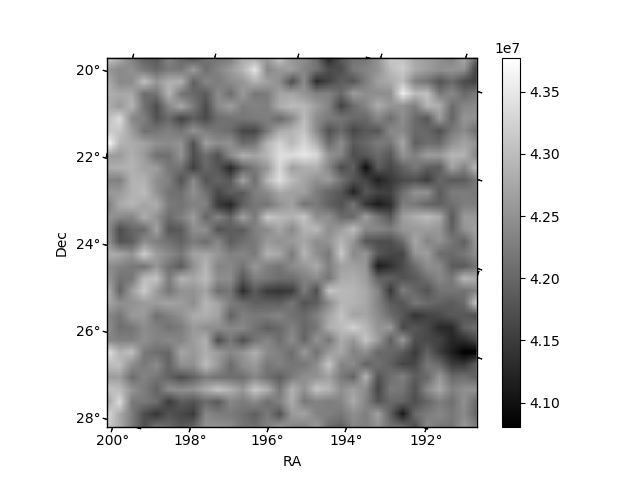
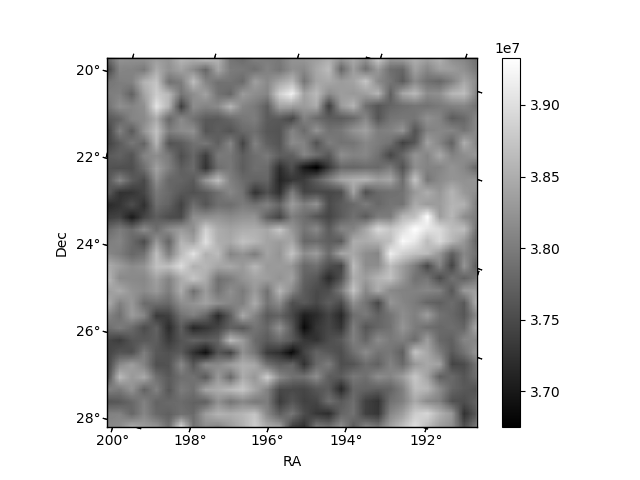
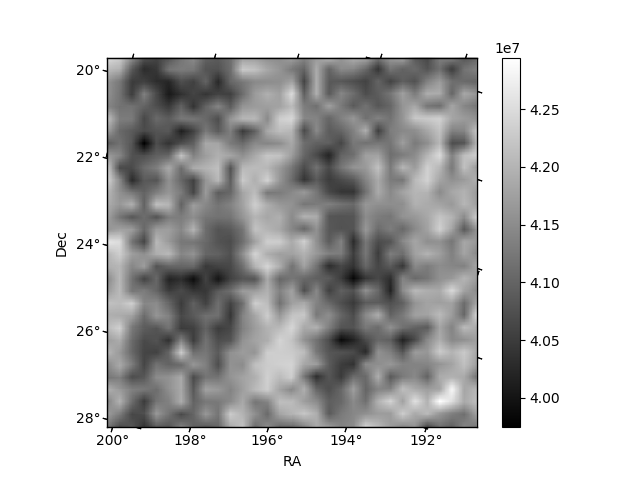
Histogram calculated using DETX and DETY for each event in the final _common_clean file
| Quadrant A | 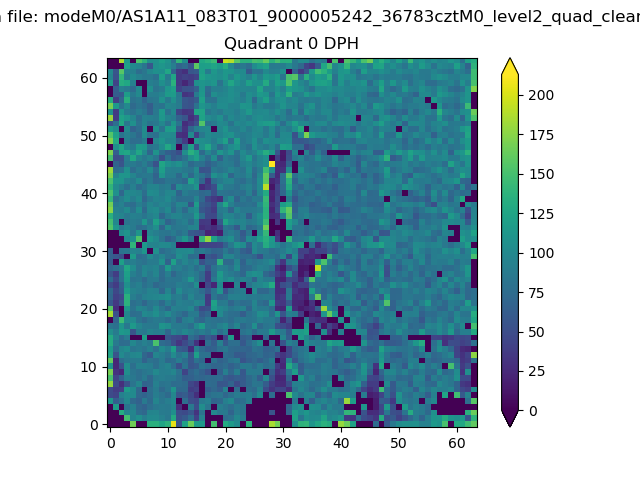 |
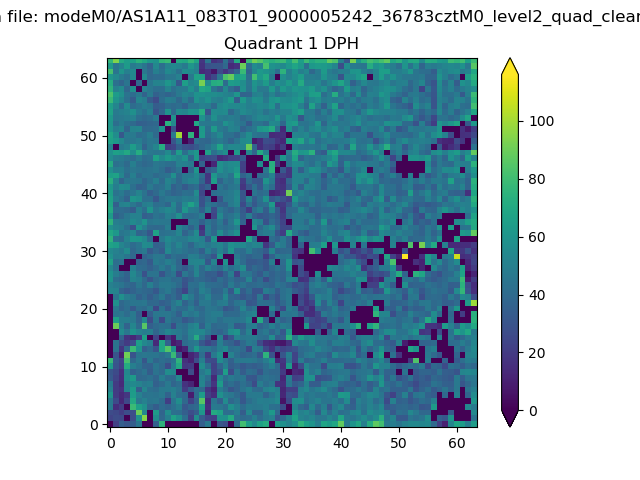 |
Quadrant B |
|---|---|---|---|
| Quadrant D | 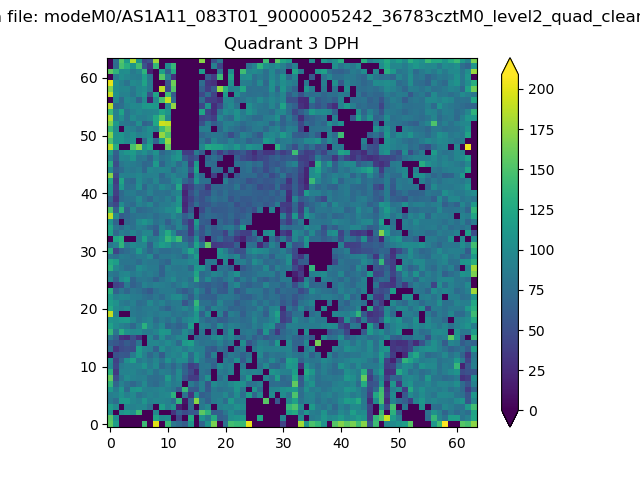 |
 |
Quadrant C |
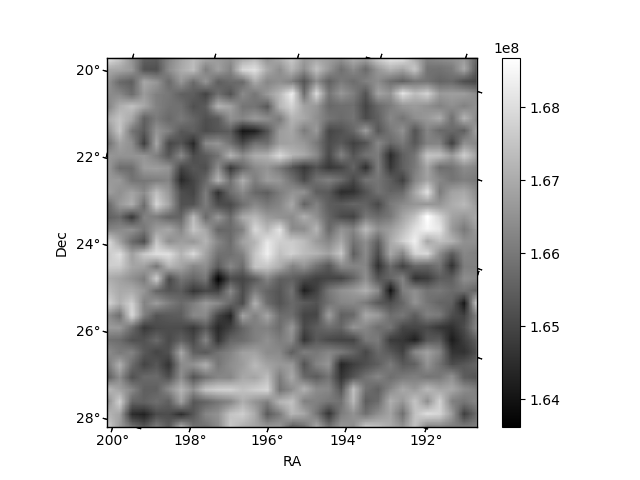
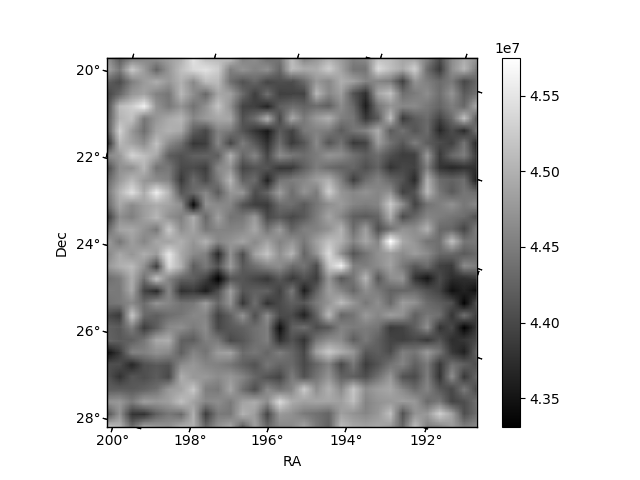
| Plot type | Count rate plots | Images |
|---|---|---|
| Comparison with Poisson distribution Blue bars denote a histogram of data divided into 1 sec bins. Red curve is a Poisson curve with rate = median count rate of data. |
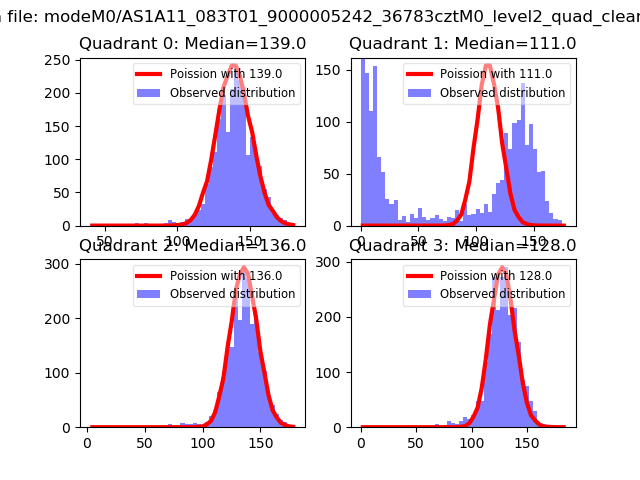 |
 |
| Quadrant-wise count rates Data is divided into 100 sec bins |
 |
|
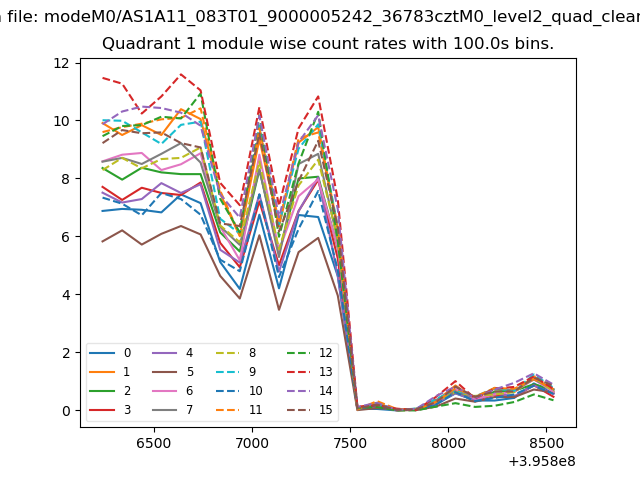
| Module-wise count rates for Quadrant A Data is divided into 100 sec bins |
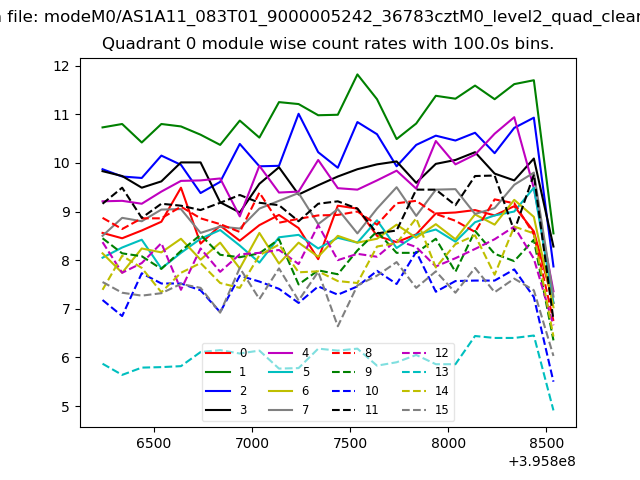 |
 |
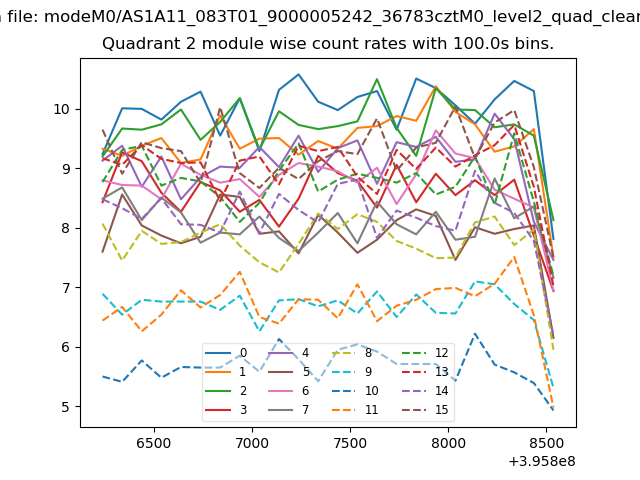
| Module-wise count rates for Quadrant B Data is divided into 100 sec bins |
 |
 |
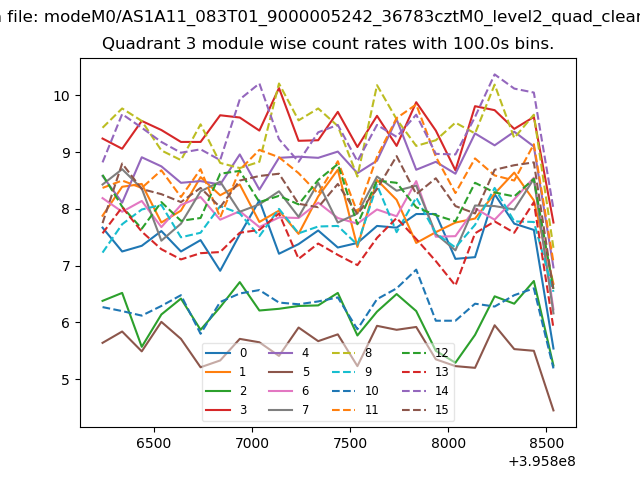
| Module-wise count rates for Quadrant C Data is divided into 100 sec bins |
 |
 |
| Module-wise count rates for Quadrant D Data is divided into 100 sec bins |
 |
 |
| Parameter | Plot |
|---|---|
| CZT HV Monitor | 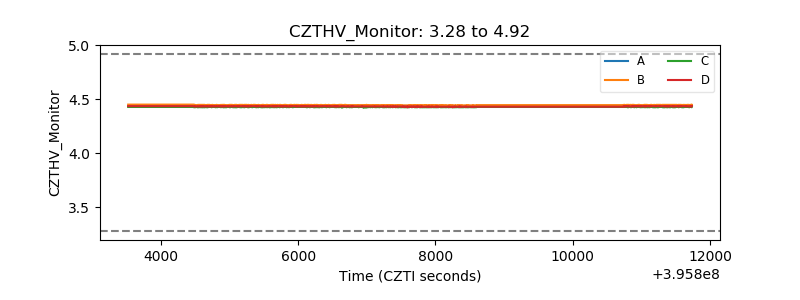 |
| D_VDD | 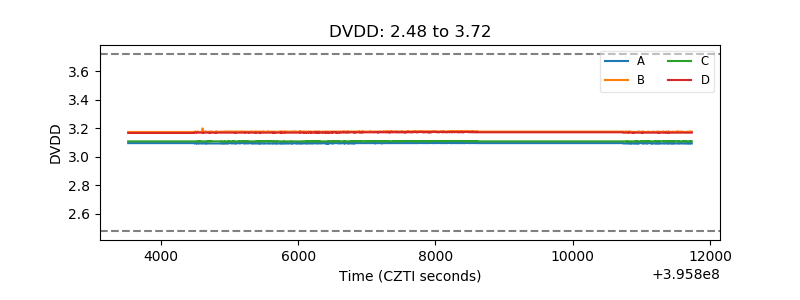 |
| Temperature 1 | 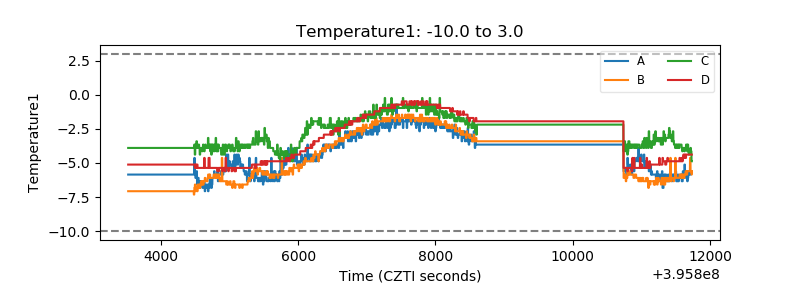 |
| Veto HV Monitor | 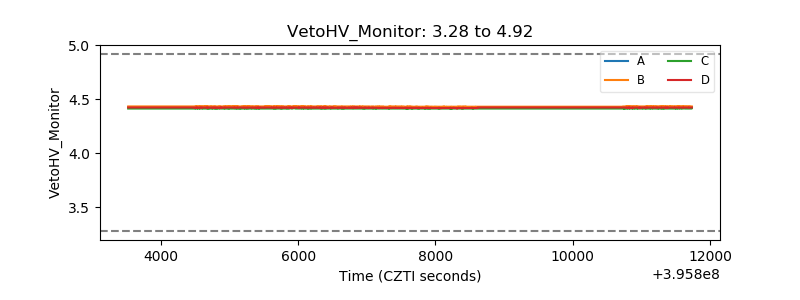 |
| Veto LLD | 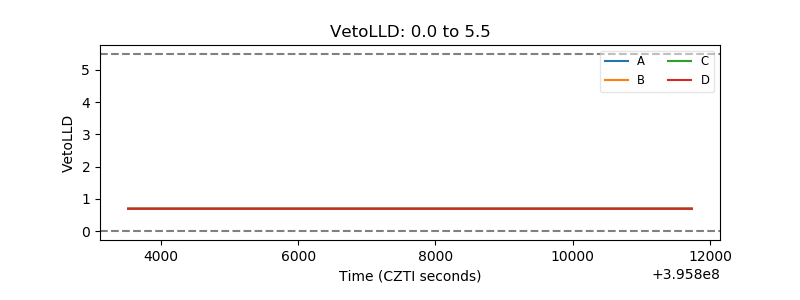 |
| Alpha Counter |  |
| _CPM_Rate | 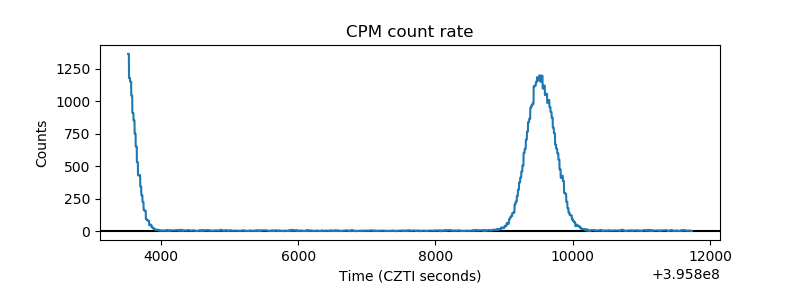 |
| CZT Counter | 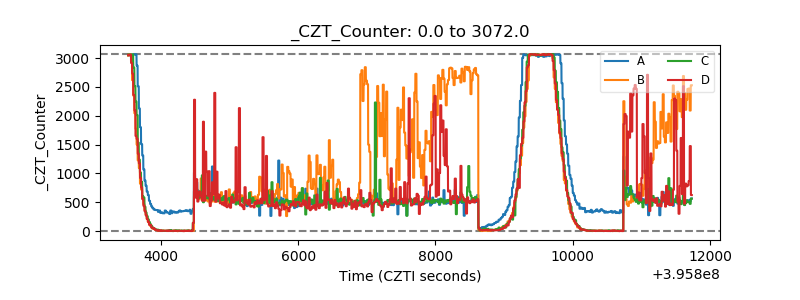 |
| +2.5 Volts monitor |  |
| +5 Volts monitor |  |
| _ROLL_ROT | 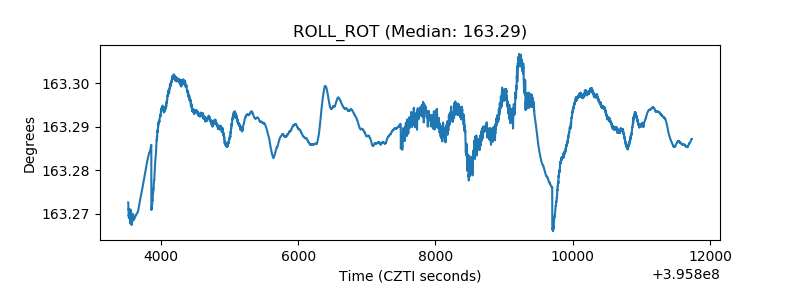 |
| _Roll_DEC | 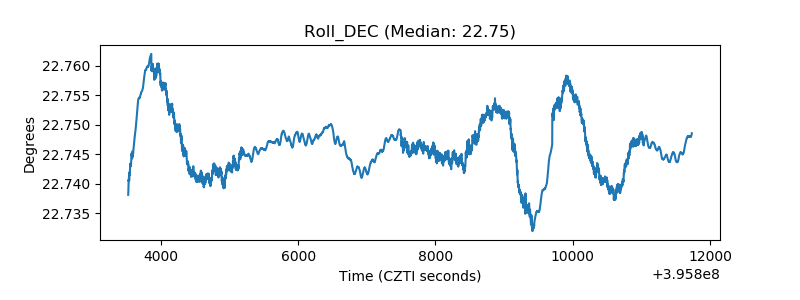 |
| _Roll_RA | 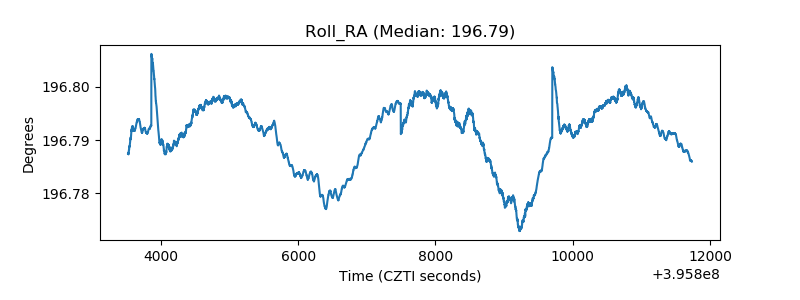 |
| Veto Counter | 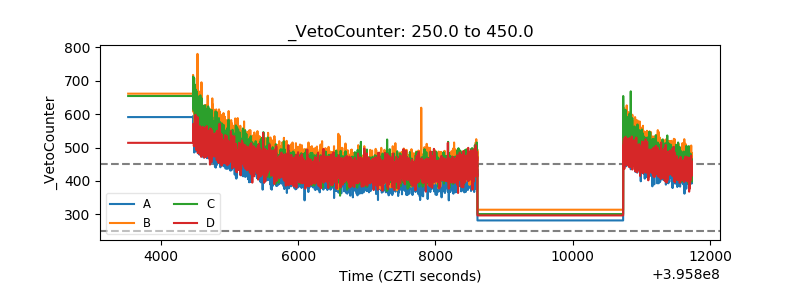 |