| Param | Original file | Final file |
|---|---|---|
| Filename | modeM0/AS1A11_083T01_9000005242_36784cztM0_level2.evt | modeM0/AS1A11_083T01_9000005242_36784cztM0_level2_quad_clean.evt |
| Size (bytes) | 643,222,080 | 50,186,880 |
| Size | 613.4 MB | 47.9 MB |
| Events in quadrant A | 2,505,670 | 380,950 |
| Events in quadrant B | 10,618,600 | 67,530 |
| Events in quadrant C | 2,654,470 | 372,778 |
| Events in quadrant D | 3,370,857 | 354,417 |
| Mode SS | |||
|---|---|---|---|
| Quadrant | BADHDUFLAG | Total packets | Discarded packets |
| A | 0 | 100 | 0 |
| B | 0 | 100 | 0 |
| C | 0 | 100 | 0 |
| D | 0 | 100 | 0 |
| Mode M9 | |||
|---|---|---|---|
| Quadrant | BADHDUFLAG | Total packets | Discarded packets |
| A | 0 | 21 | 0 |
| B | 0 | 21 | 0 |
| C | 0 | 21 | 0 |
| D | 0 | 21 | 0 |
| Mode M0 | |||
|---|---|---|---|
| Quadrant | BADHDUFLAG | Total packets | Discarded packets |
| A | 0 | 10201 | 3 |
| B | 0 | 34908 | 2 |
| C | 0 | 10591 | 2 |
| D | 0 | 13184 | 2 |
| Quadrant | Total seconds | Saturated seconds | Saturation percentage |
|---|---|---|---|
| A | 4875 | 6 | 0.123077% |
| B | 4875 | 3753 | 76.984615% |
| C | 4875 | 35 | 0.717949% |
| D | 4875 | 233 | 4.779487% |
Noise dominated data is calculated using 1-second bins in cleaned event files. If a bin has >2000 counts, and if more than 50% of those come from <1% of pixels, then it is considered to be noise-dominated and hence unusable.
| Quadrant | # 1 sec bins | Bins with >0 counts | Bins with >2000 counts | High rate bins dominated by noise | Noise dominated (total time) | Noise dominated (detector-on time) | Marked lightcurve |
|---|---|---|---|---|---|---|---|
| A | 6968 | 4876 | 0 | 0 | 0.00% | 0.00% | 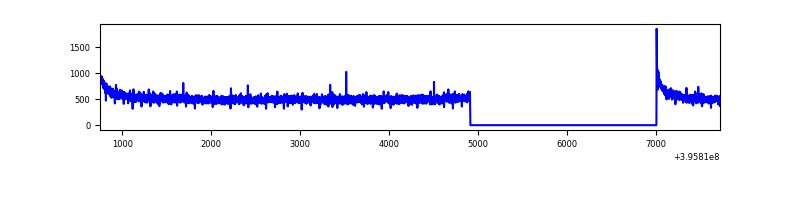 |
| B | 6968 | 4875 | 3534 | 3534 | 50.72% | 72.49% | 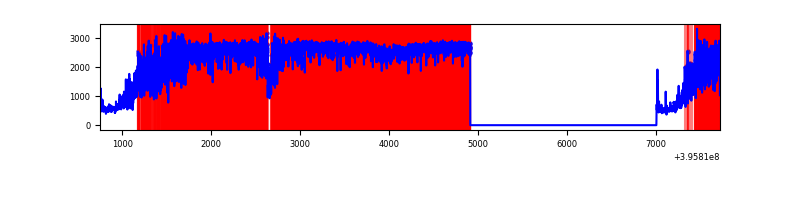 |
| C | 6968 | 4876 | 23 | 23 | 0.33% | 0.47% | 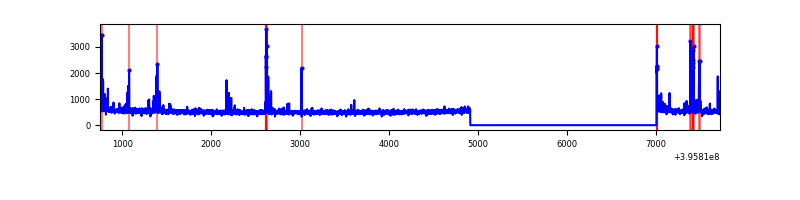 |
| D | 6968 | 4876 | 222 | 222 | 3.19% | 4.55% | 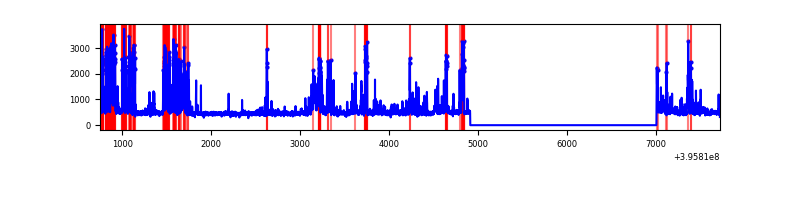 |
Top three noisy pixels from each quadrant. If the there are fewer than three noisy pixels in the level2.evt file, extra rows are filled as -1
| Pixel properties | Quadrant properties | ||||||
|---|---|---|---|---|---|---|---|
| Quadrant | DetID | PixID | Counts | Sigma | Mean | Median | Sigma |
| A | 10 | 83 | 199657 | 1682.84 | 593 | 584 | 118.3 |
| A | 13 | 6 | 11157 | 89.38 | 593 | 584 | 118.3 |
| A | 13 | 254 | 7476 | 58.26 | 593 | 584 | 118.3 |
| B | 12 | 1 | 9332615 | 164480.5 | 295 | 289 | 56.7 |
| B | 4 | 171 | 28038 | 489.07 | 295 | 289 | 56.7 |
| B | 0 | 221 | 22154 | 385.37 | 295 | 289 | 56.7 |
| C | 15 | 214 | 225038 | 1696.84 | 572 | 576 | 132.3 |
| C | 0 | 207 | 124619 | 937.71 | 572 | 576 | 132.3 |
| C | 0 | 10 | 48083 | 359.13 | 572 | 576 | 132.3 |
| D | 12 | 6 | 710791 | 5152.17 | 564 | 548 | 137.9 |
| D | 13 | 249 | 116291 | 839.61 | 564 | 548 | 137.9 |
| D | 12 | 227 | 110814 | 799.88 | 564 | 548 | 137.9 |
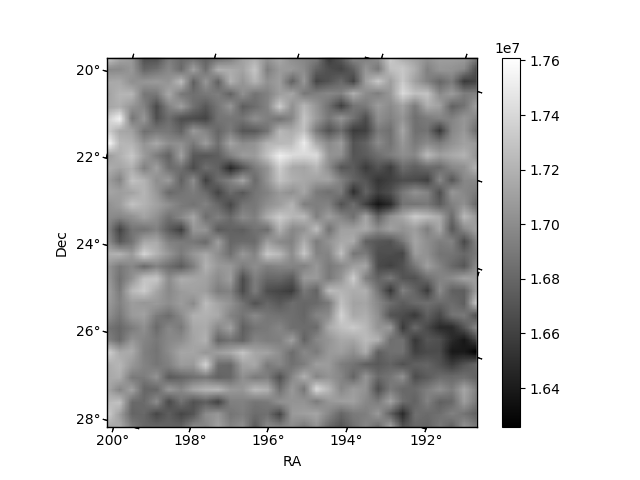
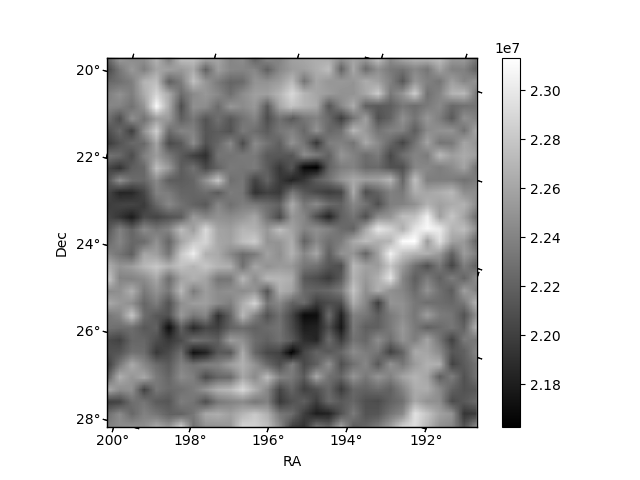
Histogram calculated using DETX and DETY for each event in the final _common_clean file
| Quadrant A | 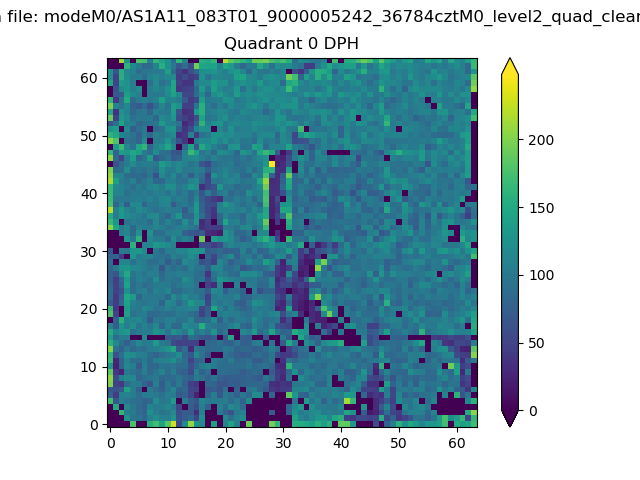 |
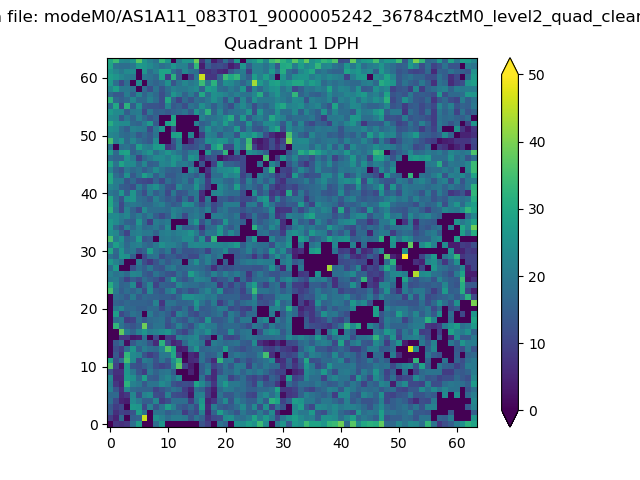 |
Quadrant B |
|---|---|---|---|
| Quadrant D | 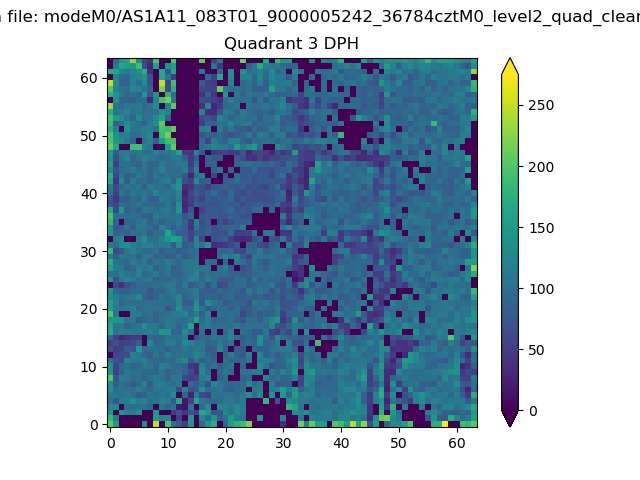 |
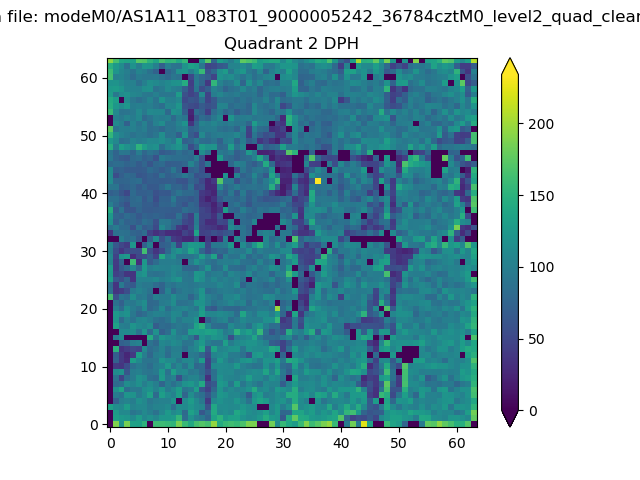 |
Quadrant C |
| Plot type | Count rate plots | Images |
|---|---|---|
| Comparison with Poisson distribution Blue bars denote a histogram of data divided into 1 sec bins. Red curve is a Poisson curve with rate = median count rate of data. |
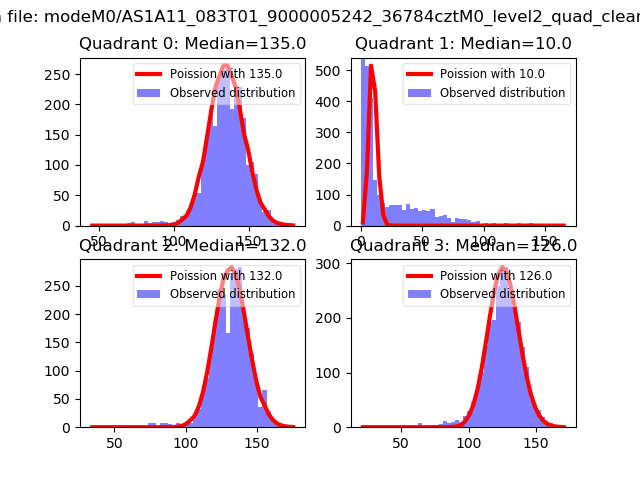 |
 |
| Quadrant-wise count rates Data is divided into 100 sec bins |
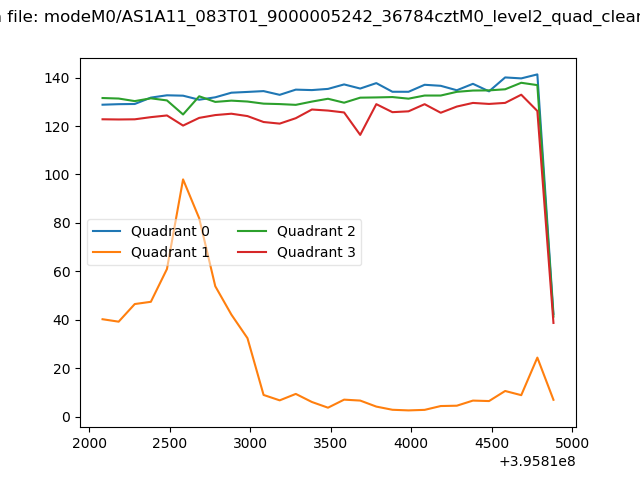 |
|
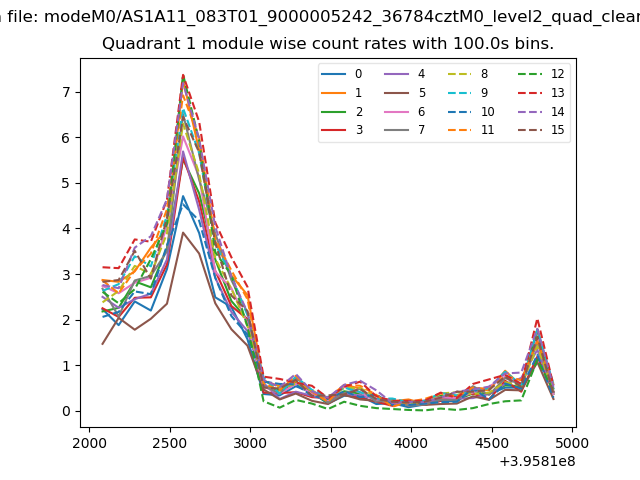
| Module-wise count rates for Quadrant A Data is divided into 100 sec bins |
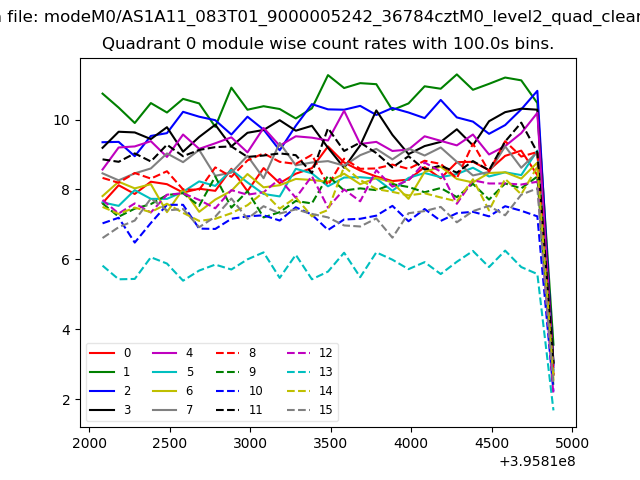 |
 |
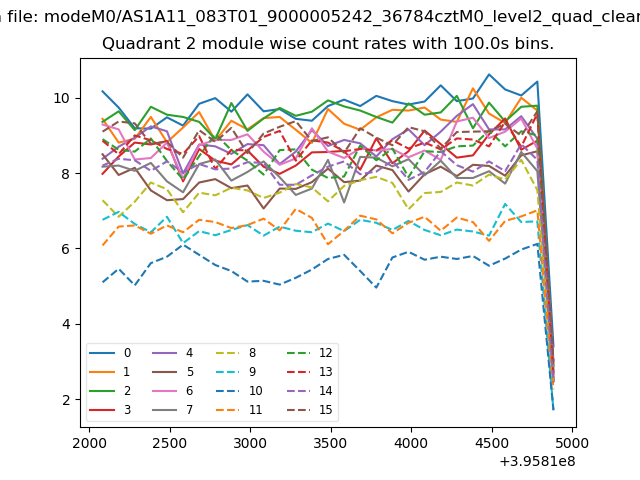
| Module-wise count rates for Quadrant B Data is divided into 100 sec bins |
 |
 |
| Module-wise count rates for Quadrant C Data is divided into 100 sec bins |
 |
 |
| Module-wise count rates for Quadrant D Data is divided into 100 sec bins |
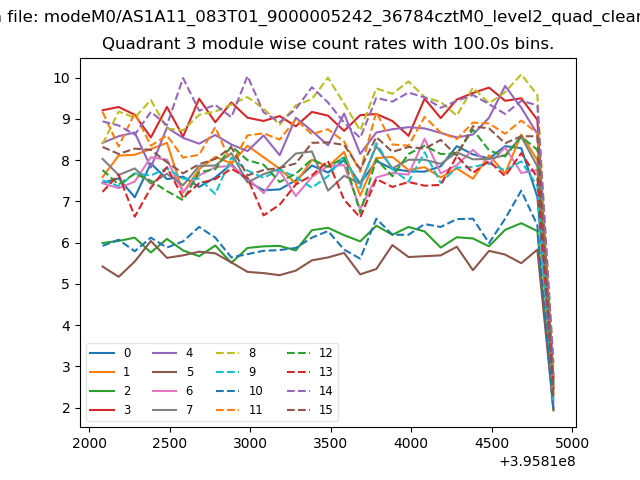 |
 |
| Parameter | Plot |
|---|---|
| CZT HV Monitor | 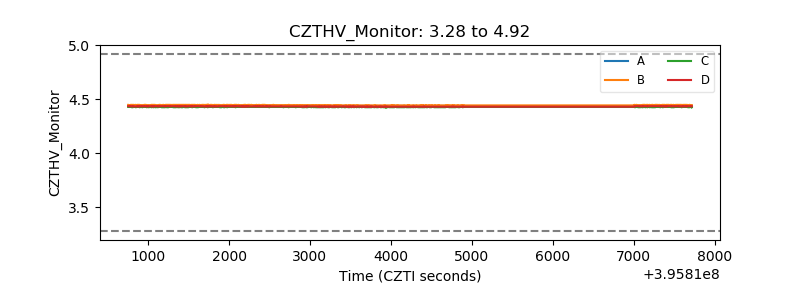 |
| D_VDD | 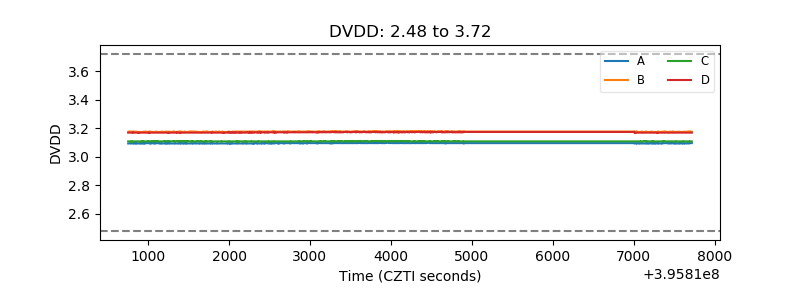 |
| Temperature 1 | 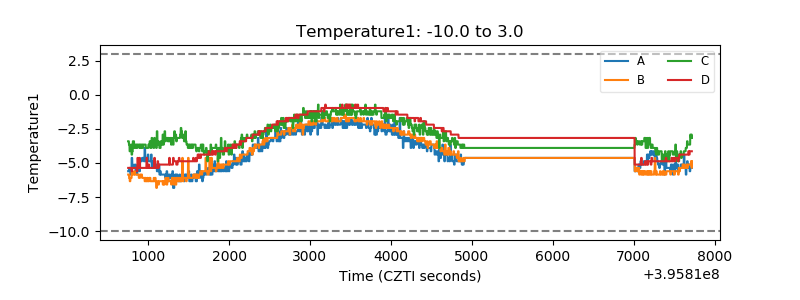 |
| Veto HV Monitor | 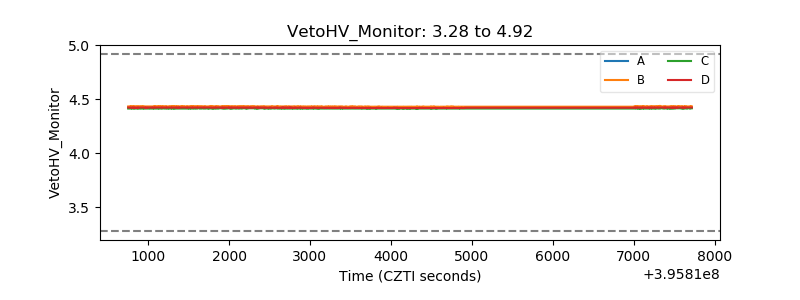 |
| Veto LLD | 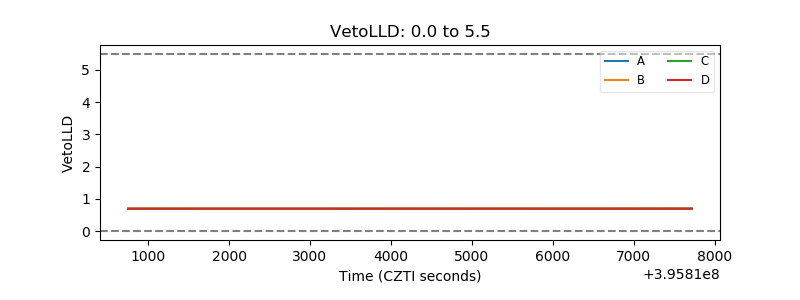 |
| Alpha Counter | 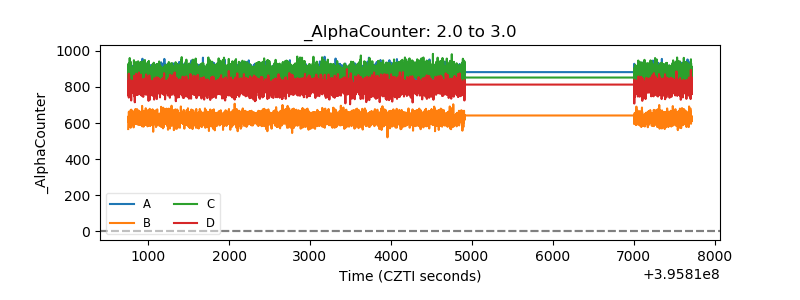 |
| _CPM_Rate | 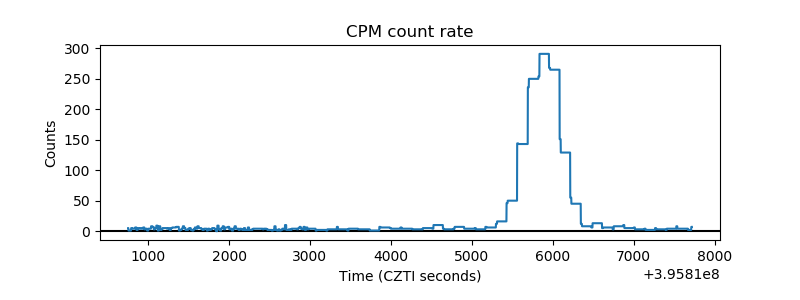 |
| CZT Counter |  |
| +2.5 Volts monitor |  |
| +5 Volts monitor |  |
| _ROLL_ROT | 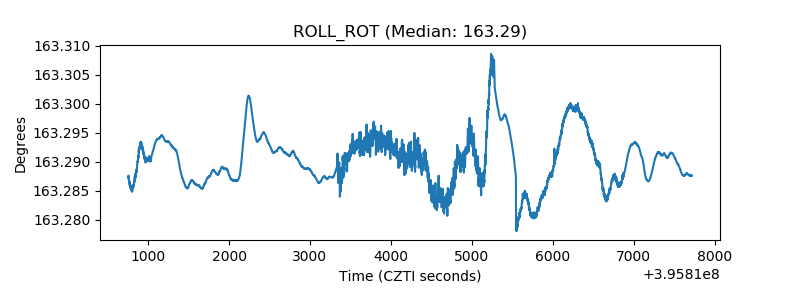 |
| _Roll_DEC | 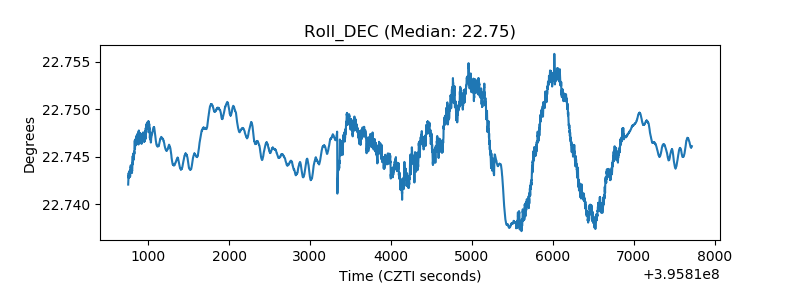 |
| _Roll_RA | 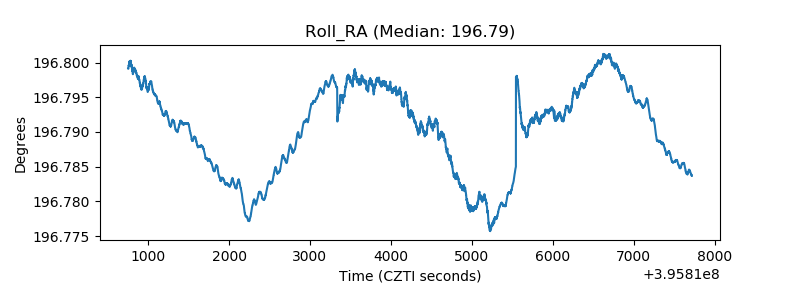 |
| Veto Counter | 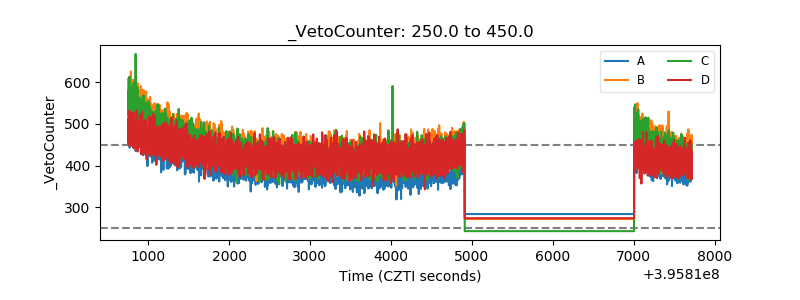 |