| Param | Original file | Final file |
|---|---|---|
| Filename | modeM0/AS1A11_083T01_9000005242_36786cztM0_level2.evt | modeM0/AS1A11_083T01_9000005242_36786cztM0_level2_quad_clean.evt |
| Size (bytes) | 688,536,000 | 75,723,840 |
| Size | 656.6 MB | 72.2 MB |
| Events in quadrant A | 3,106,861 | 549,169 |
| Events in quadrant B | 10,428,838 | 292,999 |
| Events in quadrant C | 3,009,214 | 543,644 |
| Events in quadrant D | 3,928,500 | 514,026 |
| Mode SS | |||
|---|---|---|---|
| Quadrant | BADHDUFLAG | Total packets | Discarded packets |
| A | 0 | 114 | 0 |
| B | 0 | 114 | 0 |
| C | 0 | 114 | 0 |
| D | 0 | 114 | 0 |
| Mode M9 | |||
|---|---|---|---|
| Quadrant | BADHDUFLAG | Total packets | Discarded packets |
| A | 0 | 28 | 0 |
| B | 0 | 28 | 0 |
| C | 0 | 28 | 0 |
| D | 0 | 29 | 0 |
| Mode M0 | |||
|---|---|---|---|
| Quadrant | BADHDUFLAG | Total packets | Discarded packets |
| A | 0 | 12700 | 3 |
| B | 0 | 34713 | 2 |
| C | 0 | 12236 | 2 |
| D | 0 | 15408 | 2 |
| Quadrant | Total seconds | Saturated seconds | Saturation percentage |
|---|---|---|---|
| A | 5602 | 87 | 1.553017% |
| B | 5602 | 3349 | 59.782221% |
| C | 5602 | 36 | 0.642628% |
| D | 5602 | 87 | 1.553017% |
Noise dominated data is calculated using 1-second bins in cleaned event files. If a bin has >2000 counts, and if more than 50% of those come from <1% of pixels, then it is considered to be noise-dominated and hence unusable.
| Quadrant | # 1 sec bins | Bins with >0 counts | Bins with >2000 counts | High rate bins dominated by noise | Noise dominated (total time) | Noise dominated (detector-on time) | Marked lightcurve |
|---|---|---|---|---|---|---|---|
| A | 7156 | 5603 | 46 | 46 | 0.64% | 0.82% | 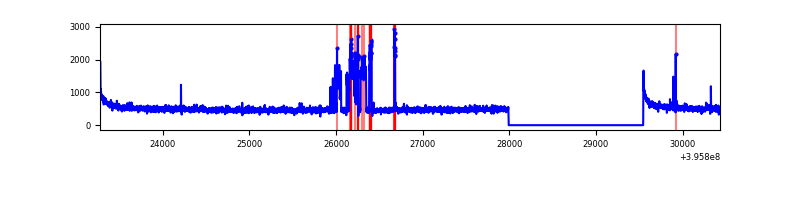 |
| B | 7156 | 5602 | 3239 | 3239 | 45.26% | 57.82% | 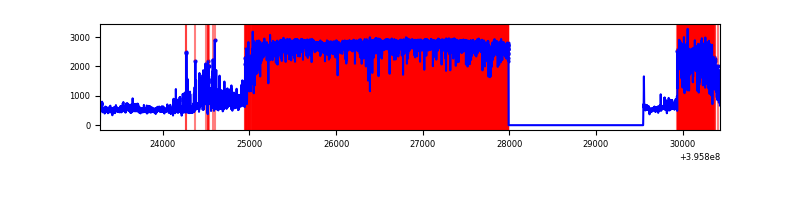 |
| C | 7156 | 5603 | 34 | 34 | 0.48% | 0.61% | 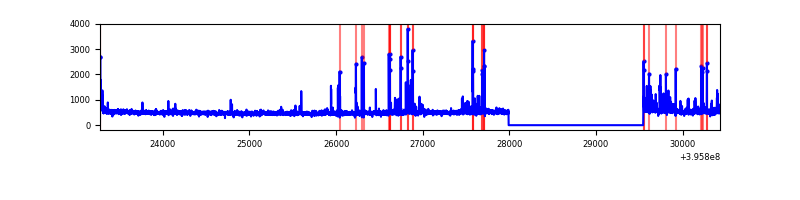 |
| D | 7156 | 5603 | 86 | 86 | 1.20% | 1.53% | 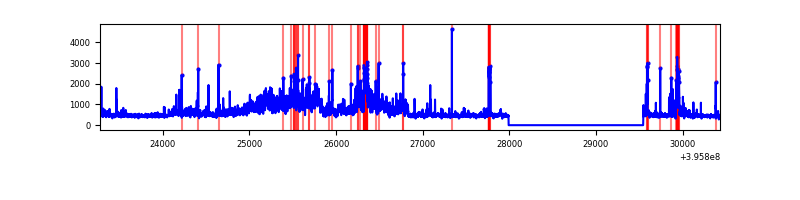 |
Top three noisy pixels from each quadrant. If the there are fewer than three noisy pixels in the level2.evt file, extra rows are filled as -1
| Pixel properties | Quadrant properties | ||||||
|---|---|---|---|---|---|---|---|
| Quadrant | DetID | PixID | Counts | Sigma | Mean | Median | Sigma |
| A | 15 | 223 | 357217 | 2720.94 | 645 | 631 | 131.1 |
| A | 10 | 83 | 226480 | 1723.35 | 645 | 631 | 131.1 |
| A | 13 | 6 | 12339 | 89.34 | 645 | 631 | 131.1 |
| B | 12 | 1 | 8448780 | 109856.15 | 390 | 381 | 76.9 |
| B | 4 | 171 | 286243 | 3717.12 | 390 | 381 | 76.9 |
| B | 4 | 80 | 26169 | 335.33 | 390 | 381 | 76.9 |
| C | 15 | 214 | 258242 | 1758.36 | 624 | 628 | 146.5 |
| C | 0 | 207 | 231673 | 1577.01 | 624 | 628 | 146.5 |
| C | 0 | 10 | 51553 | 347.59 | 624 | 628 | 146.5 |
| D | 12 | 235 | 955548 | 6181.69 | 624 | 606 | 154.5 |
| D | 13 | 249 | 143405 | 924.39 | 624 | 606 | 154.5 |
| D | 2 | 250 | 122318 | 787.89 | 624 | 606 | 154.5 |
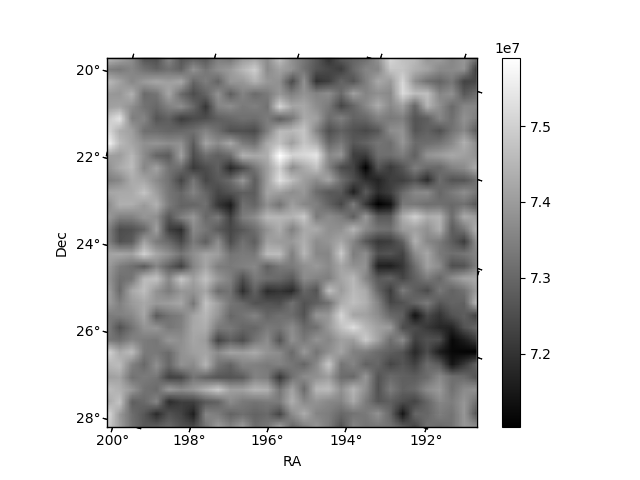
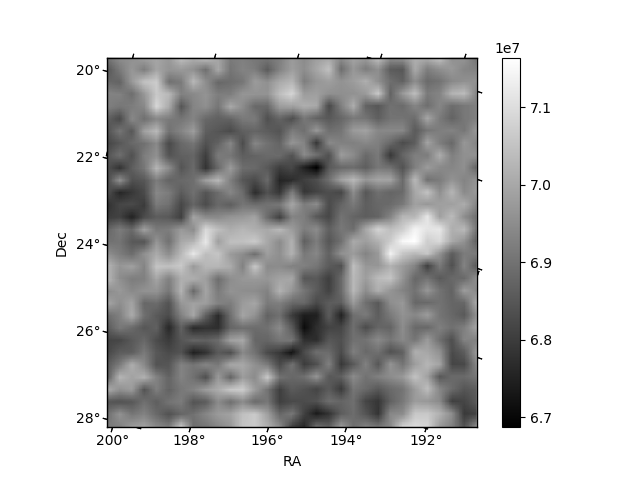
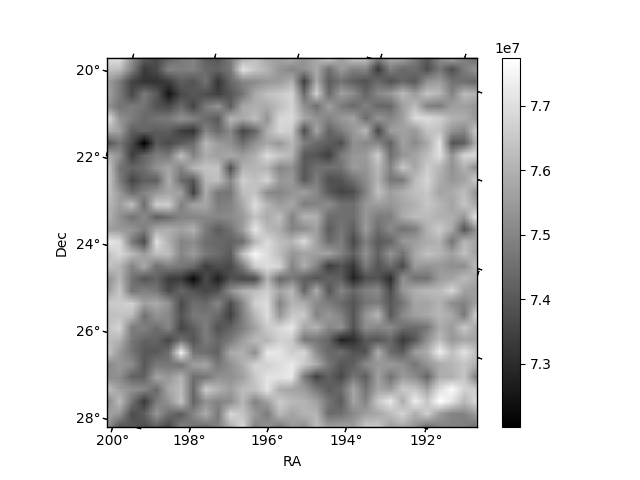
Histogram calculated using DETX and DETY for each event in the final _common_clean file
| Quadrant A | 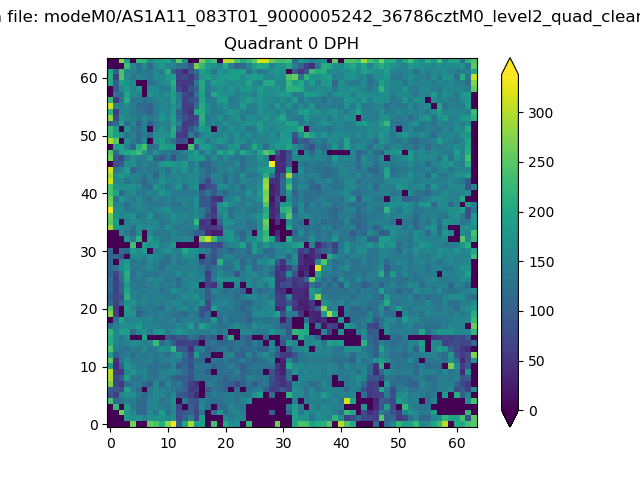 |
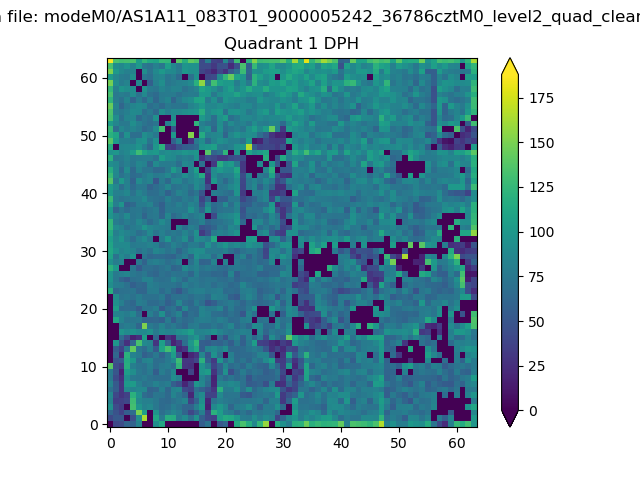 |
Quadrant B |
|---|---|---|---|
| Quadrant D | 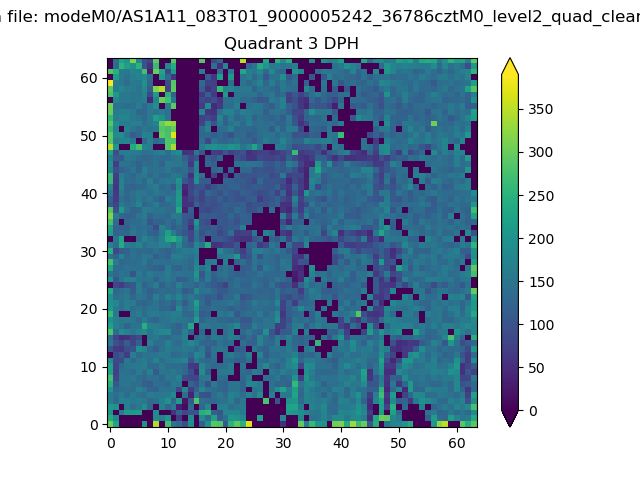 |
 |
Quadrant C |
| Plot type | Count rate plots | Images |
|---|---|---|
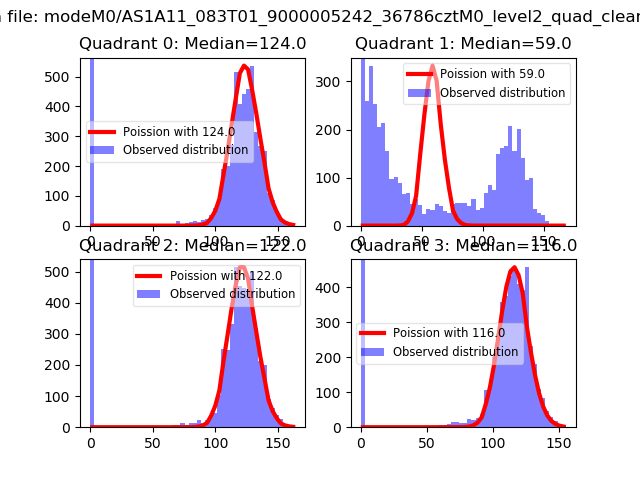
| Comparison with Poisson distribution Blue bars denote a histogram of data divided into 1 sec bins. Red curve is a Poisson curve with rate = median count rate of data. |
 |
 |
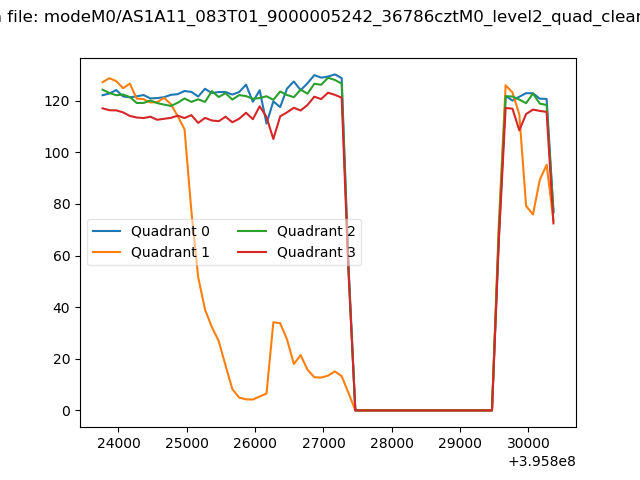
| Quadrant-wise count rates Data is divided into 100 sec bins |
 |
|
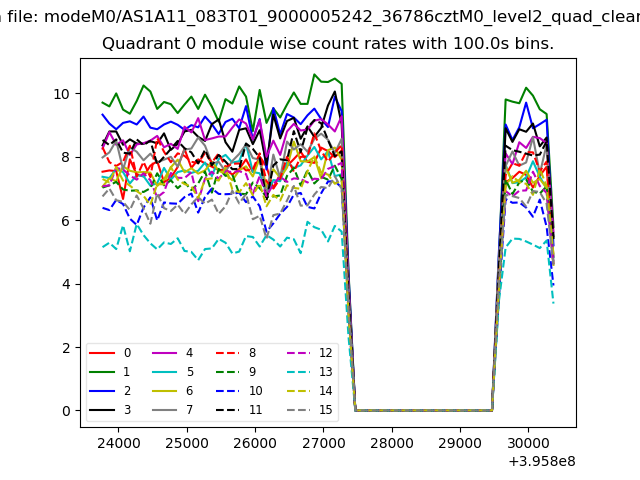
| Module-wise count rates for Quadrant A Data is divided into 100 sec bins |
 |
 |
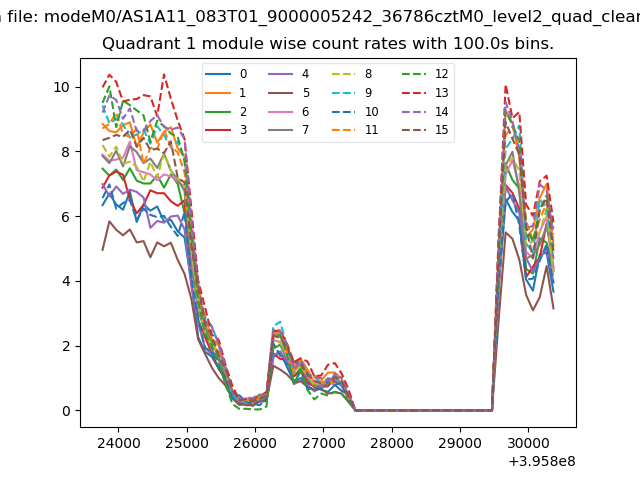
| Module-wise count rates for Quadrant B Data is divided into 100 sec bins |
 |
 |
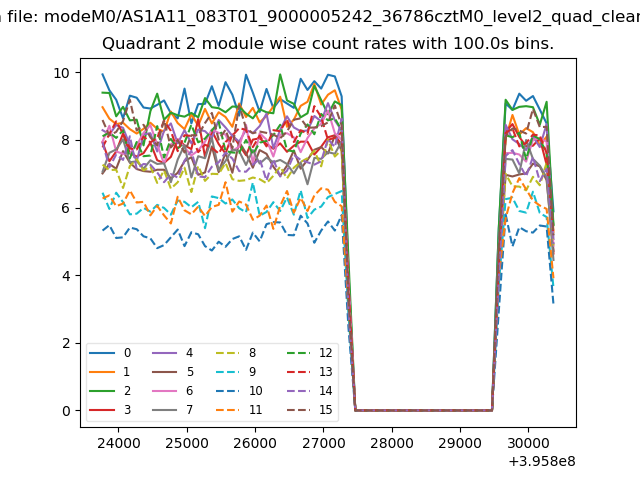
| Module-wise count rates for Quadrant C Data is divided into 100 sec bins |
 |
 |
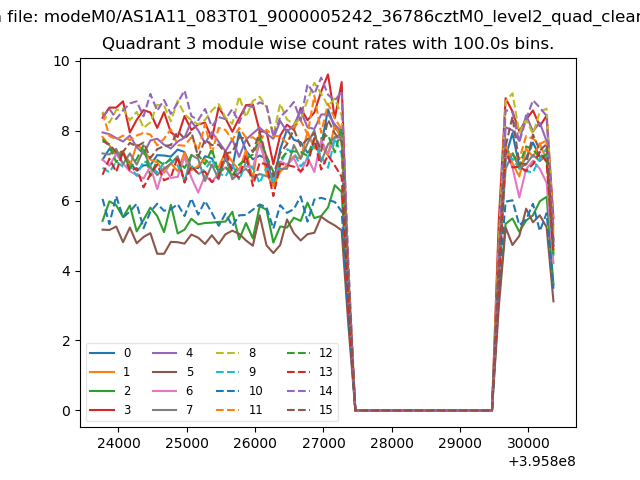
| Module-wise count rates for Quadrant D Data is divided into 100 sec bins |
 |
 |
| Parameter | Plot |
|---|---|
| CZT HV Monitor | 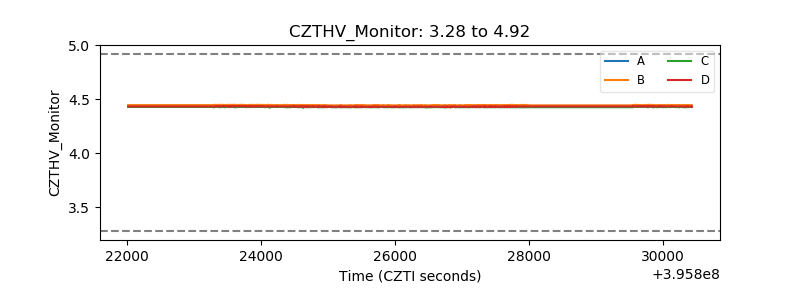 |
| D_VDD | 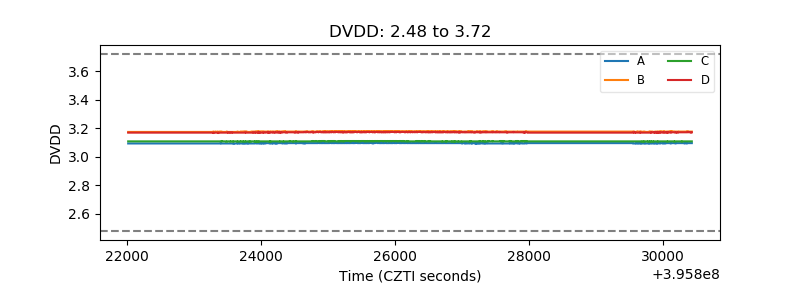 |
| Temperature 1 | 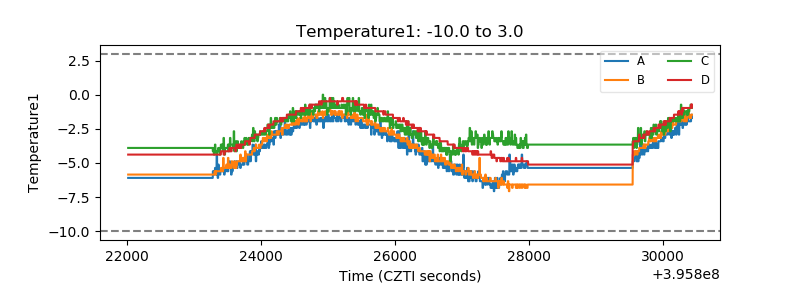 |
| Veto HV Monitor | 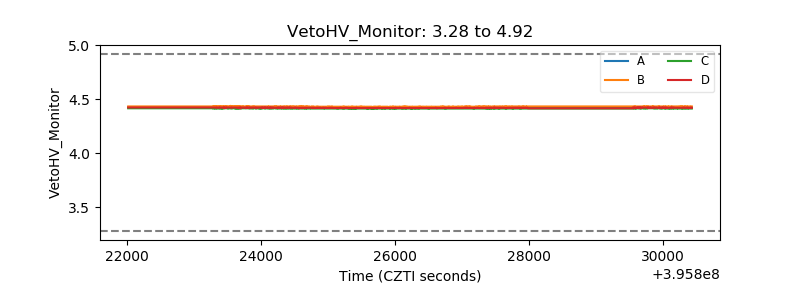 |
| Veto LLD | 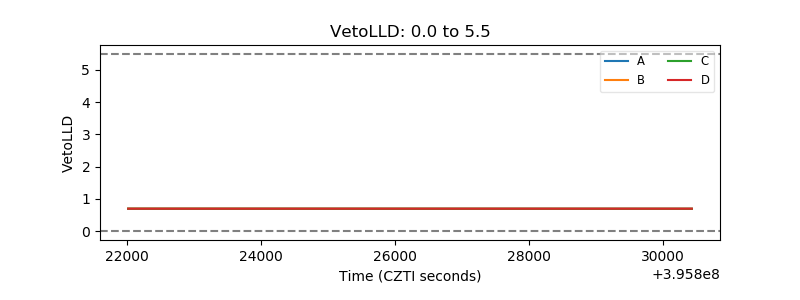 |
| Alpha Counter | 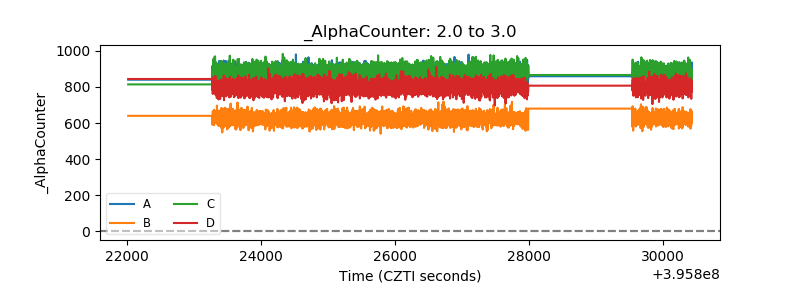 |
| _CPM_Rate | 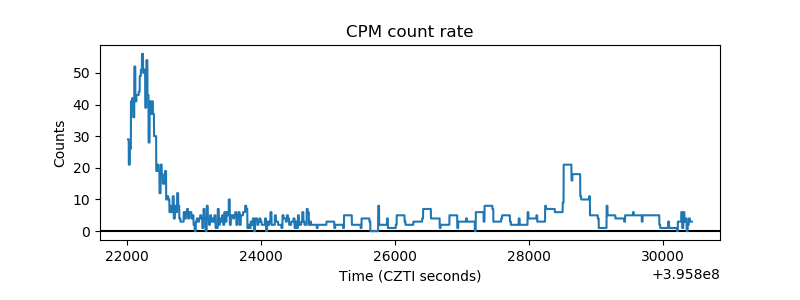 |
| CZT Counter | 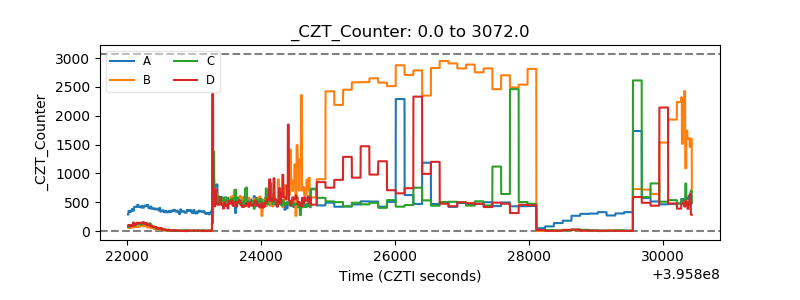 |
| +2.5 Volts monitor |  |
| +5 Volts monitor |  |
| _ROLL_ROT | 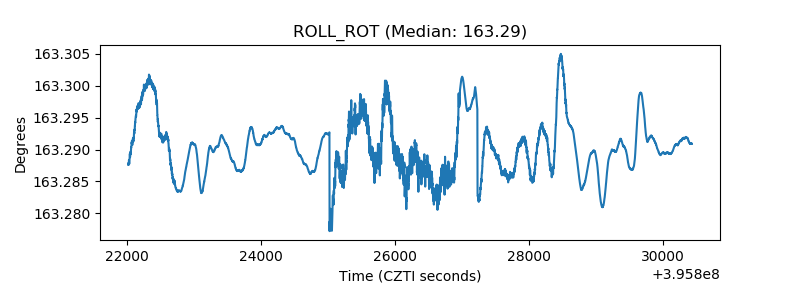 |
| _Roll_DEC | 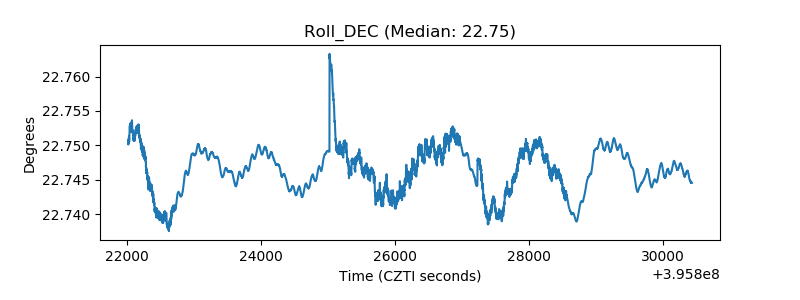 |
| _Roll_RA |  |
| Veto Counter | 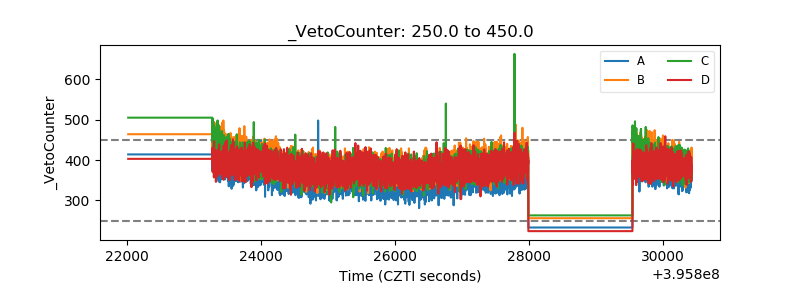 |