| Param | Original file | Final file |
|---|---|---|
| Filename | modeM0/AS1A11_083T01_9000005242_36787cztM0_level2.evt | modeM0/AS1A11_083T01_9000005242_36787cztM0_level2_quad_clean.evt |
| Size (bytes) | 714,107,520 | 78,396,480 |
| Size | 681.0 MB | 74.8 MB |
| Events in quadrant A | 2,931,054 | 568,221 |
| Events in quadrant B | 11,596,338 | 295,498 |
| Events in quadrant C | 3,382,054 | 558,789 |
| Events in quadrant D | 3,314,647 | 534,355 |
| Mode SS | |||
|---|---|---|---|
| Quadrant | BADHDUFLAG | Total packets | Discarded packets |
| A | 0 | 122 | 0 |
| B | 0 | 122 | 0 |
| C | 0 | 122 | 0 |
| D | 0 | 122 | 0 |
| Mode M9 | |||
|---|---|---|---|
| Quadrant | BADHDUFLAG | Total packets | Discarded packets |
| A | 0 | 18 | 0 |
| B | 0 | 18 | 0 |
| C | 0 | 18 | 0 |
| D | 0 | 19 | 0 |
| Mode M0 | |||
|---|---|---|---|
| Quadrant | BADHDUFLAG | Total packets | Discarded packets |
| A | 0 | 12442 | 3 |
| B | 0 | 38474 | 2 |
| C | 0 | 13633 | 2 |
| D | 0 | 13846 | 2 |
| Quadrant | Total seconds | Saturated seconds | Saturation percentage |
|---|---|---|---|
| A | 5948 | 12 | 0.201748% |
| B | 5948 | 3614 | 60.759919% |
| C | 5948 | 60 | 1.008742% |
| D | 5948 | 117 | 1.967048% |
Noise dominated data is calculated using 1-second bins in cleaned event files. If a bin has >2000 counts, and if more than 50% of those come from <1% of pixels, then it is considered to be noise-dominated and hence unusable.
| Quadrant | # 1 sec bins | Bins with >0 counts | Bins with >2000 counts | High rate bins dominated by noise | Noise dominated (total time) | Noise dominated (detector-on time) | Marked lightcurve |
|---|---|---|---|---|---|---|---|
| A | 7291 | 5949 | 1 | 1 | 0.01% | 0.02% | 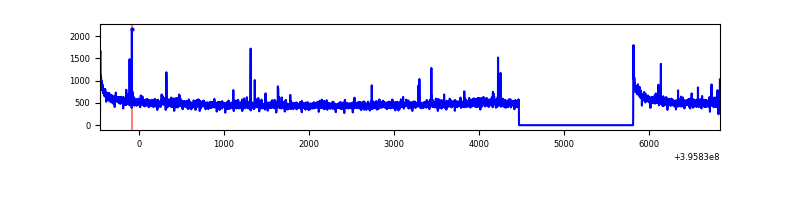 |
| B | 7291 | 5949 | 3266 | 3266 | 44.79% | 54.90% | 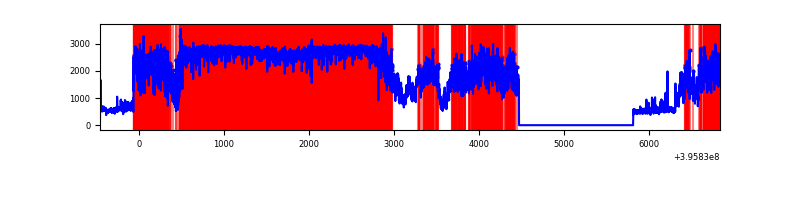 |
| C | 7291 | 5949 | 55 | 55 | 0.75% | 0.92% | 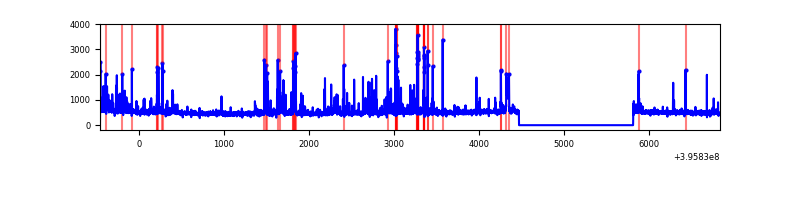 |
| D | 7291 | 5949 | 99 | 99 | 1.36% | 1.66% | 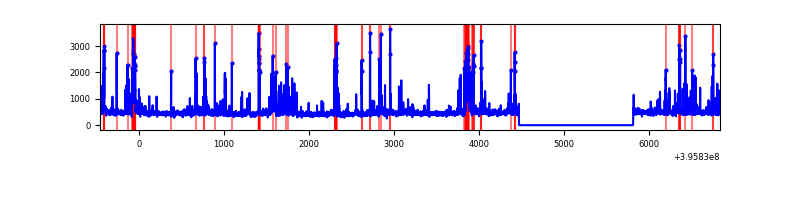 |
Top three noisy pixels from each quadrant. If the there are fewer than three noisy pixels in the level2.evt file, extra rows are filled as -1
| Pixel properties | Quadrant properties | ||||||
|---|---|---|---|---|---|---|---|
| Quadrant | DetID | PixID | Counts | Sigma | Mean | Median | Sigma |
| A | 10 | 83 | 243044 | 1754.46 | 682 | 668 | 138.1 |
| A | 9 | 143 | 29009 | 205.15 | 682 | 668 | 138.1 |
| A | 13 | 254 | 9279 | 62.33 | 682 | 668 | 138.1 |
| B | 12 | 1 | 9553862 | 110591.81 | 444 | 431 | 86.4 |
| B | 4 | 171 | 65882 | 757.67 | 444 | 431 | 86.4 |
| B | 0 | 190 | 39287 | 449.8 | 444 | 431 | 86.4 |
| C | 0 | 207 | 297808 | 1947.61 | 657 | 660 | 152.6 |
| C | 15 | 214 | 271237 | 1773.46 | 657 | 660 | 152.6 |
| C | 14 | 254 | 175888 | 1148.51 | 657 | 660 | 152.6 |
| D | 13 | 249 | 308132 | 1890.45 | 660 | 641 | 162.7 |
| D | 2 | 250 | 107313 | 655.82 | 660 | 641 | 162.7 |
| D | 2 | 249 | 89013 | 543.31 | 660 | 641 | 162.7 |
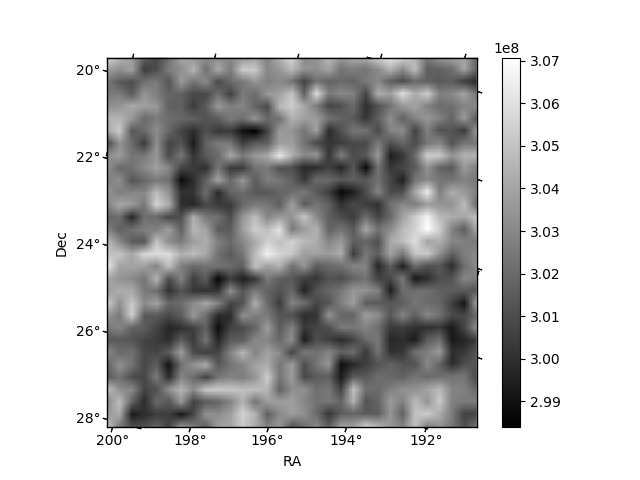
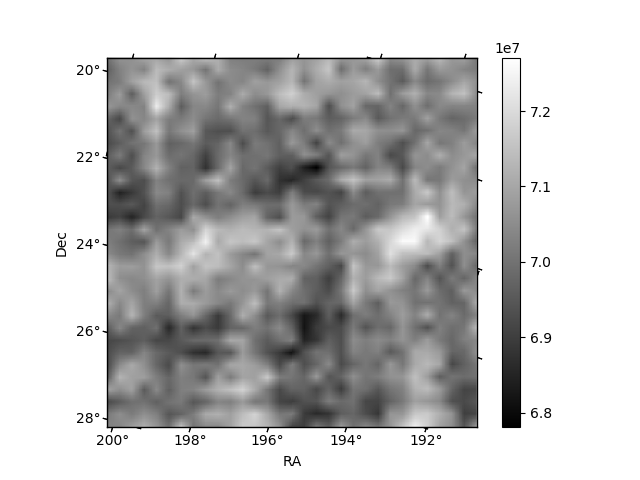
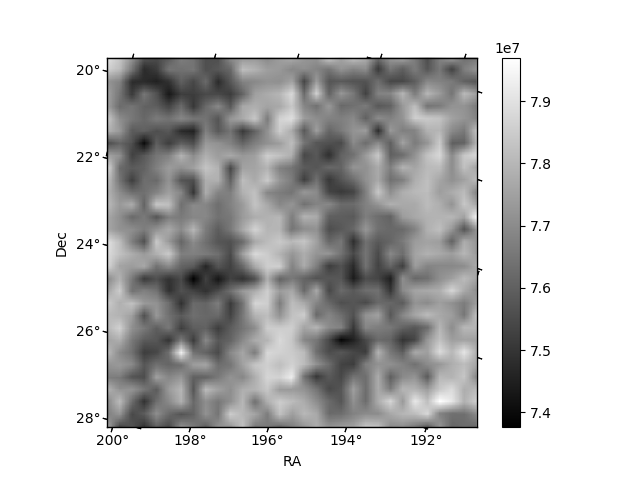
Histogram calculated using DETX and DETY for each event in the final _common_clean file
| Quadrant A | 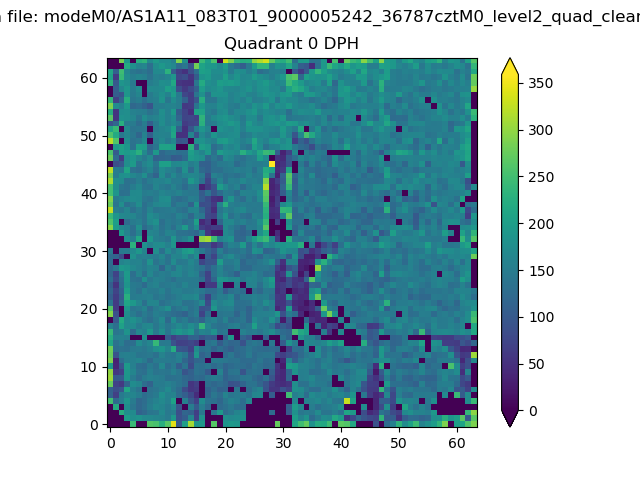 |
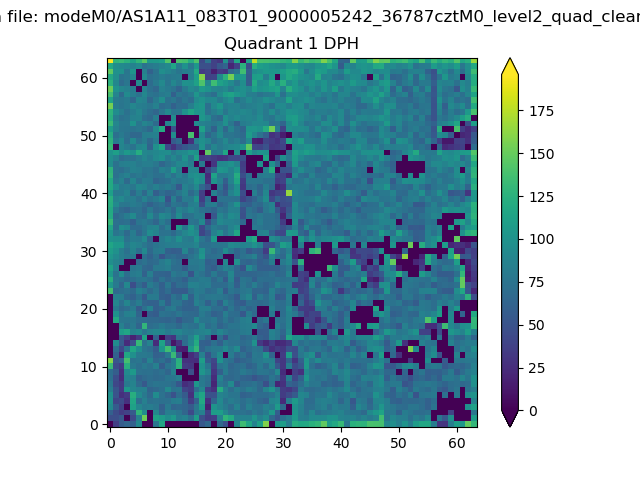 |
Quadrant B |
|---|---|---|---|
| Quadrant D | 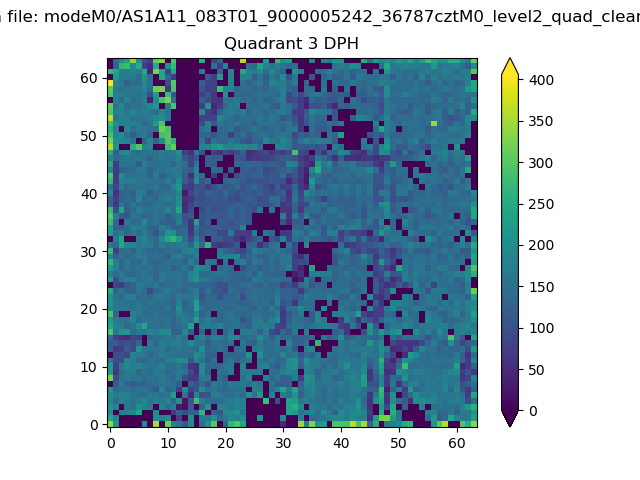 |
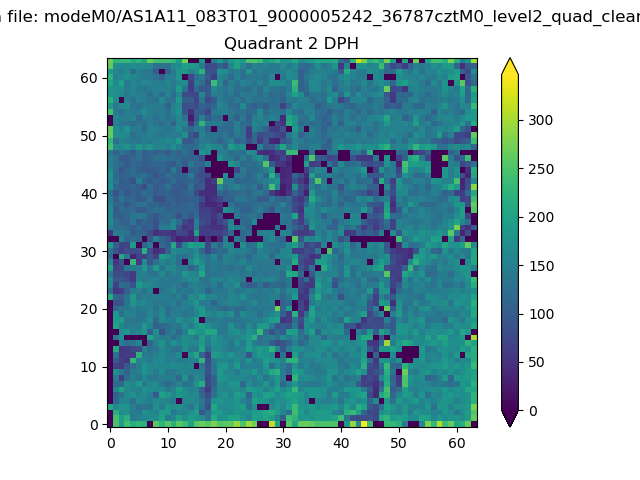 |
Quadrant C |
| Plot type | Count rate plots | Images |
|---|---|---|
| Comparison with Poisson distribution Blue bars denote a histogram of data divided into 1 sec bins. Red curve is a Poisson curve with rate = median count rate of data. |
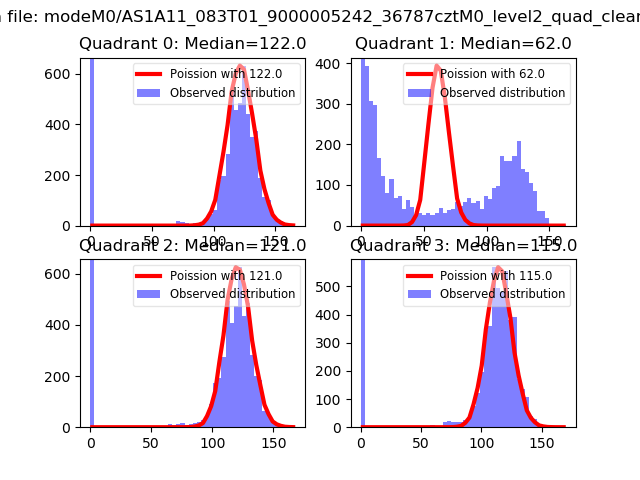 |
 |
| Quadrant-wise count rates Data is divided into 100 sec bins |
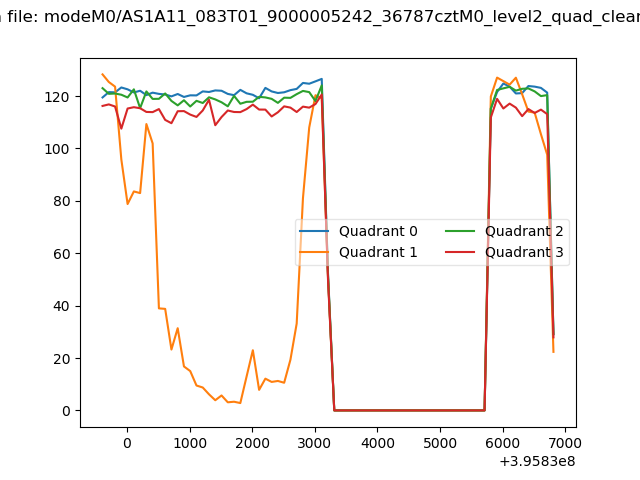 |
|
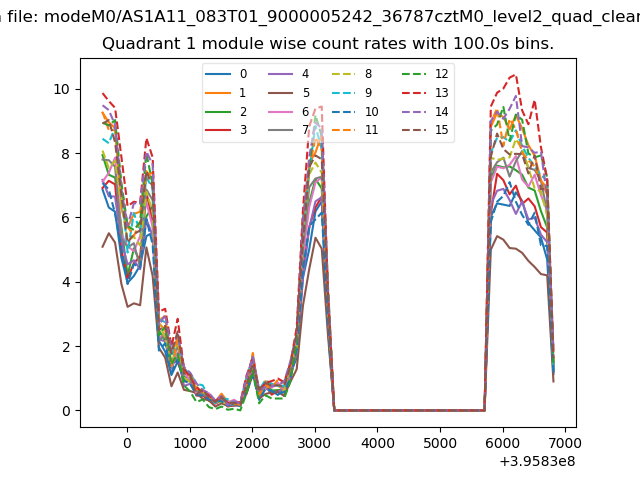
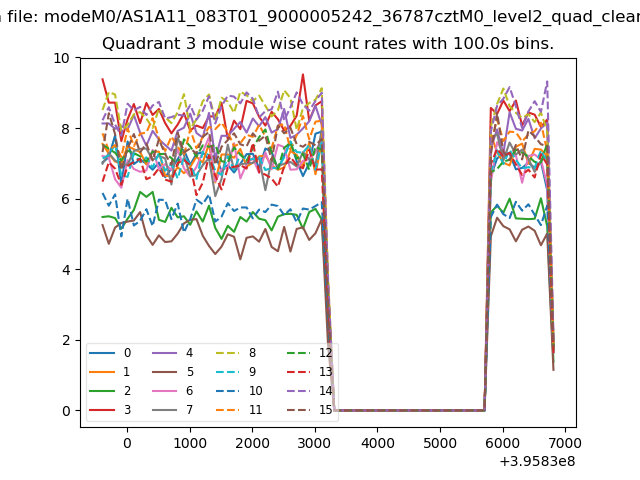
| Module-wise count rates for Quadrant A Data is divided into 100 sec bins |
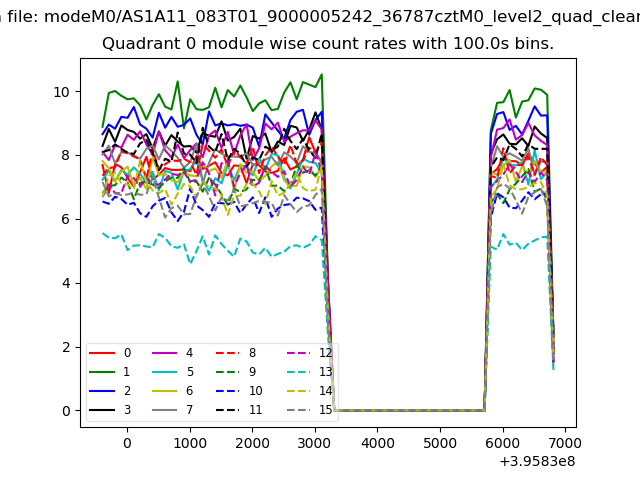 |
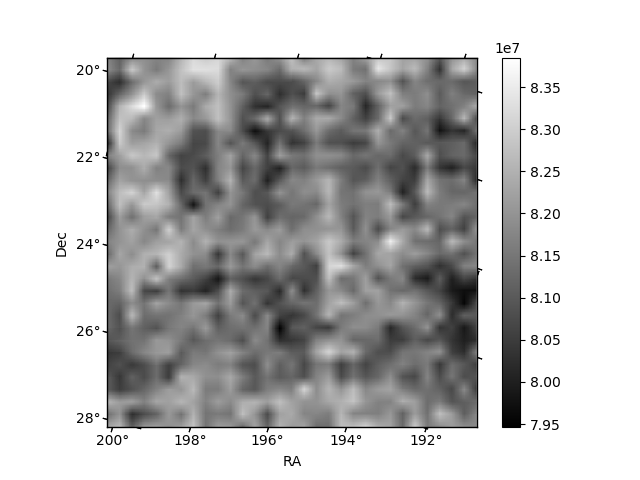 |
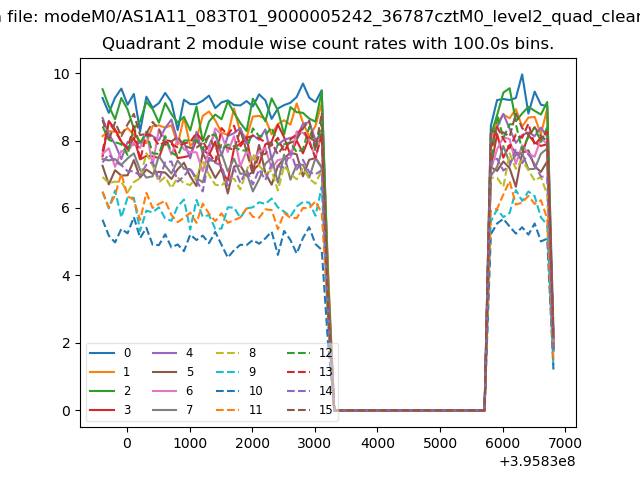
| Module-wise count rates for Quadrant B Data is divided into 100 sec bins |
 |
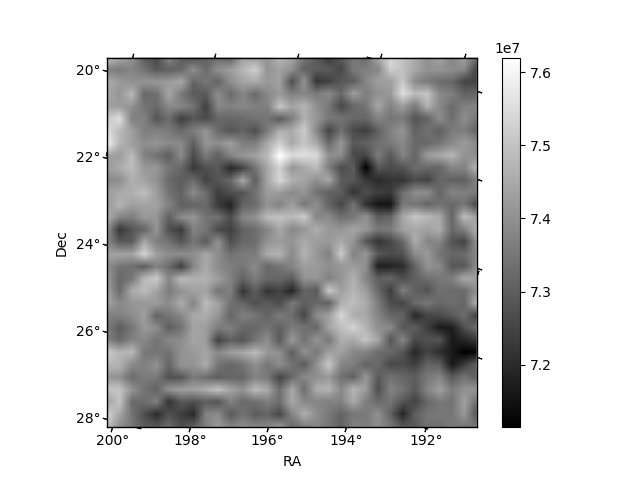 |
| Module-wise count rates for Quadrant C Data is divided into 100 sec bins |
 |
 |
| Module-wise count rates for Quadrant D Data is divided into 100 sec bins |
 |
 |
| Parameter | Plot |
|---|---|
| CZT HV Monitor | 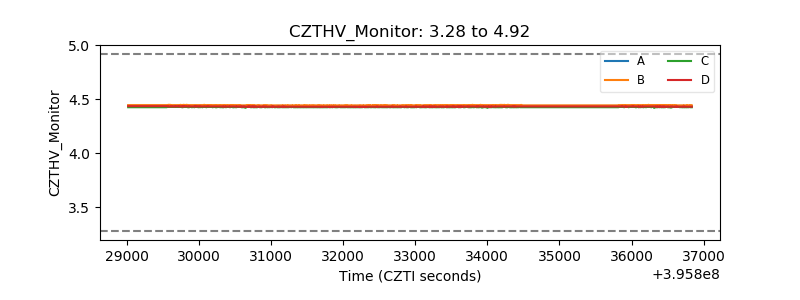 |
| D_VDD | 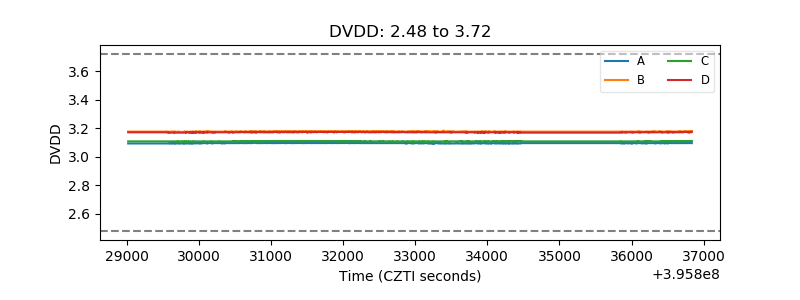 |
| Temperature 1 | 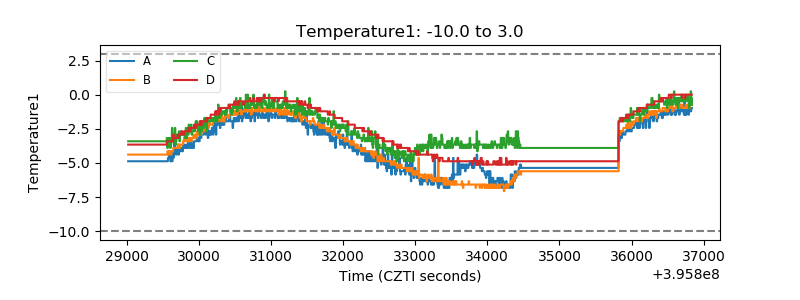 |
| Veto HV Monitor |  |
| Veto LLD |  |
| Alpha Counter |  |
| _CPM_Rate |  |
| CZT Counter | 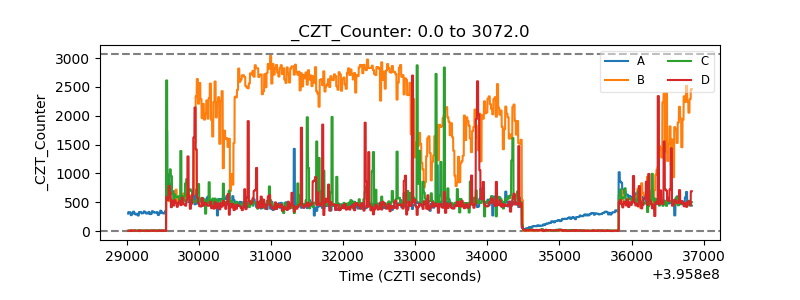 |
| +2.5 Volts monitor |  |
| +5 Volts monitor |  |
| _ROLL_ROT | 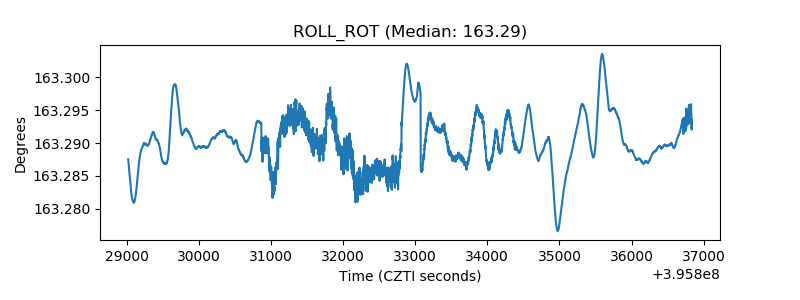 |
| _Roll_DEC | 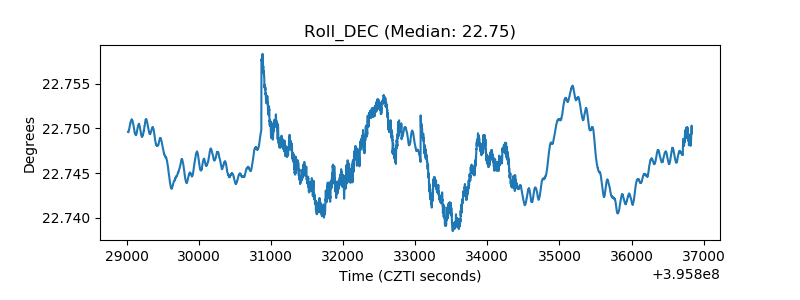 |
| _Roll_RA | 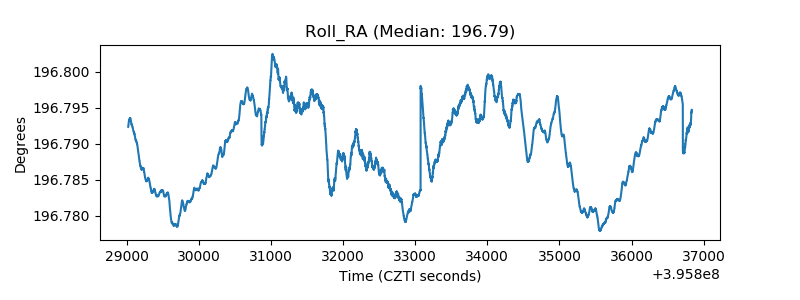 |
| Veto Counter | 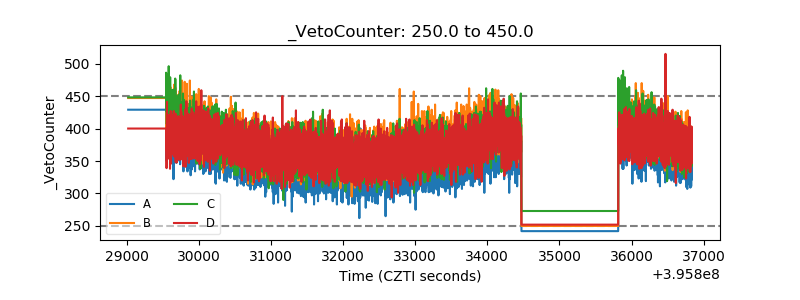 |