| Param | Original file | Final file |
|---|---|---|
| Filename | modeM0/AS1A11_083T01_9000005242_36790cztM0_level2.evt | modeM0/AS1A11_083T01_9000005242_36790cztM0_level2_quad_clean.evt |
| Size (bytes) | 1,475,527,680 | 106,755,840 |
| Size | 1.4 GB | 101.8 MB |
| Events in quadrant A | 5,262,300 | 749,608 |
| Events in quadrant B | 26,347,229 | 316,564 |
| Events in quadrant C | 5,831,972 | 734,375 |
| Events in quadrant D | 6,537,730 | 702,234 |
| Mode SS | |||
|---|---|---|---|
| Quadrant | BADHDUFLAG | Total packets | Discarded packets |
| A | 0 | 212 | 0 |
| B | 0 | 212 | 0 |
| C | 0 | 212 | 0 |
| D | 0 | 212 | 0 |
| Mode M9 | |||
|---|---|---|---|
| Quadrant | BADHDUFLAG | Total packets | Discarded packets |
| A | 0 | 29 | 0 |
| B | 0 | 29 | 0 |
| C | 0 | 29 | 0 |
| D | 0 | 29 | 0 |
| Mode M0 | |||
|---|---|---|---|
| Quadrant | BADHDUFLAG | Total packets | Discarded packets |
| A | 0 | 22449 | 3 |
| B | 0 | 85471 | 2 |
| C | 0 | 23813 | 2 |
| D | 0 | 26596 | 2 |
| Quadrant | Total seconds | Saturated seconds | Saturation percentage |
|---|---|---|---|
| A | 10508 | 68 | 0.647126% |
| B | 10508 | 9720 | 92.500952% |
| C | 10508 | 115 | 1.094404% |
| D | 10508 | 278 | 2.645603% |
Noise dominated data is calculated using 1-second bins in cleaned event files. If a bin has >2000 counts, and if more than 50% of those come from <1% of pixels, then it is considered to be noise-dominated and hence unusable.
| Quadrant | # 1 sec bins | Bins with >0 counts | Bins with >2000 counts | High rate bins dominated by noise | Noise dominated (total time) | Noise dominated (detector-on time) | Marked lightcurve |
|---|---|---|---|---|---|---|---|
| A | 13282 | 10510 | 45 | 45 | 0.34% | 0.43% | 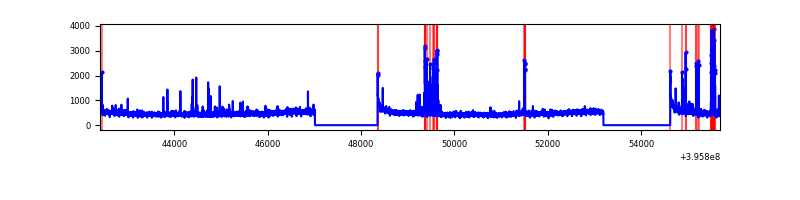 |
| B | 13282 | 10508 | 9478 | 9478 | 71.36% | 90.20% | 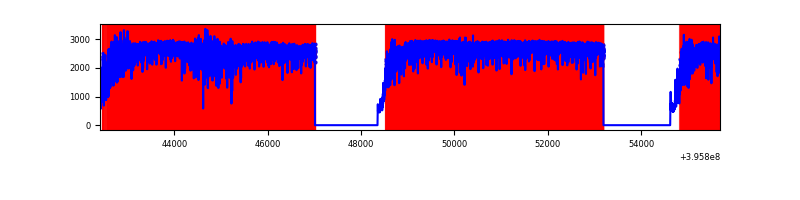 |
| C | 13282 | 10509 | 96 | 96 | 0.72% | 0.91% | 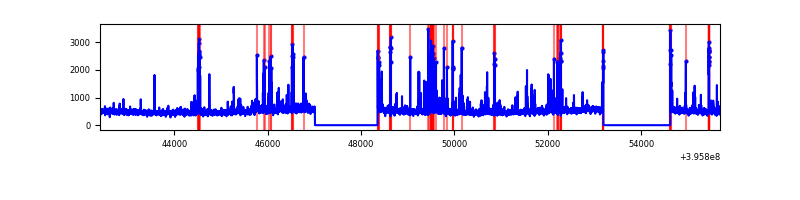 |
| D | 13282 | 10510 | 225 | 225 | 1.69% | 2.14% | 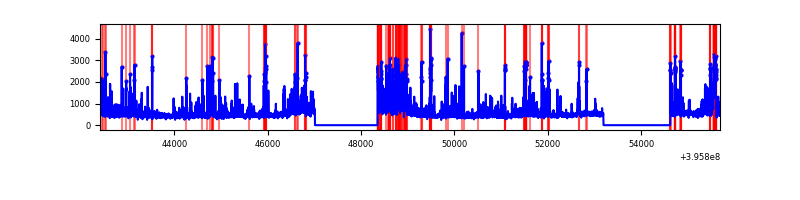 |
Top three noisy pixels from each quadrant. If the there are fewer than three noisy pixels in the level2.evt file, extra rows are filled as -1
| Pixel properties | Quadrant properties | ||||||
|---|---|---|---|---|---|---|---|
| Quadrant | DetID | PixID | Counts | Sigma | Mean | Median | Sigma |
| A | 10 | 83 | 375716 | 1557.64 | 1183 | 1158 | 240.5 |
| A | 13 | 248 | 197593 | 816.89 | 1183 | 1158 | 240.5 |
| A | 9 | 143 | 58339 | 237.79 | 1183 | 1158 | 240.5 |
| B | 12 | 1 | 23698866 | 264533.28 | 469 | 457 | 89.6 |
| B | 4 | 171 | 343414 | 3828.25 | 469 | 457 | 89.6 |
| B | 5 | 172 | 92431 | 1026.65 | 469 | 457 | 89.6 |
| C | 14 | 254 | 502546 | 1873.38 | 1152 | 1161 | 267.6 |
| C | 15 | 214 | 473976 | 1766.63 | 1152 | 1161 | 267.6 |
| C | 0 | 207 | 267104 | 993.67 | 1152 | 1161 | 267.6 |
| D | 12 | 227 | 483193 | 1739.28 | 1146 | 1115 | 277.2 |
| D | 13 | 249 | 475006 | 1709.74 | 1146 | 1115 | 277.2 |
| D | 2 | 153 | 196169 | 703.73 | 1146 | 1115 | 277.2 |
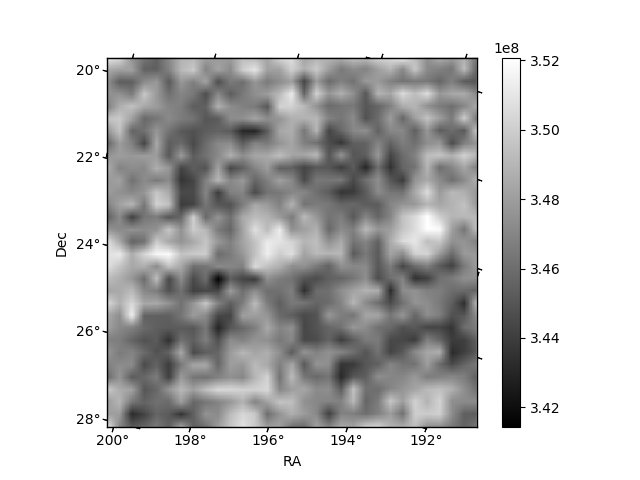
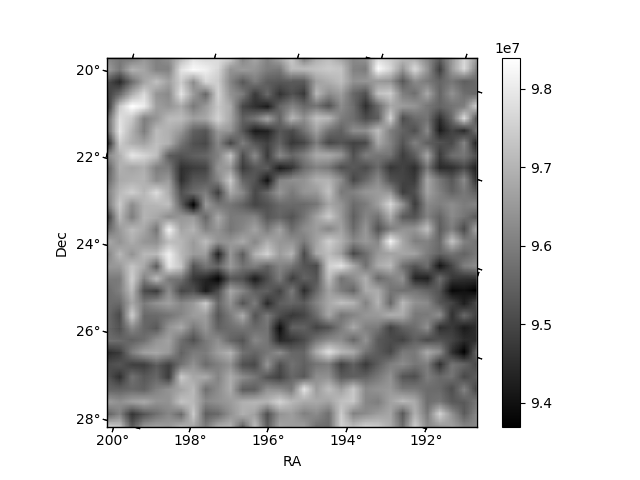
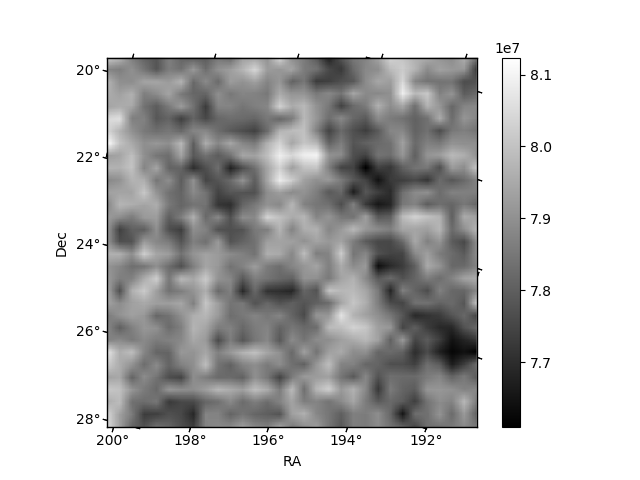
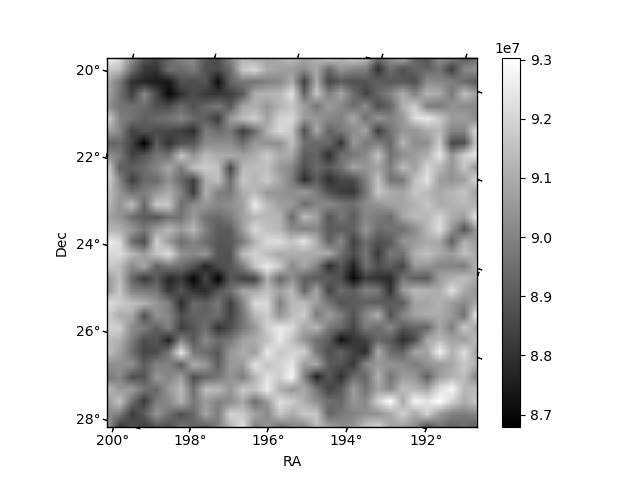
Histogram calculated using DETX and DETY for each event in the final _common_clean file
| Quadrant A | 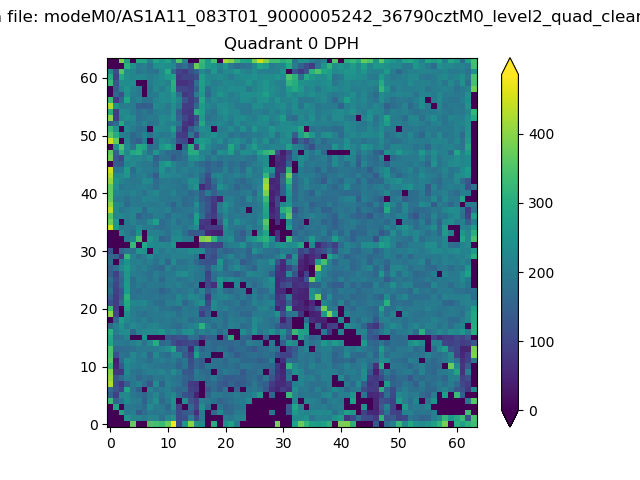 |
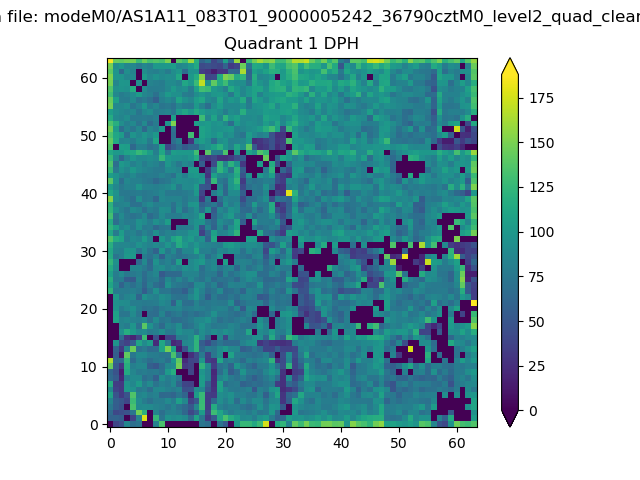 |
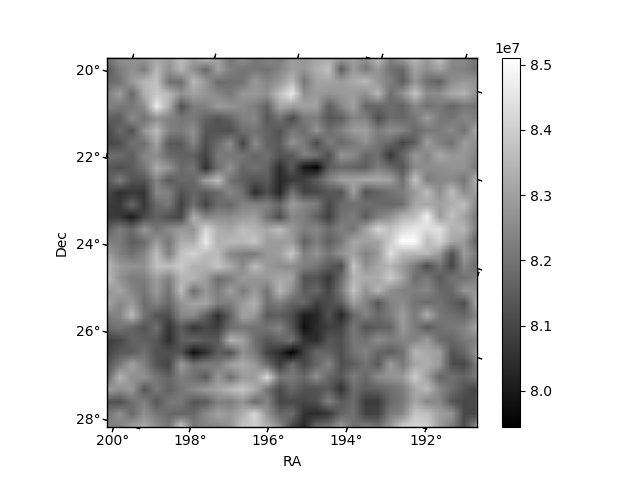
Quadrant B |
|---|---|---|---|
| Quadrant D | 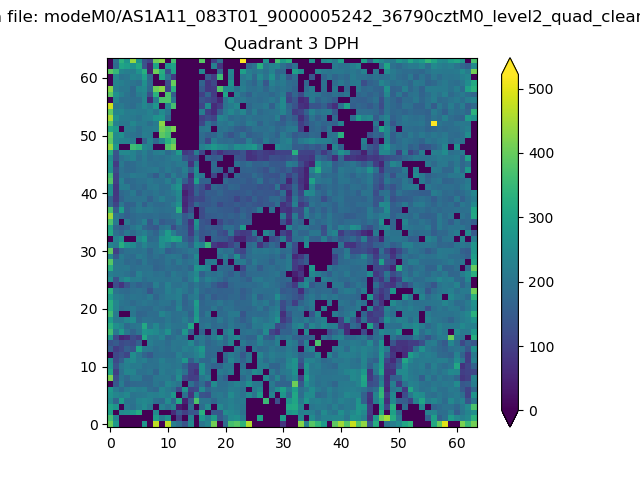 |
 |
Quadrant C |
| Plot type | Count rate plots | Images |
|---|---|---|
| Comparison with Poisson distribution Blue bars denote a histogram of data divided into 1 sec bins. Red curve is a Poisson curve with rate = median count rate of data. |
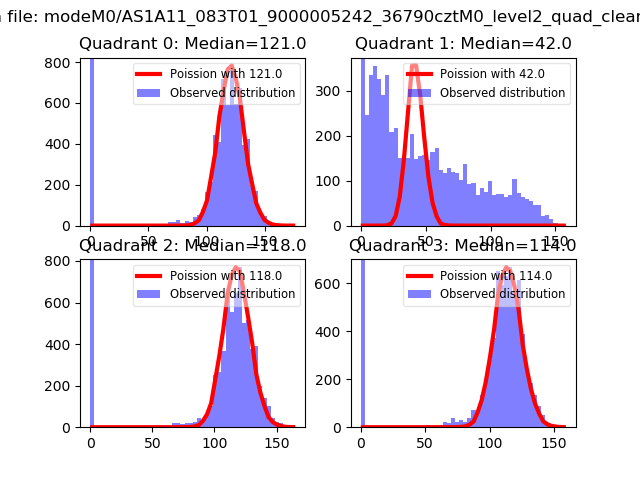 |
 |
| Quadrant-wise count rates Data is divided into 100 sec bins |
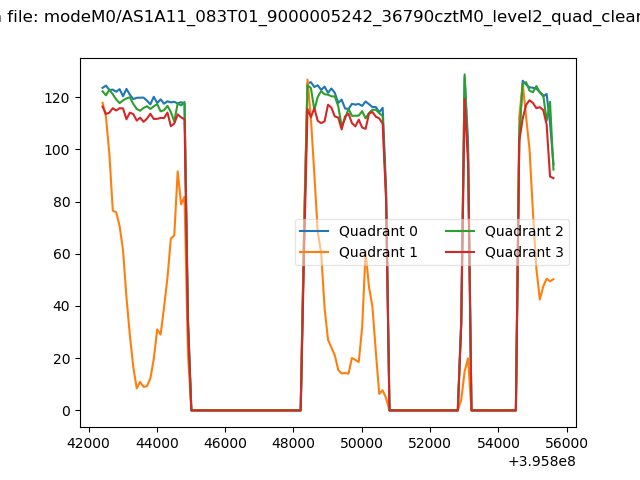 |
|
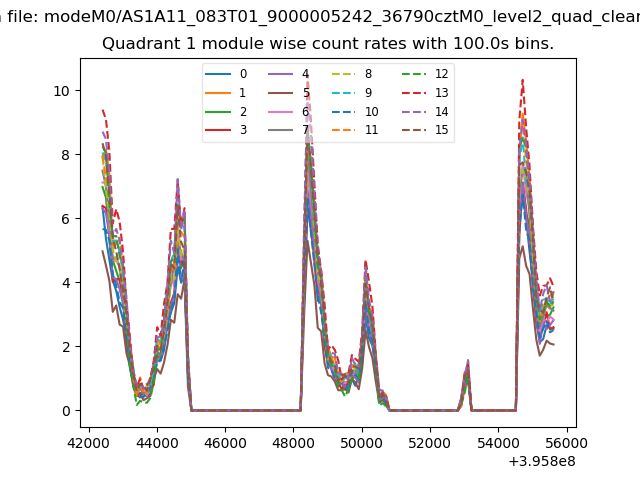
| Module-wise count rates for Quadrant A Data is divided into 100 sec bins |
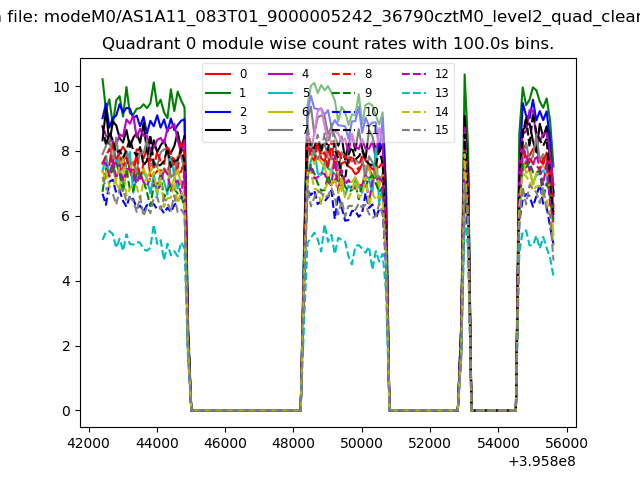 |
 |
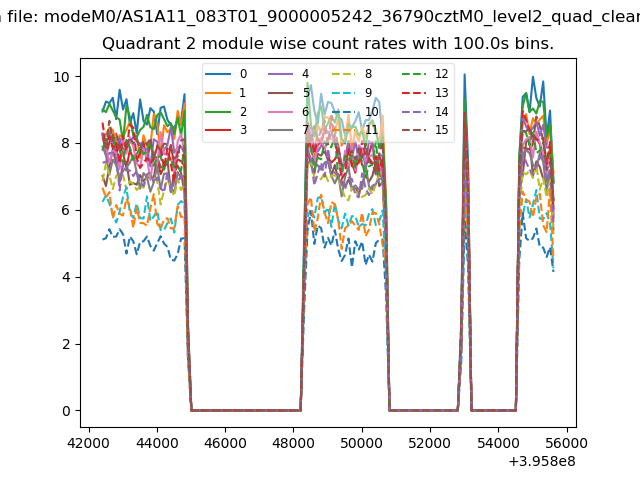
| Module-wise count rates for Quadrant B Data is divided into 100 sec bins |
 |
 |
| Module-wise count rates for Quadrant C Data is divided into 100 sec bins |
 |
 |
| Module-wise count rates for Quadrant D Data is divided into 100 sec bins |
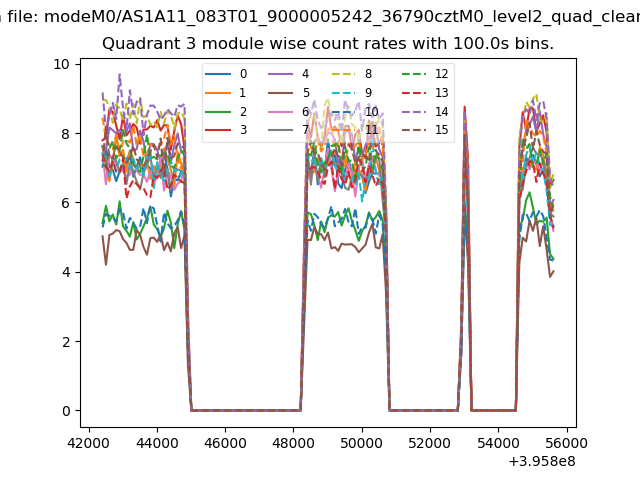 |
 |
| Parameter | Plot |
|---|---|
| CZT HV Monitor | 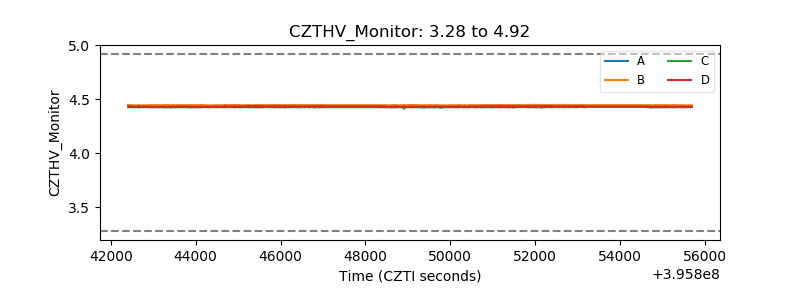 |
| D_VDD | 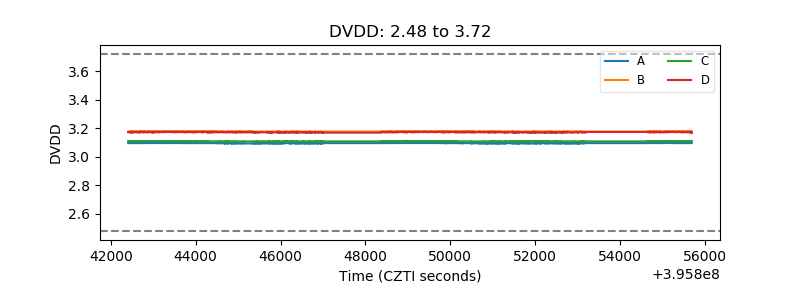 |
| Temperature 1 | 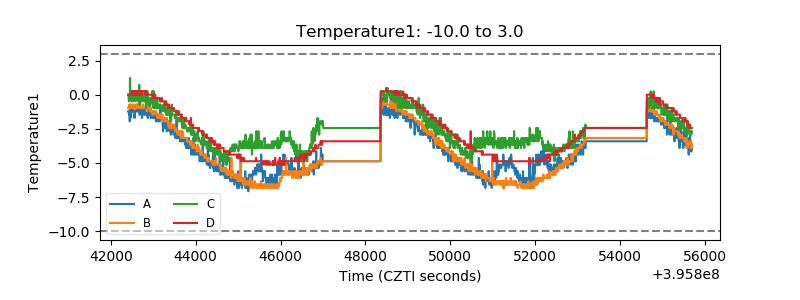 |
| Veto HV Monitor | 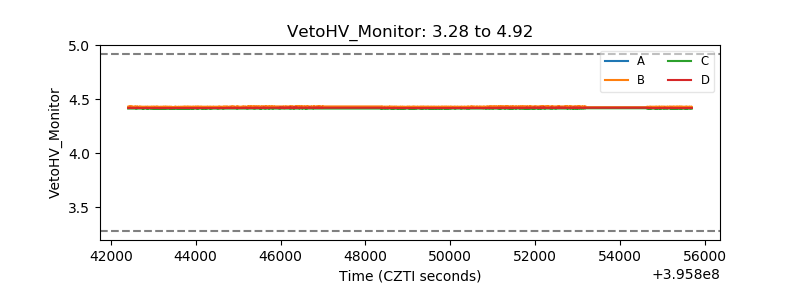 |
| Veto LLD | 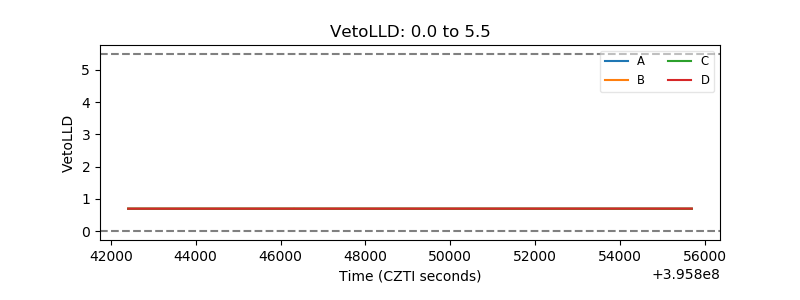 |
| Alpha Counter | 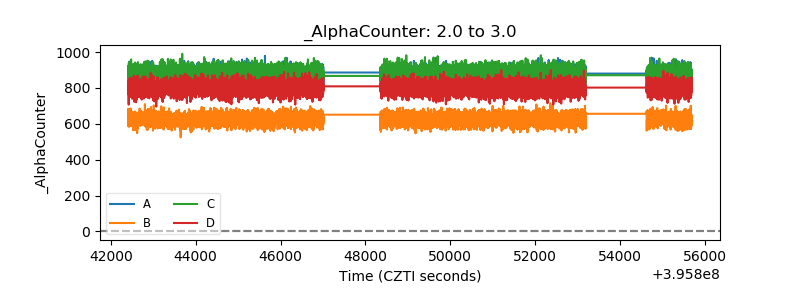 |
| _CPM_Rate | 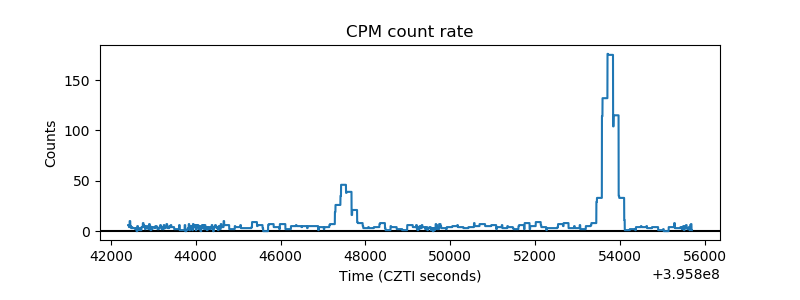 |
| CZT Counter | 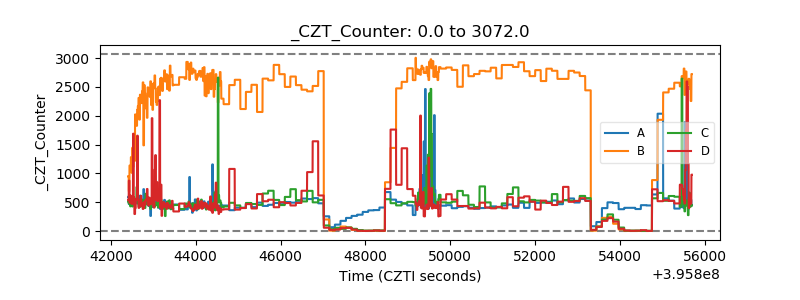 |
| +2.5 Volts monitor |  |
| +5 Volts monitor | 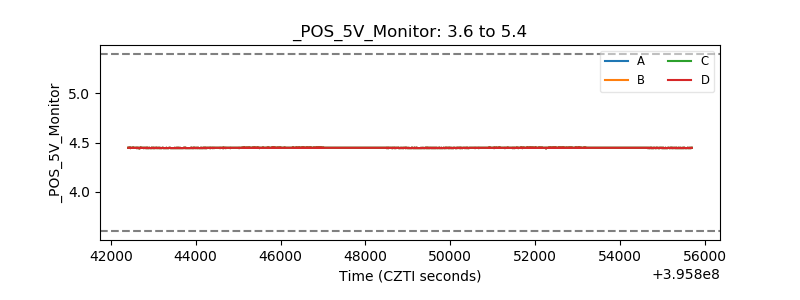 |
| _ROLL_ROT | 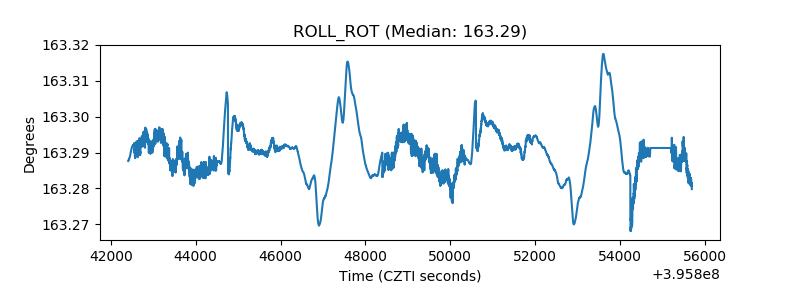 |
| _Roll_DEC |  |
| _Roll_RA | 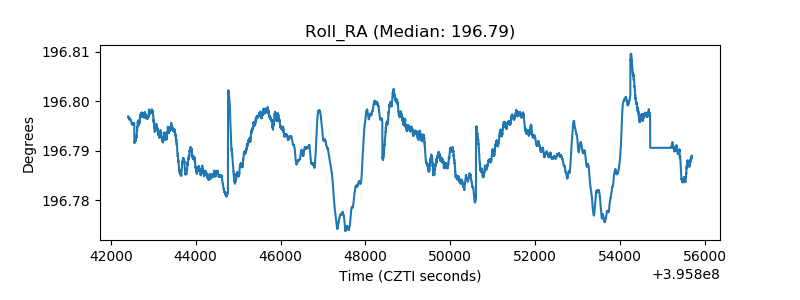 |
| Veto Counter | 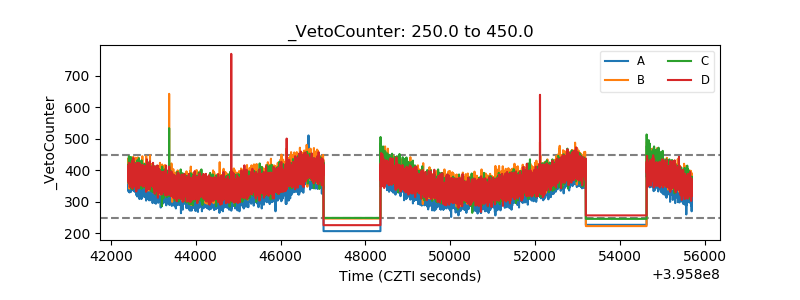 |