| Param | Original file | Final file |
|---|---|---|
| Filename | modeM0/AS1A11_083T01_9000005242_36791cztM0_level2.evt | modeM0/AS1A11_083T01_9000005242_36791cztM0_level2_quad_clean.evt |
| Size (bytes) | 225,077,760 | 26,876,160 |
| Size | 214.7 MB | 25.6 MB |
| Events in quadrant A | 957,613 | 196,907 |
| Events in quadrant B | 3,712,546 | 115,252 |
| Events in quadrant C | 893,913 | 195,096 |
| Events in quadrant D | 1,138,695 | 184,574 |
| Mode SS | |||
|---|---|---|---|
| Quadrant | BADHDUFLAG | Total packets | Discarded packets |
| A | 0 | 32 | 0 |
| B | 0 | 32 | 0 |
| C | 0 | 32 | 0 |
| D | 0 | 32 | 0 |
| Mode M9 | |||
|---|---|---|---|
| Quadrant | BADHDUFLAG | Total packets | Discarded packets |
| A | 0 | 3 | 0 |
| B | 0 | 3 | 0 |
| C | 0 | 3 | 0 |
| D | 0 | 4 | 0 |
| Mode M0 | |||
|---|---|---|---|
| Quadrant | BADHDUFLAG | Total packets | Discarded packets |
| A | 0 | 3977 | 1 |
| B | 0 | 12149 | 1 |
| C | 0 | 3671 | 1 |
| D | 0 | 4466 | 1 |
| Quadrant | Total seconds | Saturated seconds | Saturation percentage |
|---|---|---|---|
| A | 1646 | 35 | 2.126367% |
| B | 1646 | 1353 | 82.199271% |
| C | 1646 | 21 | 1.275820% |
| D | 1646 | 77 | 4.678007% |
Noise dominated data is calculated using 1-second bins in cleaned event files. If a bin has >2000 counts, and if more than 50% of those come from <1% of pixels, then it is considered to be noise-dominated and hence unusable.
| Quadrant | # 1 sec bins | Bins with >0 counts | Bins with >2000 counts | High rate bins dominated by noise | Noise dominated (total time) | Noise dominated (detector-on time) | Marked lightcurve |
|---|---|---|---|---|---|---|---|
| A | 1646 | 1646 | 26 | 26 | 1.58% | 1.58% | 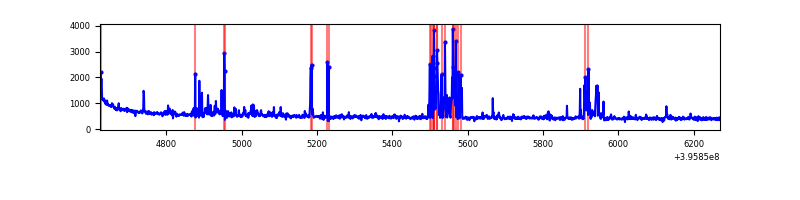 |
| B | 1645 | 1645 | 1305 | 1305 | 79.33% | 79.33% | 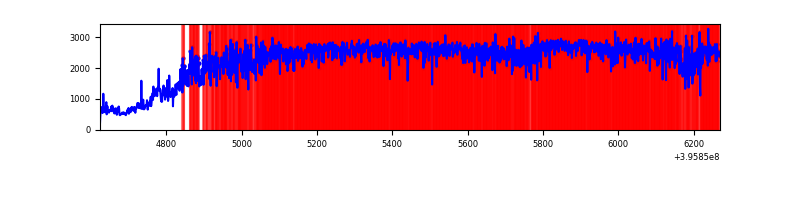 |
| C | 1646 | 1646 | 19 | 19 | 1.15% | 1.15% | 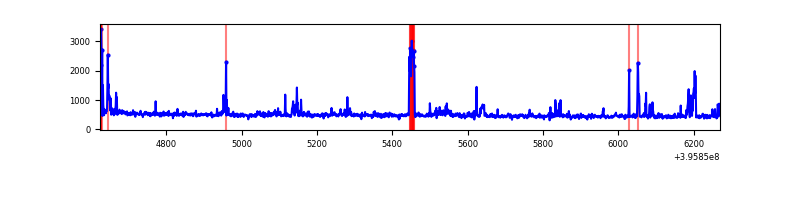 |
| D | 1646 | 1646 | 71 | 71 | 4.31% | 4.31% | 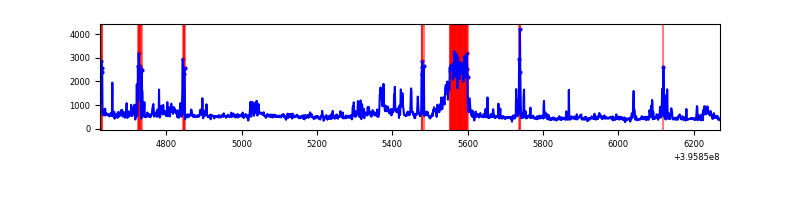 |
Top three noisy pixels from each quadrant. If the there are fewer than three noisy pixels in the level2.evt file, extra rows are filled as -1
| Pixel properties | Quadrant properties | ||||||
|---|---|---|---|---|---|---|---|
| Quadrant | DetID | PixID | Counts | Sigma | Mean | Median | Sigma |
| A | 13 | 248 | 103607 | 2741.53 | 178 | 174 | 37.7 |
| A | 10 | 83 | 103454 | 2737.48 | 178 | 174 | 37.7 |
| A | 7 | 16 | 38443 | 1014.33 | 178 | 174 | 37.7 |
| B | 12 | 1 | 3038525 | 124637.05 | 117 | 115 | 24.4 |
| B | 4 | 171 | 70443 | 2884.89 | 117 | 115 | 24.4 |
| B | 0 | 197 | 45778 | 1873.12 | 117 | 115 | 24.4 |
| C | 15 | 214 | 77350 | 1814.64 | 175 | 176 | 42.5 |
| C | 0 | 207 | 69820 | 1637.58 | 175 | 176 | 42.5 |
| C | 14 | 254 | 34939 | 817.4 | 175 | 176 | 42.5 |
| D | 13 | 249 | 147070 | 3341.26 | 173 | 168 | 44.0 |
| D | 5 | 222 | 124509 | 2828.11 | 173 | 168 | 44.0 |
| D | 10 | 203 | 43596 | 987.76 | 173 | 168 | 44.0 |
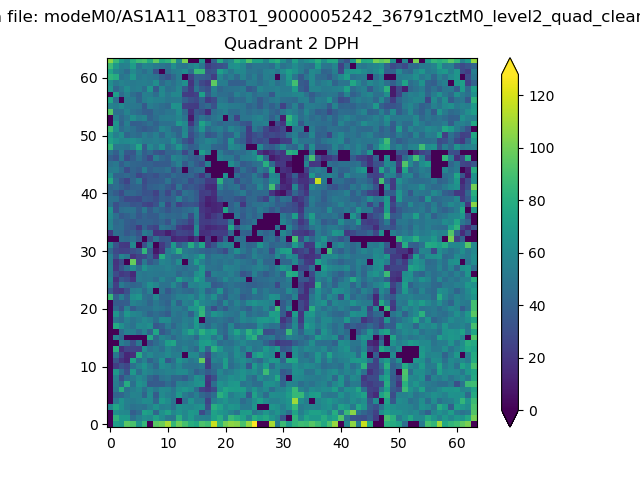
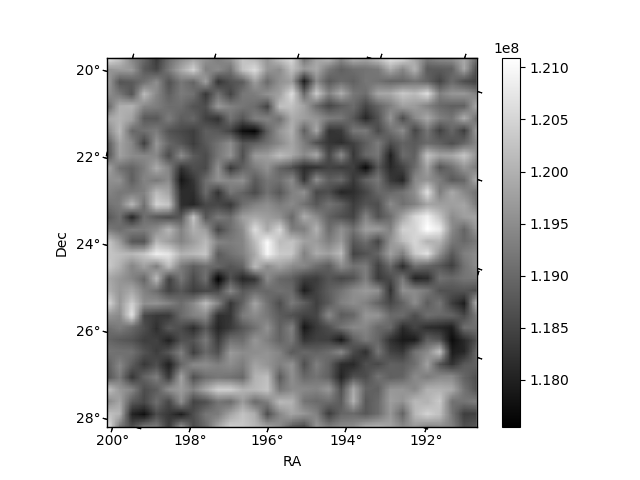
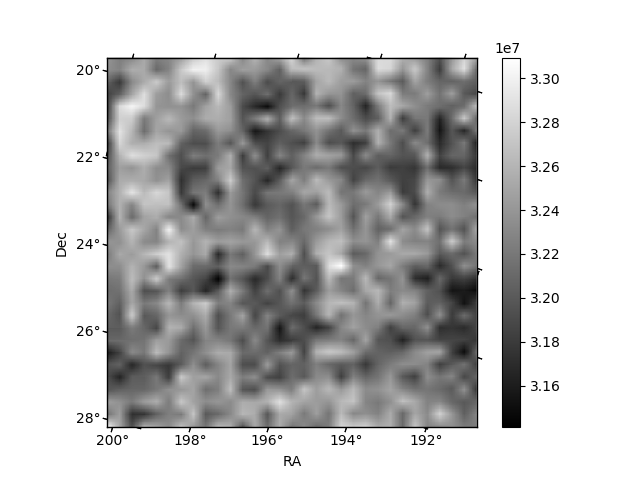
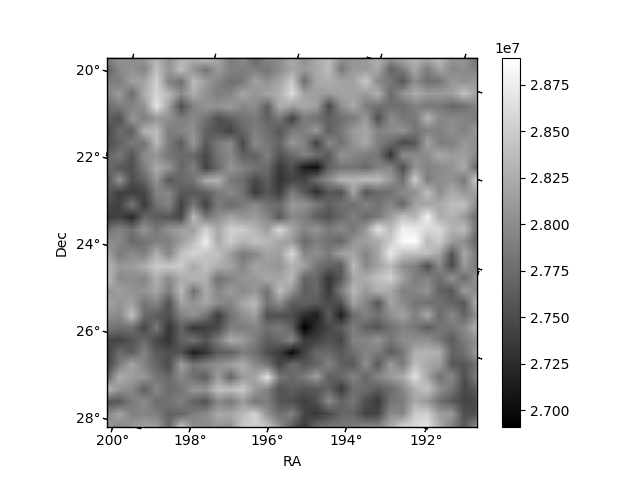
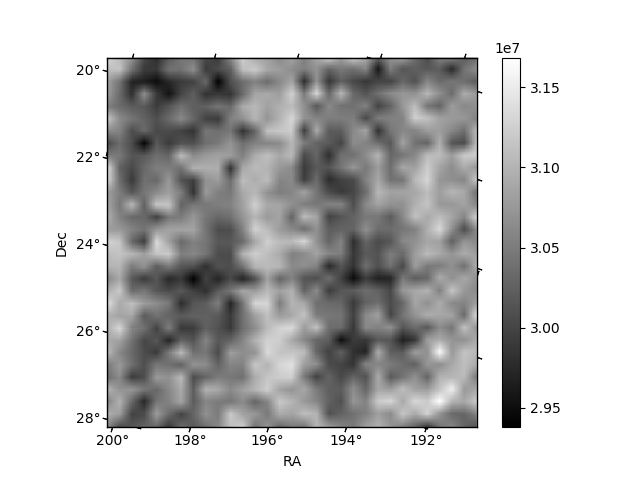
Histogram calculated using DETX and DETY for each event in the final _common_clean file
| Quadrant A | 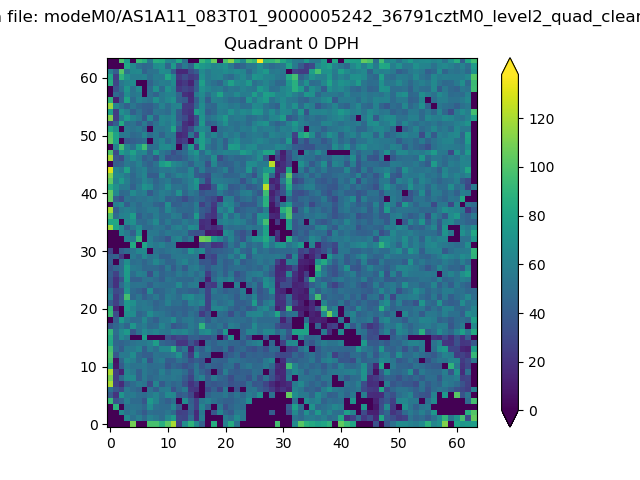 |
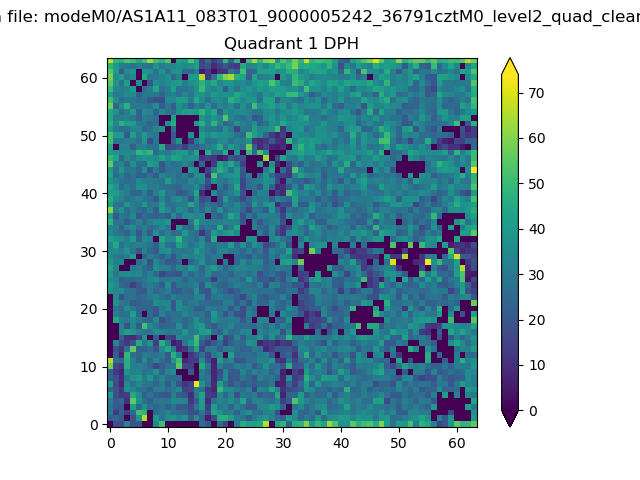 |
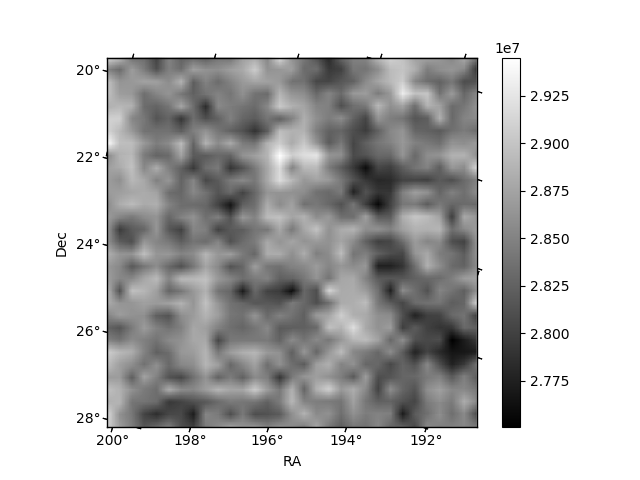
Quadrant B |
|---|---|---|---|
| Quadrant D | 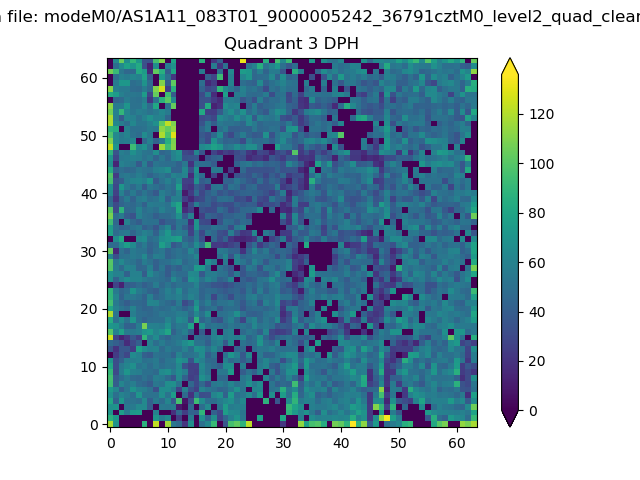 |
 |
Quadrant C |
| Plot type | Count rate plots | Images |
|---|---|---|
| Comparison with Poisson distribution Blue bars denote a histogram of data divided into 1 sec bins. Red curve is a Poisson curve with rate = median count rate of data. |
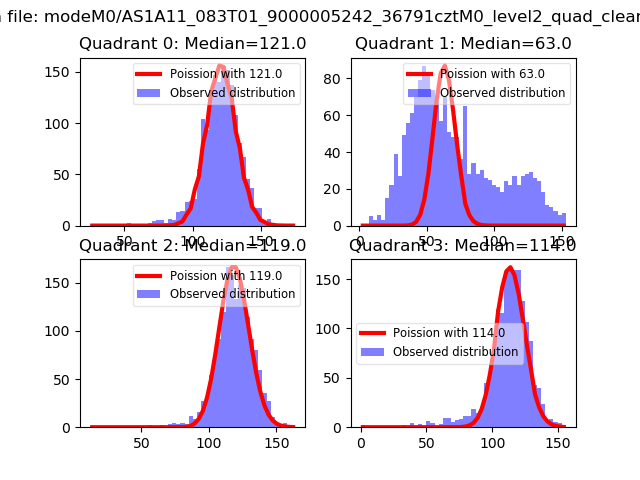 |
 |
| Quadrant-wise count rates Data is divided into 100 sec bins |
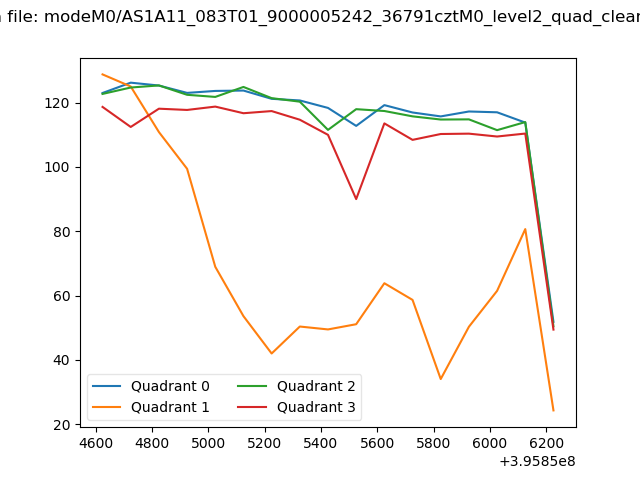 |
|
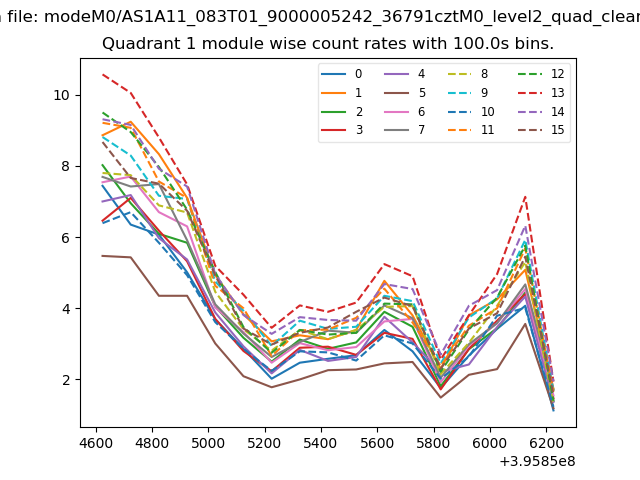
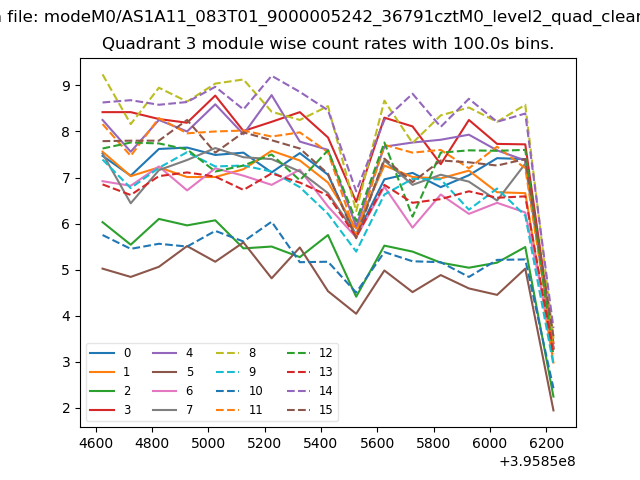
| Module-wise count rates for Quadrant A Data is divided into 100 sec bins |
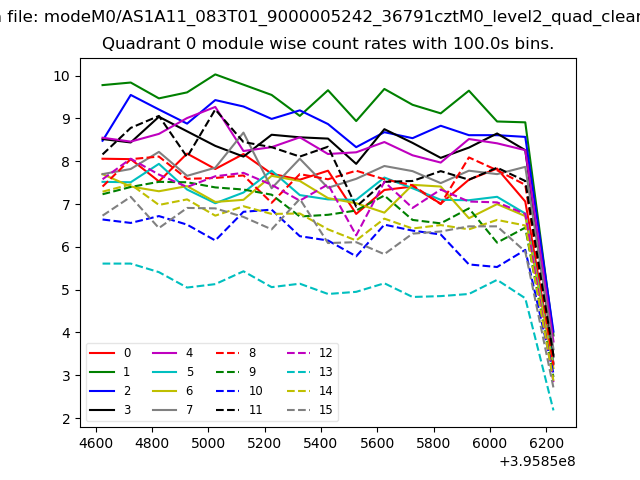 |
 |
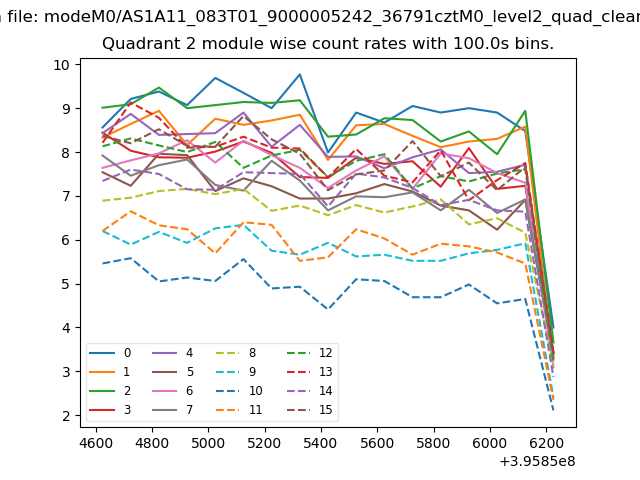
| Module-wise count rates for Quadrant B Data is divided into 100 sec bins |
 |
 |
| Module-wise count rates for Quadrant C Data is divided into 100 sec bins |
 |
 |
| Module-wise count rates for Quadrant D Data is divided into 100 sec bins |
 |
 |
| Parameter | Plot |
|---|---|
| CZT HV Monitor | 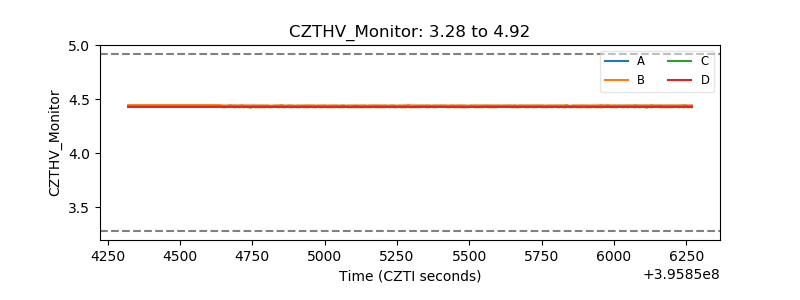 |
| D_VDD | 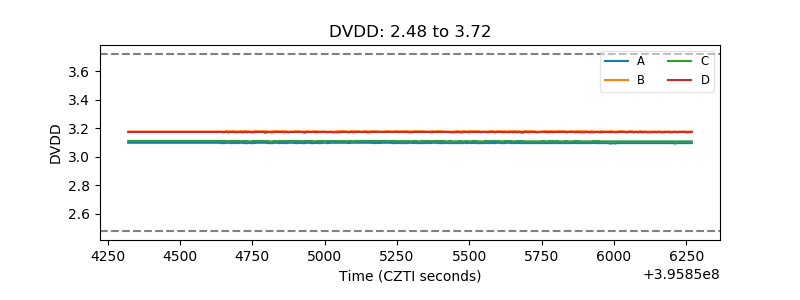 |
| Temperature 1 |  |
| Veto HV Monitor | 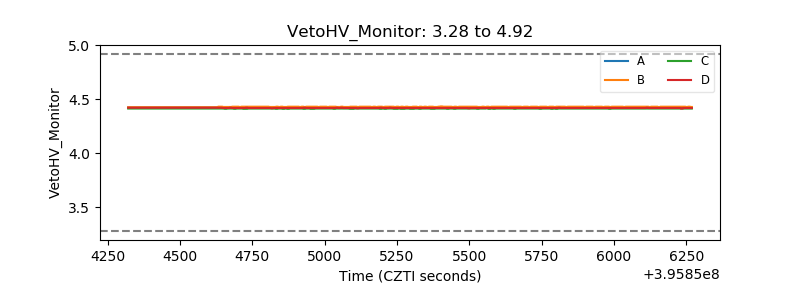 |
| Veto LLD | 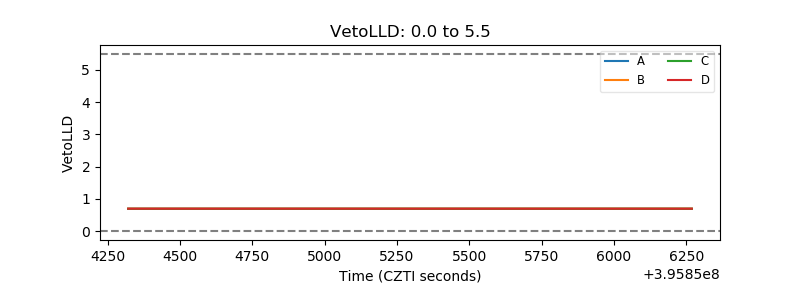 |
| Alpha Counter | 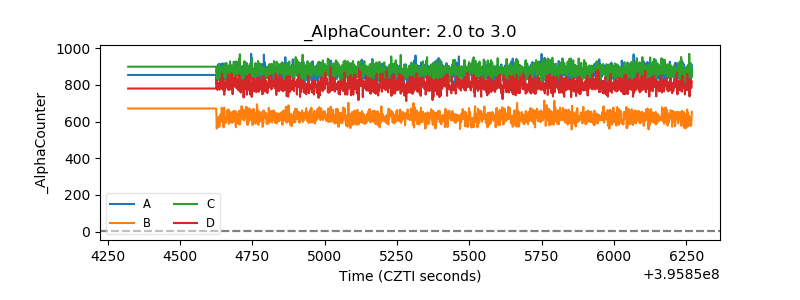 |
| _CPM_Rate | 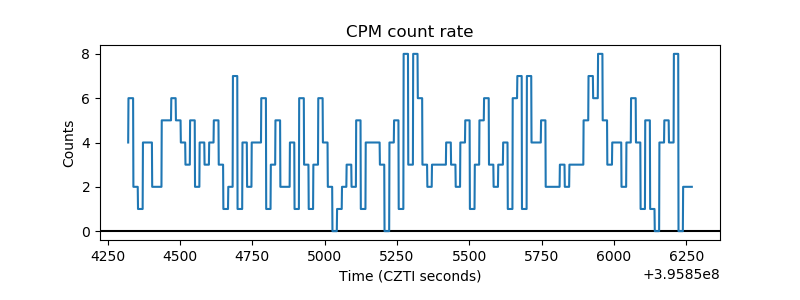 |
| CZT Counter | 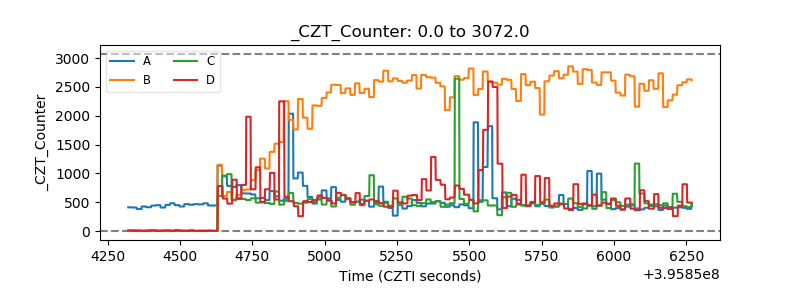 |
| +2.5 Volts monitor |  |
| +5 Volts monitor |  |
| _ROLL_ROT | 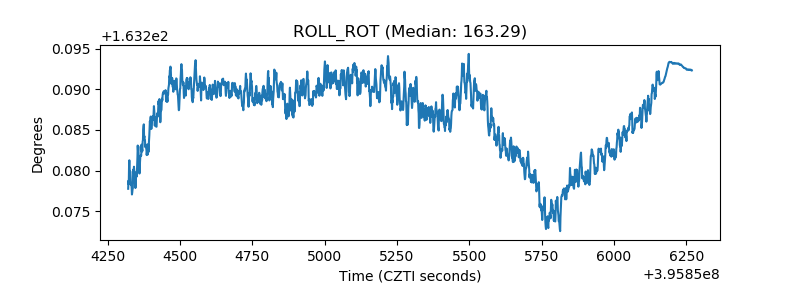 |
| _Roll_DEC | 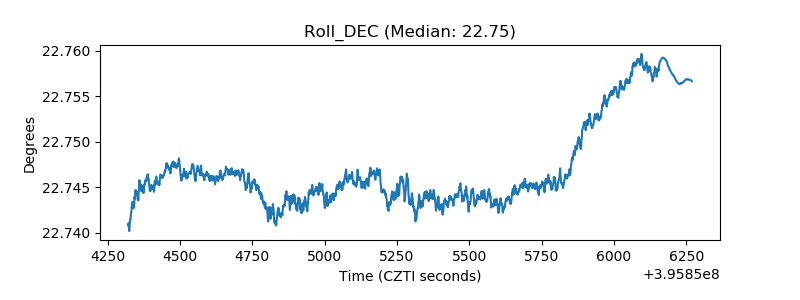 |
| _Roll_RA | 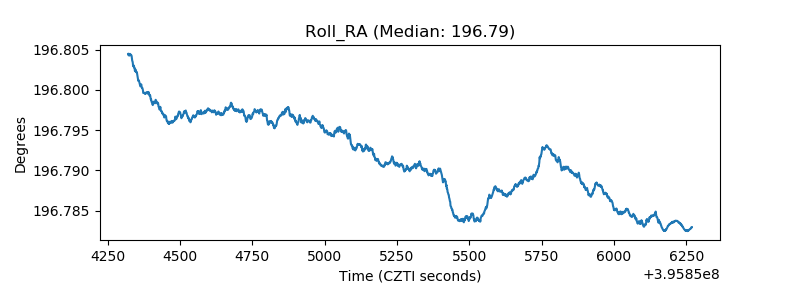 |
| Veto Counter | 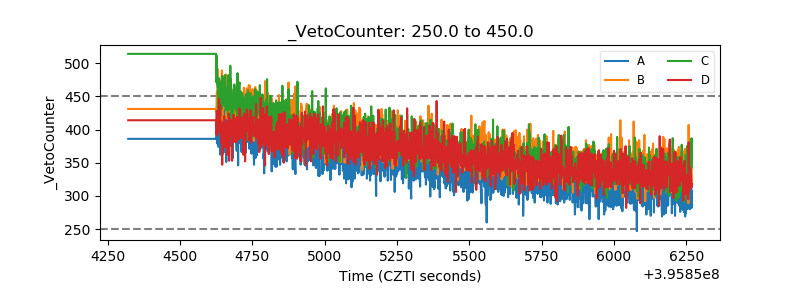 |