| Param | Original file | Final file |
|---|---|---|
| Filename | modeM0/AS1A11_075T01_9000005244_36791cztM0_level2.evt | modeM0/AS1A11_075T01_9000005244_36791cztM0_level2_quad_clean.evt |
| Size (bytes) | 411,373,440 | 31,337,280 |
| Size | 392.3 MB | 29.9 MB |
| Events in quadrant A | 1,483,710 | 236,987 |
| Events in quadrant B | 7,405,421 | 34,470 |
| Events in quadrant C | 1,602,389 | 238,126 |
| Events in quadrant D | 1,767,062 | 228,933 |
| Mode SS | |||
|---|---|---|---|
| Quadrant | BADHDUFLAG | Total packets | Discarded packets |
| A | 0 | 62 | 0 |
| B | 0 | 62 | 0 |
| C | 0 | 62 | 0 |
| D | 0 | 62 | 0 |
| Mode M0 | |||
|---|---|---|---|
| Quadrant | BADHDUFLAG | Total packets | Discarded packets |
| A | 0 | 6295 | 2 |
| B | 0 | 23980 | 1 |
| C | 0 | 6517 | 1 |
| D | 0 | 7334 | 1 |
| Mode M9 | |||
|---|---|---|---|
| Quadrant | BADHDUFLAG | Total packets | Discarded packets |
| A | 0 | 15 | 0 |
| B | 0 | 15 | 0 |
| C | 0 | 15 | 0 |
| D | 0 | 15 | 0 |
| Quadrant | Total seconds | Saturated seconds | Saturation percentage |
|---|---|---|---|
| A | 2924 | 11 | 0.376197% |
| B | 2924 | 2694 | 92.134063% |
| C | 2924 | 39 | 1.333789% |
| D | 2924 | 98 | 3.351573% |
Noise dominated data is calculated using 1-second bins in cleaned event files. If a bin has >2000 counts, and if more than 50% of those come from <1% of pixels, then it is considered to be noise-dominated and hence unusable.
| Quadrant | # 1 sec bins | Bins with >0 counts | Bins with >2000 counts | High rate bins dominated by noise | Noise dominated (total time) | Noise dominated (detector-on time) | Marked lightcurve |
|---|---|---|---|---|---|---|---|
| A | 4476 | 2925 | 5 | 5 | 0.11% | 0.17% | 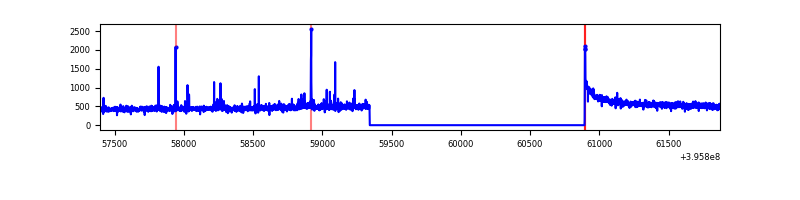 |
| B | 4475 | 2923 | 2629 | 2629 | 58.75% | 89.94% | 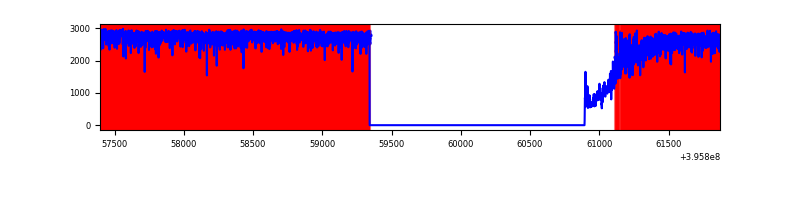 |
| C | 4476 | 2925 | 35 | 35 | 0.78% | 1.20% | 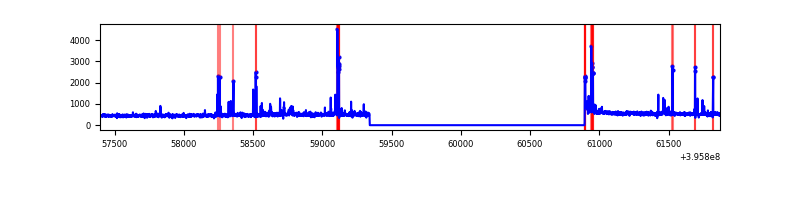 |
| D | 4476 | 2925 | 75 | 75 | 1.68% | 2.56% | 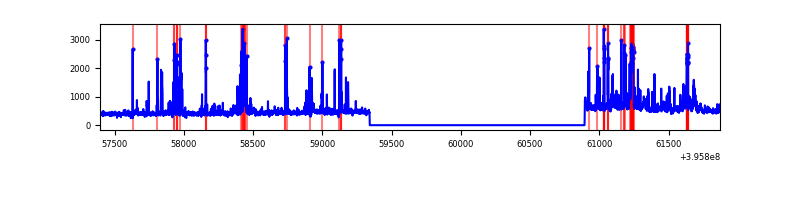 |
Top three noisy pixels from each quadrant. If the there are fewer than three noisy pixels in the level2.evt file, extra rows are filled as -1
| Pixel properties | Quadrant properties | ||||||
|---|---|---|---|---|---|---|---|
| Quadrant | DetID | PixID | Counts | Sigma | Mean | Median | Sigma |
| A | 10 | 83 | 121269 | 1723.86 | 341 | 334 | 70.2 |
| A | 9 | 143 | 34713 | 490.05 | 341 | 334 | 70.2 |
| A | 13 | 6 | 4883 | 64.84 | 341 | 334 | 70.2 |
| B | 12 | 1 | 6758060 | 262299.88 | 125 | 122 | 25.8 |
| B | 4 | 232 | 72163 | 2796.17 | 125 | 122 | 25.8 |
| B | 0 | 190 | 32610 | 1260.98 | 125 | 122 | 25.8 |
| C | 15 | 214 | 133117 | 1708.59 | 329 | 331 | 77.7 |
| C | 0 | 207 | 81032 | 1038.4 | 329 | 331 | 77.7 |
| C | 14 | 254 | 47799 | 610.78 | 329 | 331 | 77.7 |
| D | 13 | 249 | 210017 | 2589.72 | 326 | 316 | 81.0 |
| D | 5 | 222 | 111075 | 1367.83 | 326 | 316 | 81.0 |
| D | 2 | 250 | 61054 | 750.09 | 326 | 316 | 81.0 |
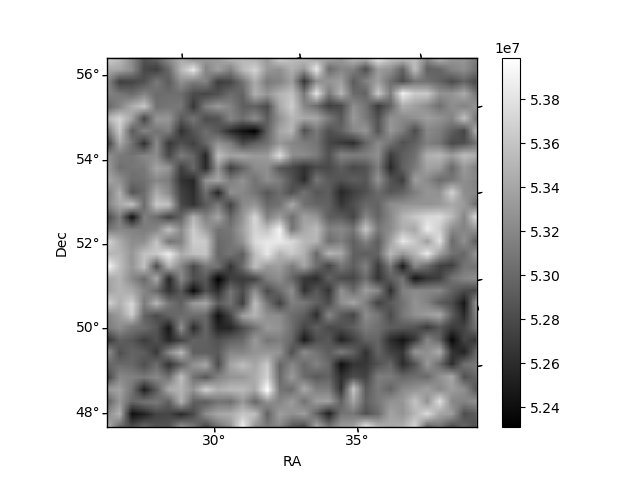
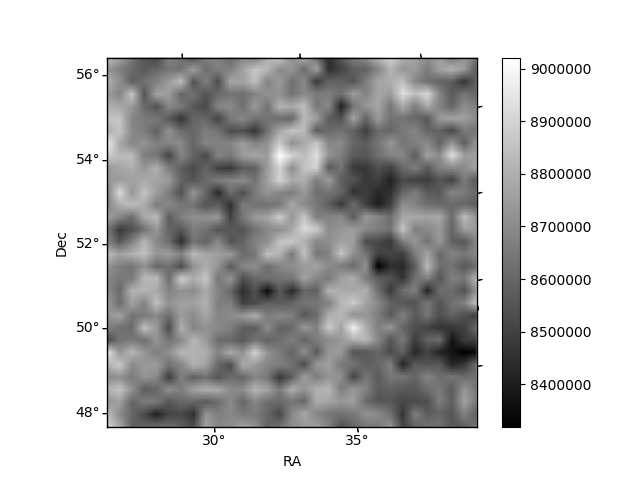
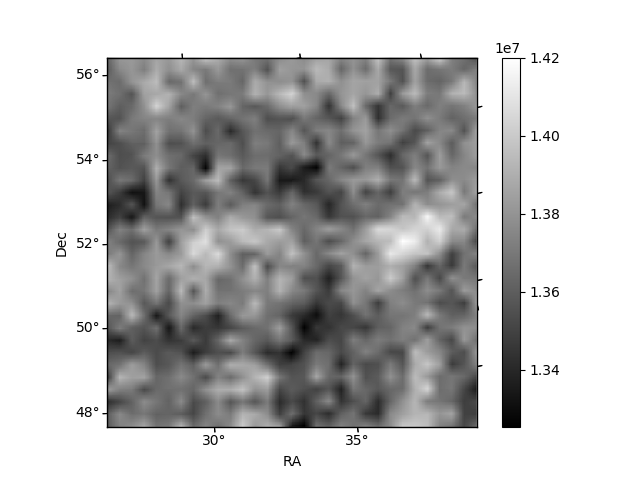
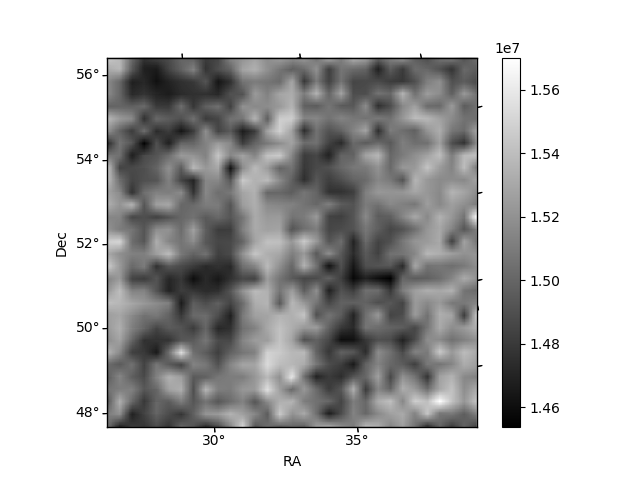
Histogram calculated using DETX and DETY for each event in the final _common_clean file
| Quadrant A | 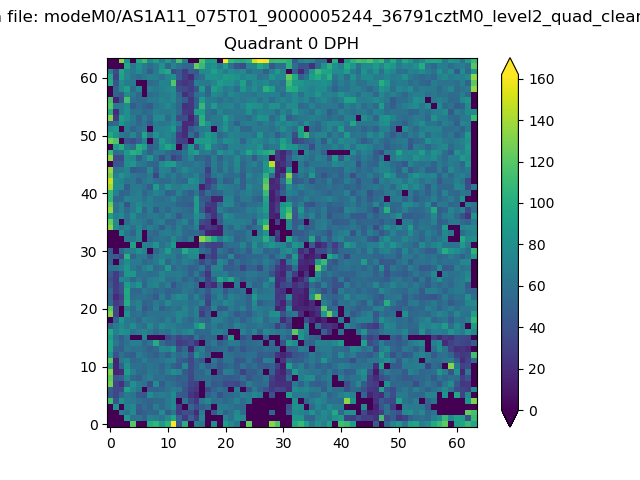 |
 |
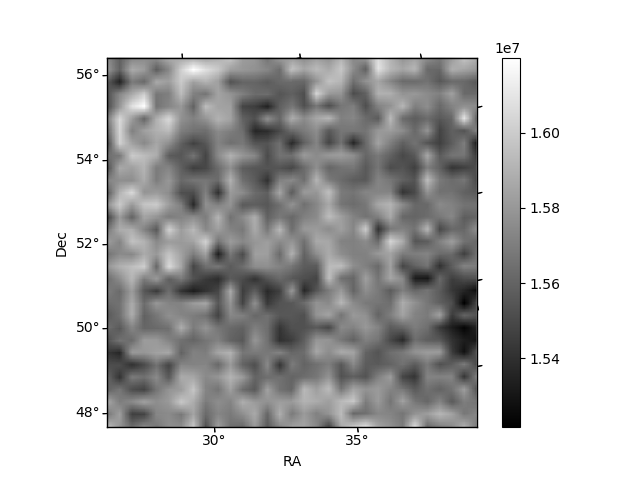
Quadrant B |
|---|---|---|---|
| Quadrant D | 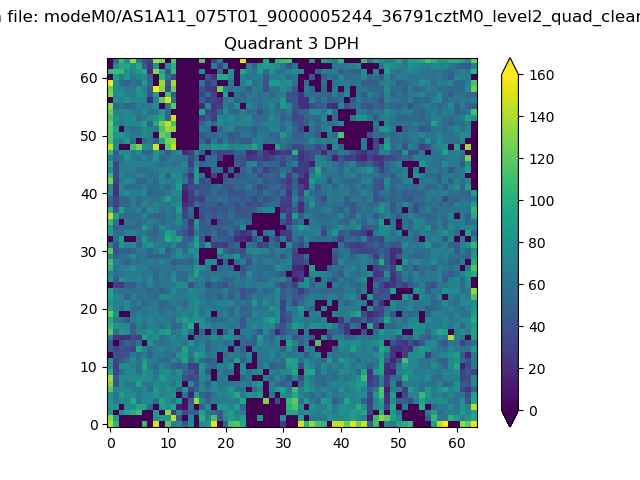 |
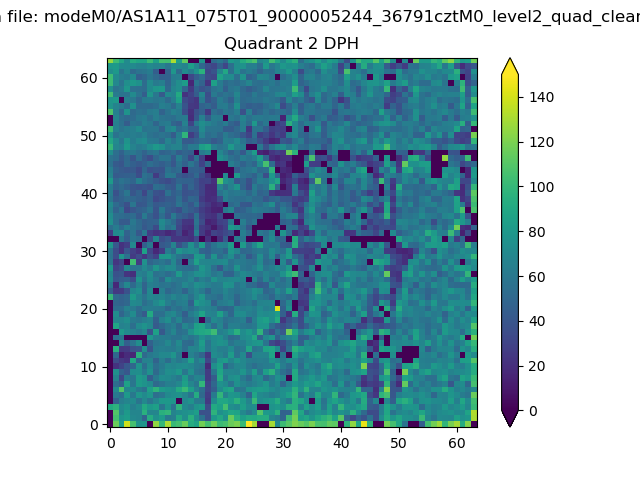 |
Quadrant C |
| Plot type | Count rate plots | Images |
|---|---|---|
| Comparison with Poisson distribution Blue bars denote a histogram of data divided into 1 sec bins. Red curve is a Poisson curve with rate = median count rate of data. |
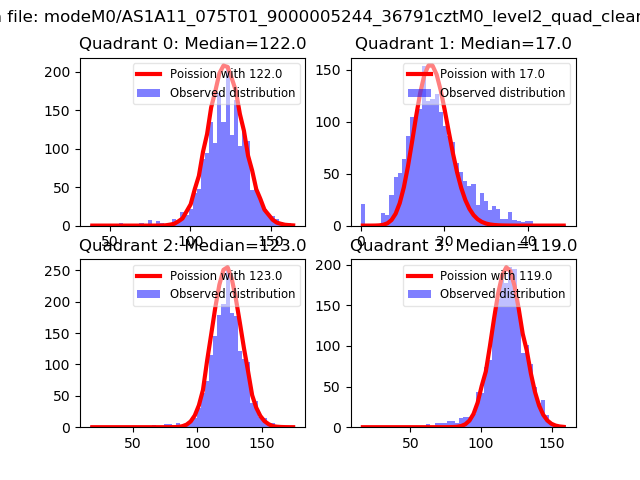 |
 |
| Quadrant-wise count rates Data is divided into 100 sec bins |
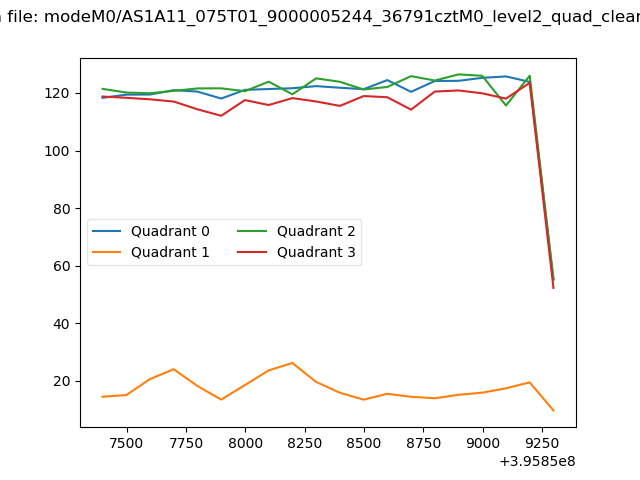 |
|
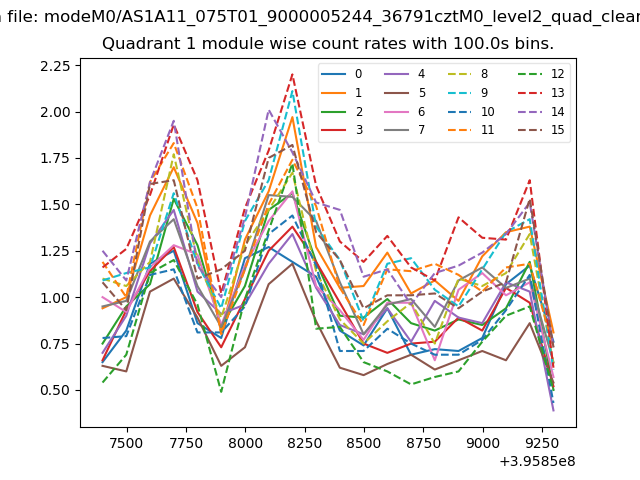
| Module-wise count rates for Quadrant A Data is divided into 100 sec bins |
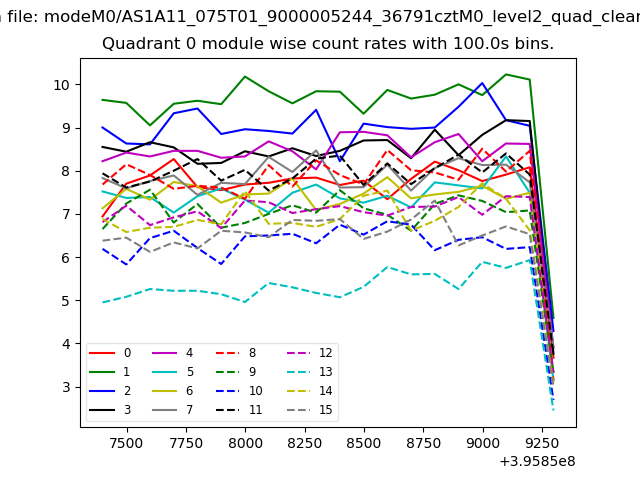 |
 |
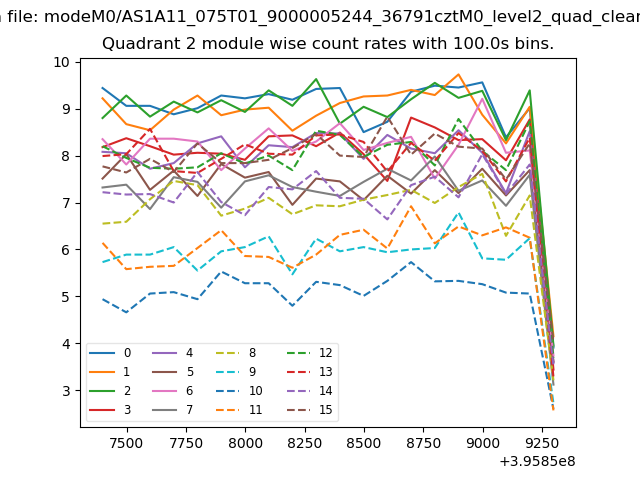
| Module-wise count rates for Quadrant B Data is divided into 100 sec bins |
 |
 |
| Module-wise count rates for Quadrant C Data is divided into 100 sec bins |
 |
 |
| Module-wise count rates for Quadrant D Data is divided into 100 sec bins |
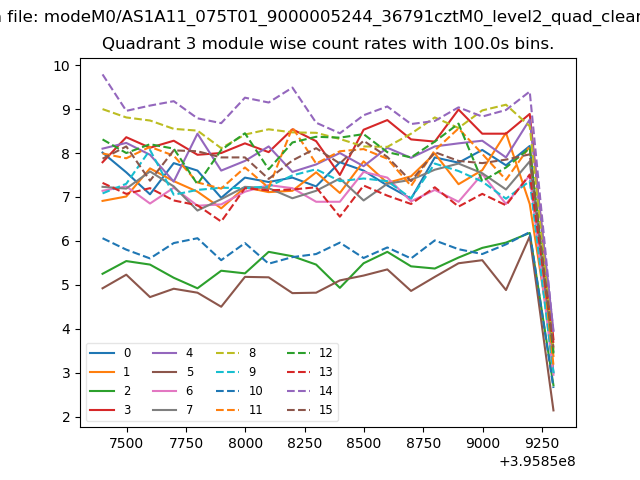 |
 |
| Parameter | Plot |
|---|---|
| CZT HV Monitor | 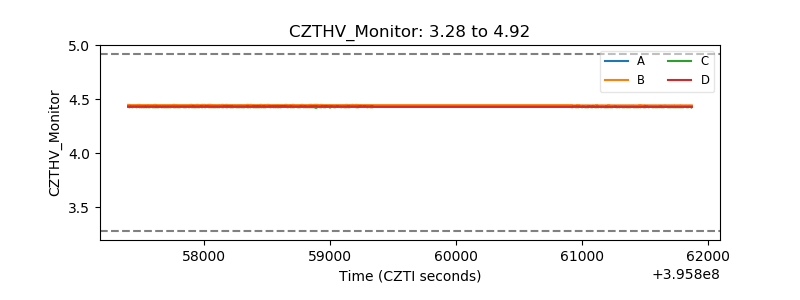 |
| D_VDD | 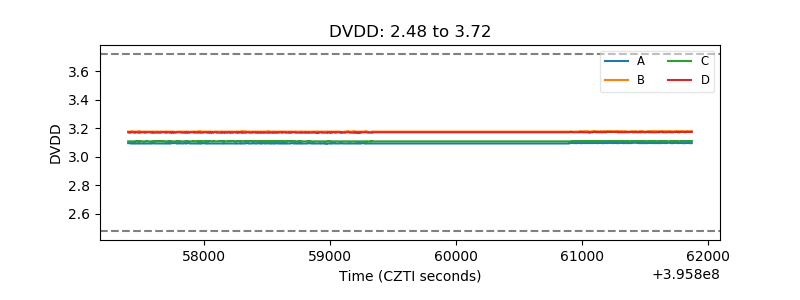 |
| Temperature 1 |  |
| Veto HV Monitor | 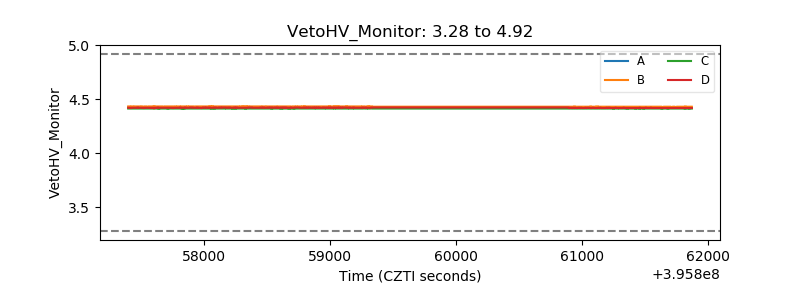 |
| Veto LLD |  |
| Alpha Counter | 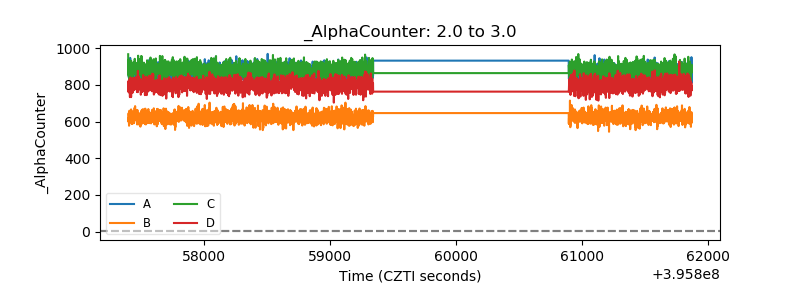 |
| _CPM_Rate | 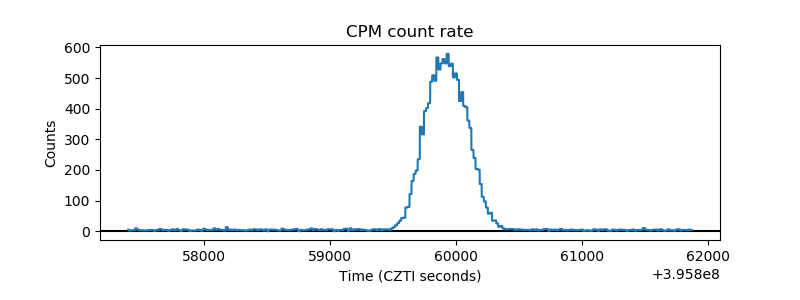 |
| CZT Counter | 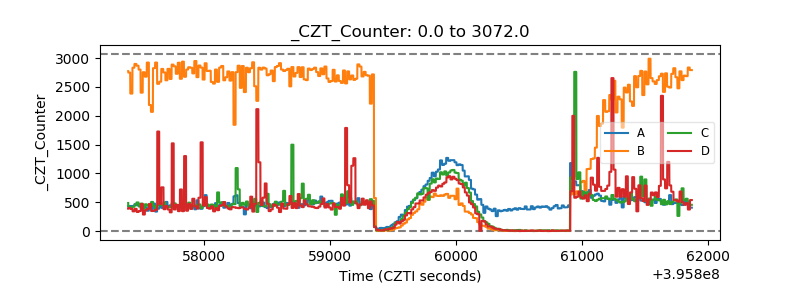 |
| +2.5 Volts monitor | 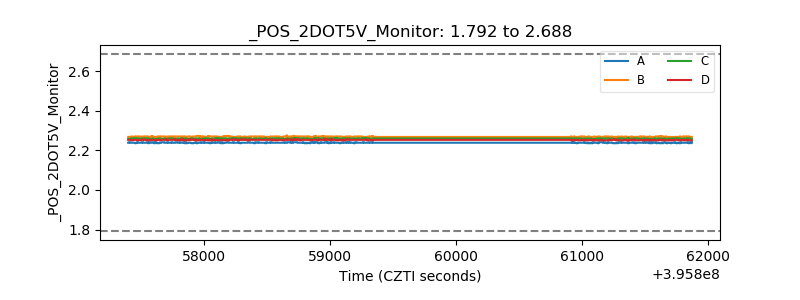 |
| +5 Volts monitor | 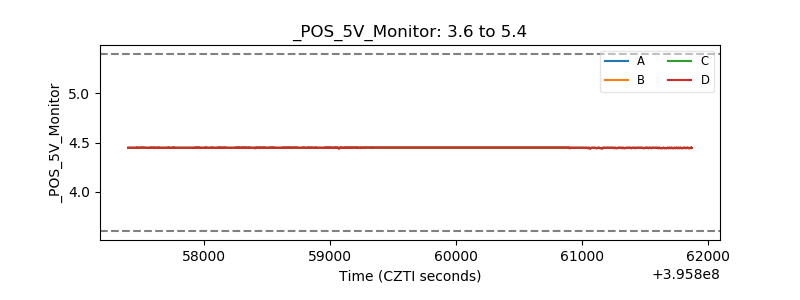 |
| _ROLL_ROT | 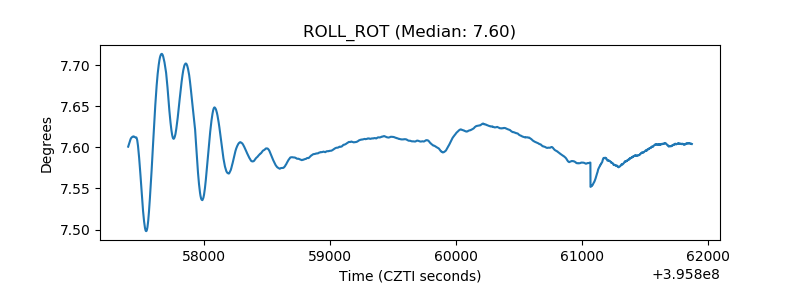 |
| _Roll_DEC | 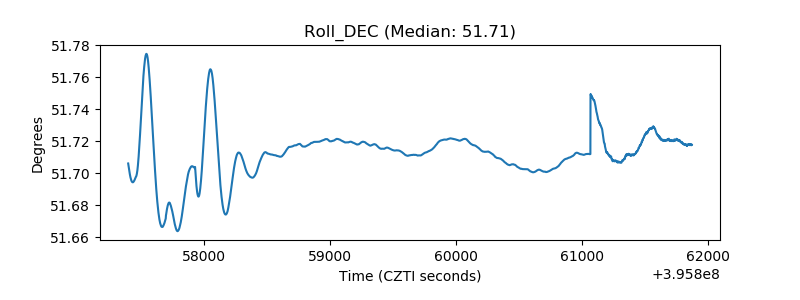 |
| _Roll_RA | 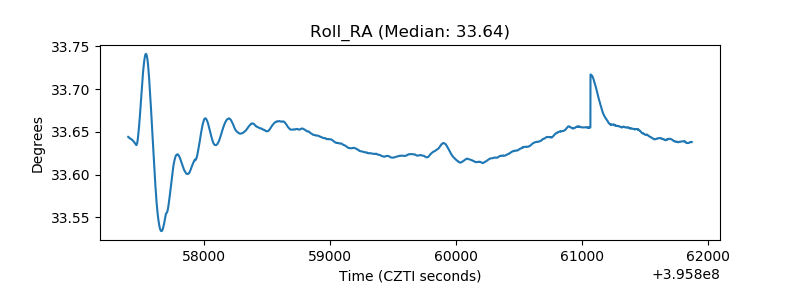 |
| Veto Counter | 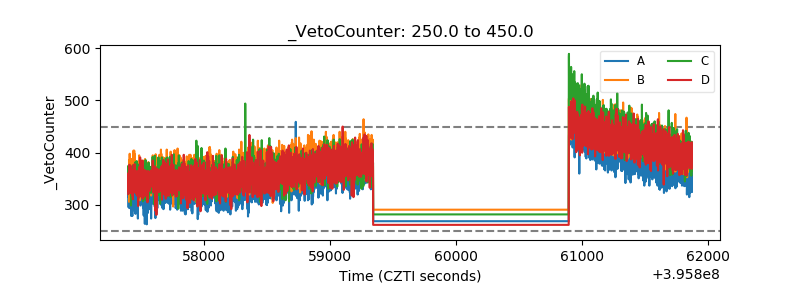 |