| Param | Original file | Final file |
|---|---|---|
| Filename | modeM0/AS1A11_075T01_9000005244_36792cztM0_level2.evt | modeM0/AS1A11_075T01_9000005244_36792cztM0_level2_quad_clean.evt |
| Size (bytes) | 734,221,440 | 64,667,520 |
| Size | 700.2 MB | 61.7 MB |
| Events in quadrant A | 3,286,629 | 451,727 |
| Events in quadrant B | 11,941,986 | 237,716 |
| Events in quadrant C | 3,251,836 | 454,117 |
| Events in quadrant D | 3,387,826 | 432,550 |
| Mode SS | |||
|---|---|---|---|
| Quadrant | BADHDUFLAG | Total packets | Discarded packets |
| A | 0 | 112 | 0 |
| B | 0 | 112 | 0 |
| C | 0 | 112 | 0 |
| D | 0 | 112 | 0 |
| Mode M0 | |||
|---|---|---|---|
| Quadrant | BADHDUFLAG | Total packets | Discarded packets |
| A | 0 | 13392 | 3 |
| B | 0 | 39229 | 2 |
| C | 0 | 13007 | 2 |
| D | 0 | 13813 | 2 |
| Mode M9 | |||
|---|---|---|---|
| Quadrant | BADHDUFLAG | Total packets | Discarded packets |
| A | 0 | 17 | 0 |
| B | 0 | 17 | 0 |
| C | 0 | 17 | 0 |
| D | 0 | 17 | 0 |
| Quadrant | Total seconds | Saturated seconds | Saturation percentage |
|---|---|---|---|
| A | 5429 | 197 | 3.628661% |
| B | 5429 | 4300 | 79.204273% |
| C | 5429 | 163 | 3.002395% |
| D | 5430 | 126 | 2.320442% |
Noise dominated data is calculated using 1-second bins in cleaned event files. If a bin has >2000 counts, and if more than 50% of those come from <1% of pixels, then it is considered to be noise-dominated and hence unusable.
| Quadrant | # 1 sec bins | Bins with >0 counts | Bins with >2000 counts | High rate bins dominated by noise | Noise dominated (total time) | Noise dominated (detector-on time) | Marked lightcurve |
|---|---|---|---|---|---|---|---|
| A | 7132 | 5430 | 136 | 136 | 1.91% | 2.50% | 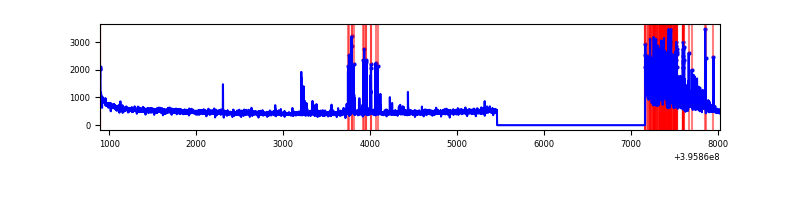 |
| B | 7132 | 5429 | 4004 | 4004 | 56.14% | 73.75% | 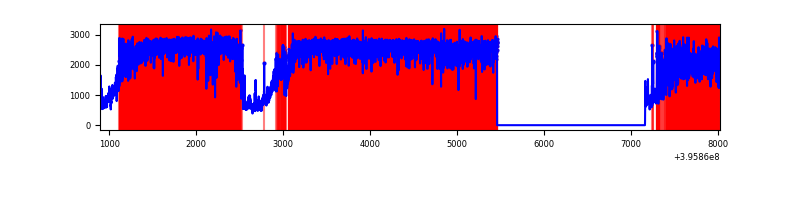 |
| C | 7132 | 5430 | 138 | 138 | 1.93% | 2.54% | 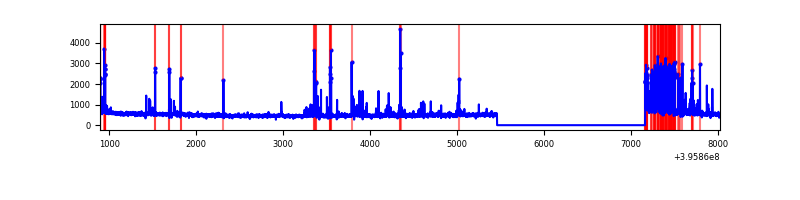 |
| D | 7133 | 5431 | 113 | 113 | 1.58% | 2.08% | 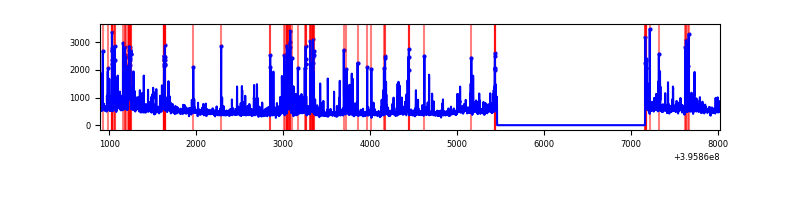 |
Top three noisy pixels from each quadrant. If the there are fewer than three noisy pixels in the level2.evt file, extra rows are filled as -1
| Pixel properties | Quadrant properties | ||||||
|---|---|---|---|---|---|---|---|
| Quadrant | DetID | PixID | Counts | Sigma | Mean | Median | Sigma |
| A | 7 | 16 | 458971 | 3626.57 | 619 | 608 | 126.4 |
| A | 10 | 83 | 238253 | 1880.25 | 619 | 608 | 126.4 |
| A | 9 | 143 | 123405 | 971.57 | 619 | 608 | 126.4 |
| B | 12 | 1 | 9668446 | 128368.36 | 397 | 387 | 75.3 |
| B | 4 | 232 | 190198 | 2520.23 | 397 | 387 | 75.3 |
| B | 5 | 172 | 136725 | 1810.24 | 397 | 387 | 75.3 |
| C | 1 | 23 | 336377 | 2358.17 | 607 | 610 | 142.4 |
| C | 15 | 214 | 244098 | 1710.07 | 607 | 610 | 142.4 |
| C | 0 | 207 | 123493 | 863.04 | 607 | 610 | 142.4 |
| D | 13 | 249 | 288592 | 1936.14 | 608 | 590 | 148.8 |
| D | 5 | 222 | 270521 | 1814.66 | 608 | 590 | 148.8 |
| D | 12 | 227 | 133228 | 891.68 | 608 | 590 | 148.8 |
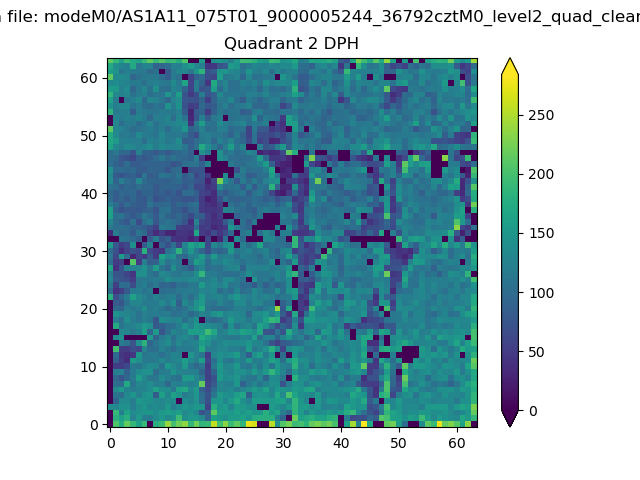
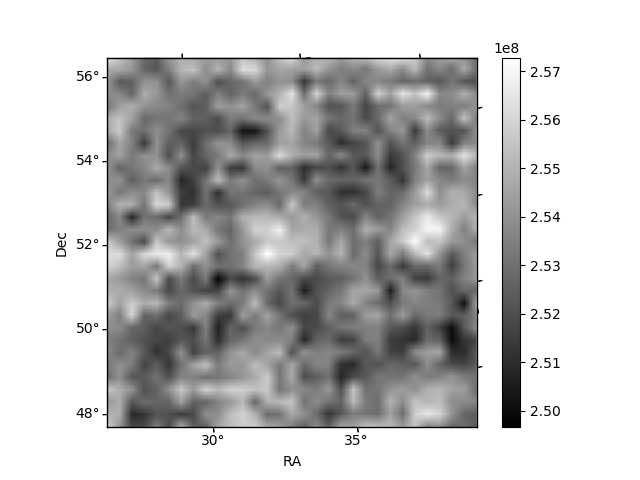
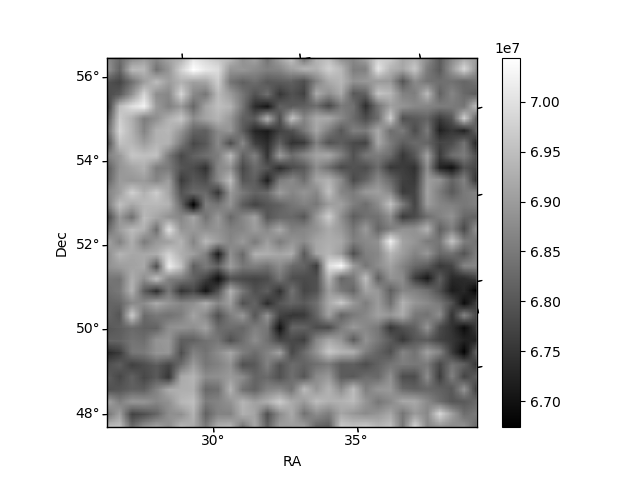
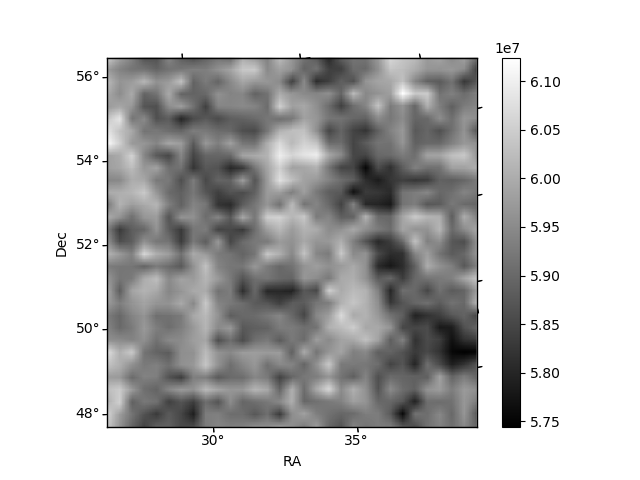
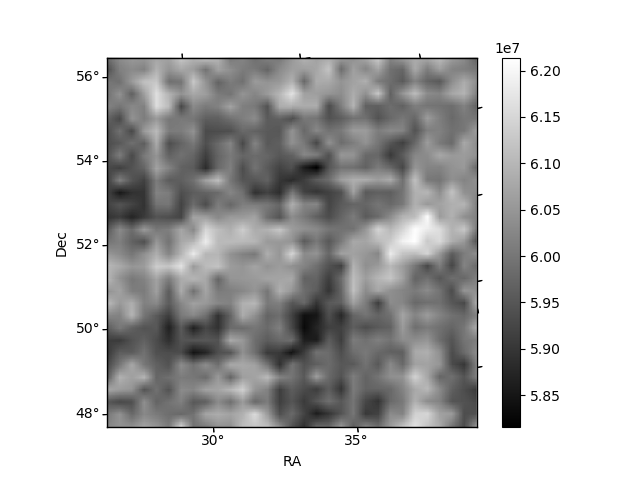
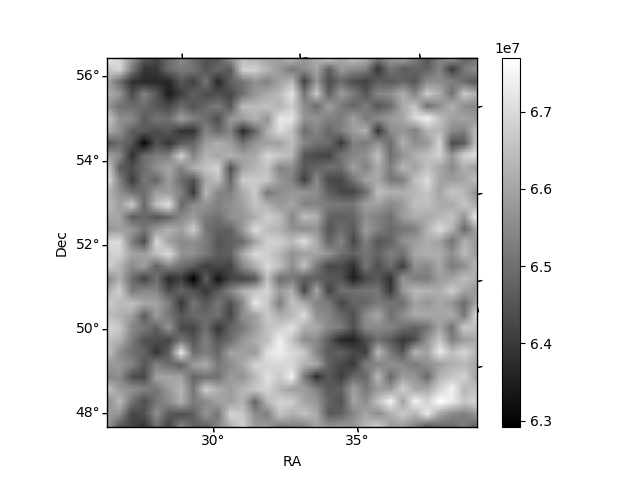
Histogram calculated using DETX and DETY for each event in the final _common_clean file
| Quadrant A | 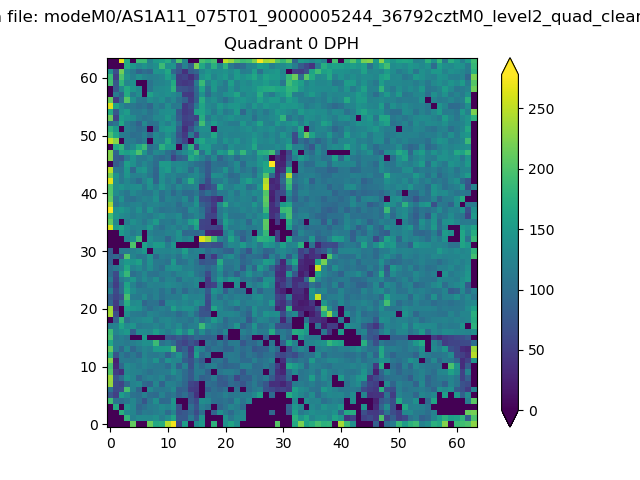 |
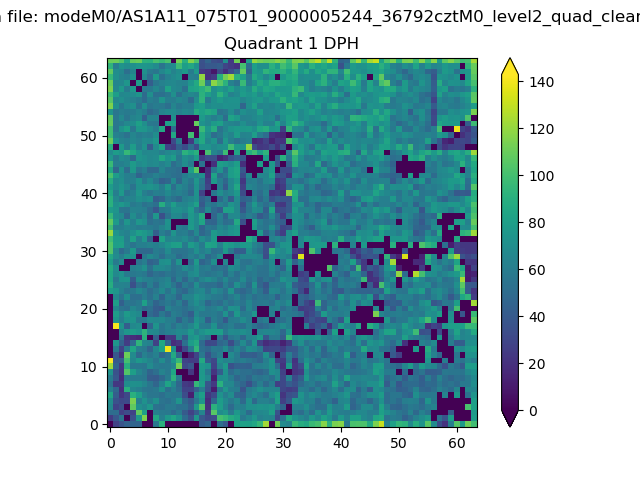 |
Quadrant B |
|---|---|---|---|
| Quadrant D | 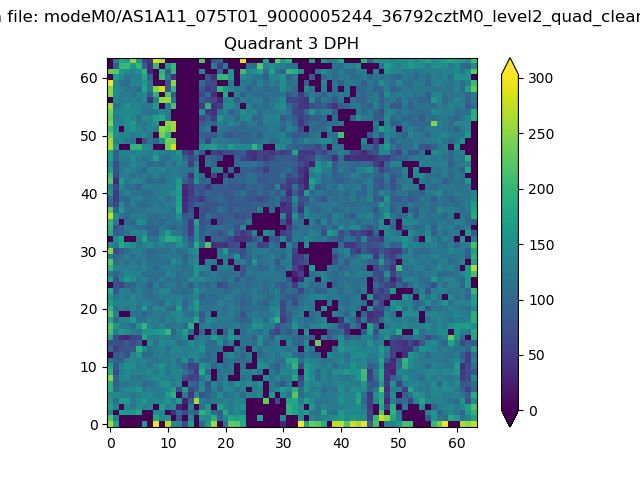 |
 |
Quadrant C |
| Plot type | Count rate plots | Images |
|---|---|---|
| Comparison with Poisson distribution Blue bars denote a histogram of data divided into 1 sec bins. Red curve is a Poisson curve with rate = median count rate of data. |
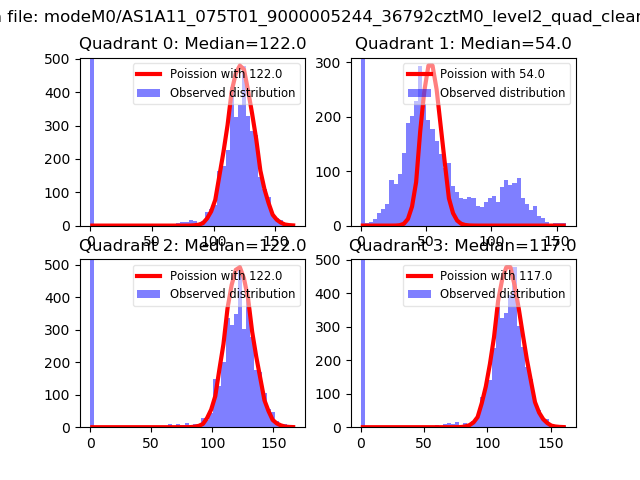 |
 |
| Quadrant-wise count rates Data is divided into 100 sec bins |
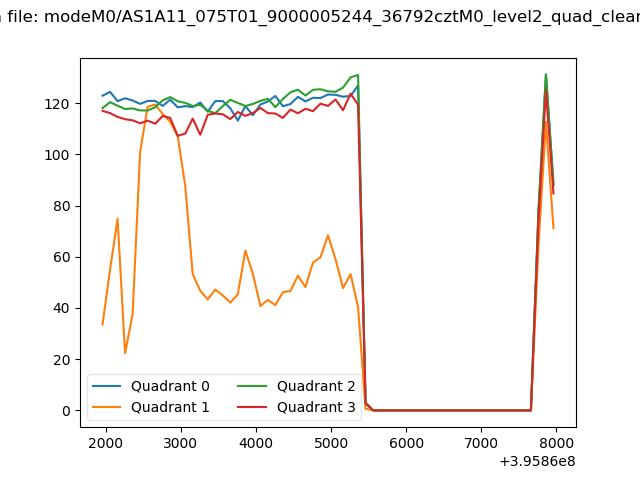 |
|
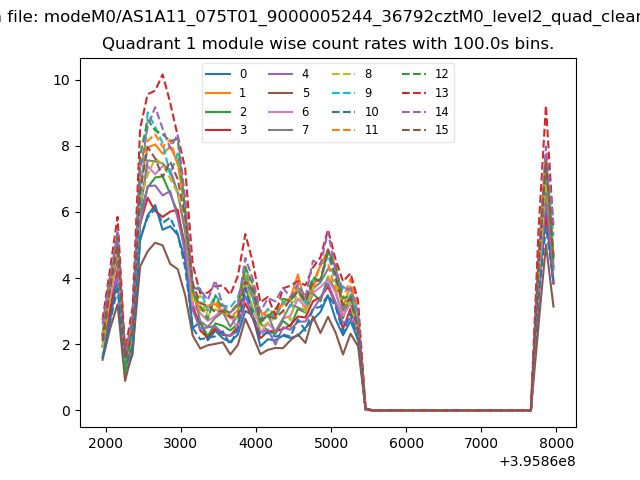
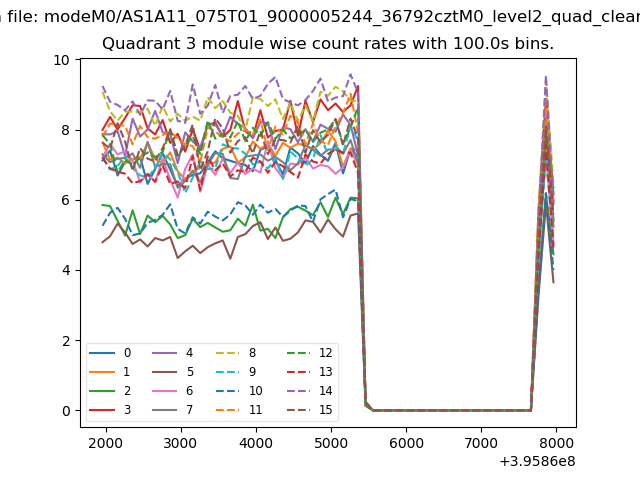
| Module-wise count rates for Quadrant A Data is divided into 100 sec bins |
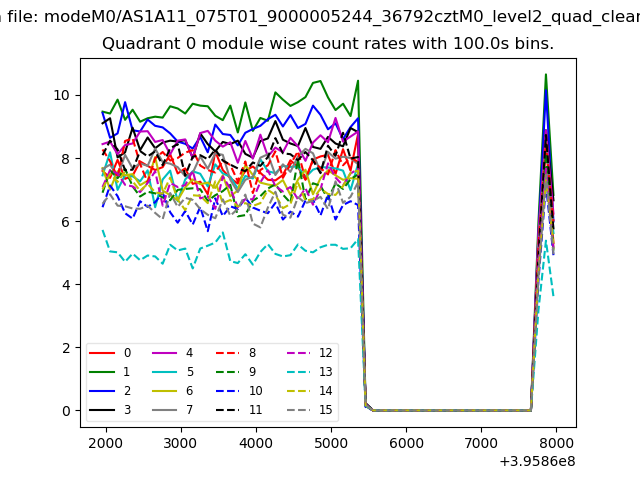 |
 |
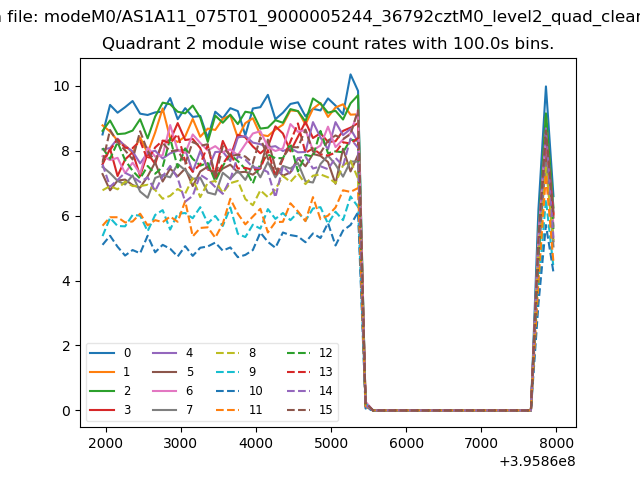
| Module-wise count rates for Quadrant B Data is divided into 100 sec bins |
 |
 |
| Module-wise count rates for Quadrant C Data is divided into 100 sec bins |
 |
 |
| Module-wise count rates for Quadrant D Data is divided into 100 sec bins |
 |
 |
| Parameter | Plot |
|---|---|
| CZT HV Monitor | 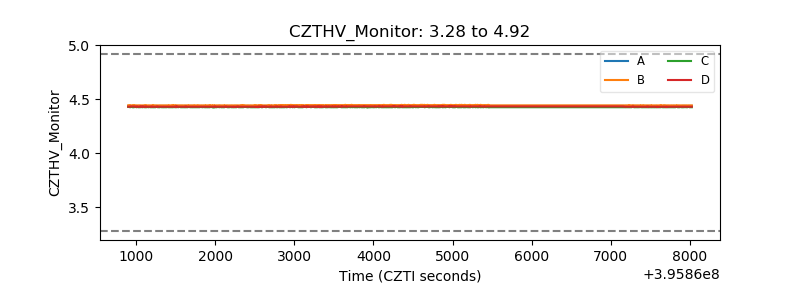 |
| D_VDD | 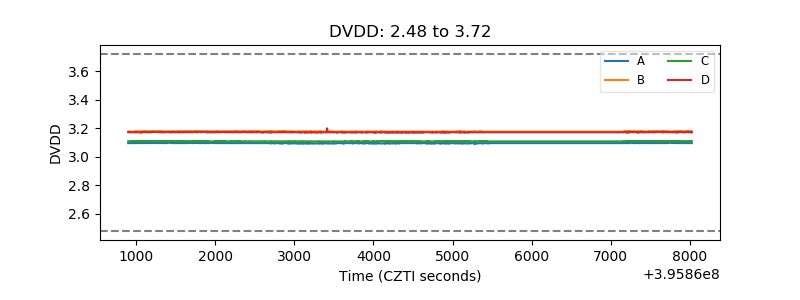 |
| Temperature 1 | 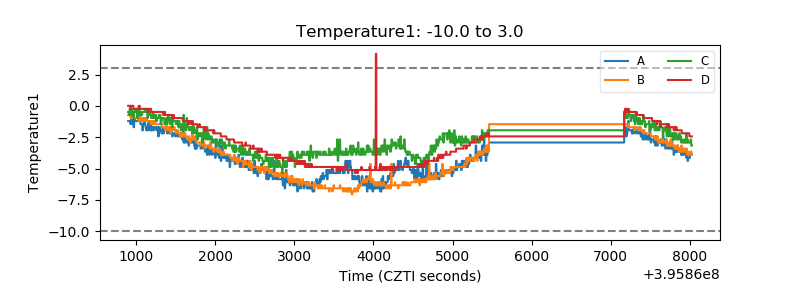 |
| Veto HV Monitor | 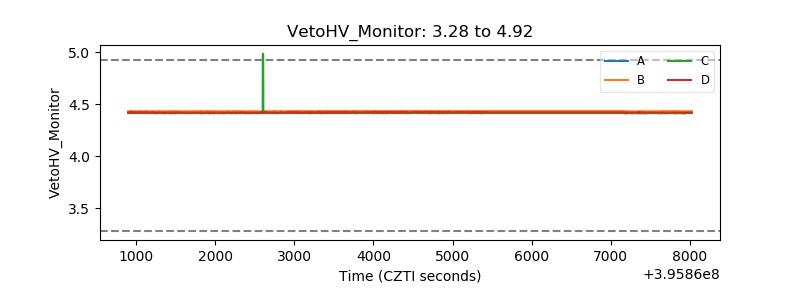 |
| Veto LLD | 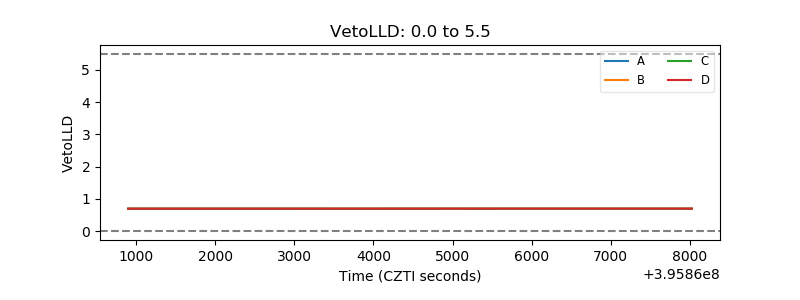 |
| Alpha Counter | 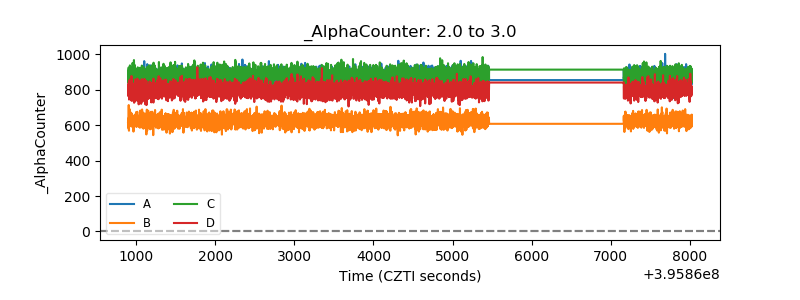 |
| _CPM_Rate | 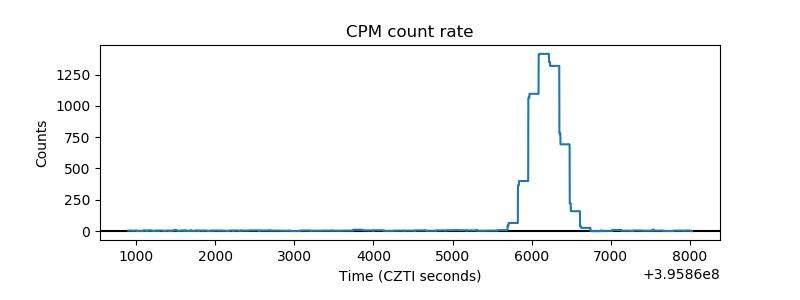 |
| CZT Counter | 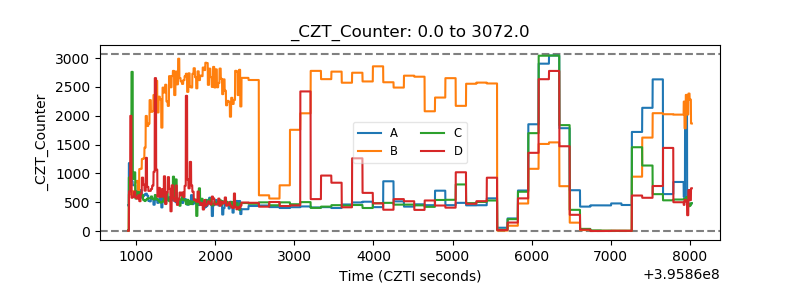 |
| +2.5 Volts monitor |  |
| +5 Volts monitor |  |
| _ROLL_ROT | 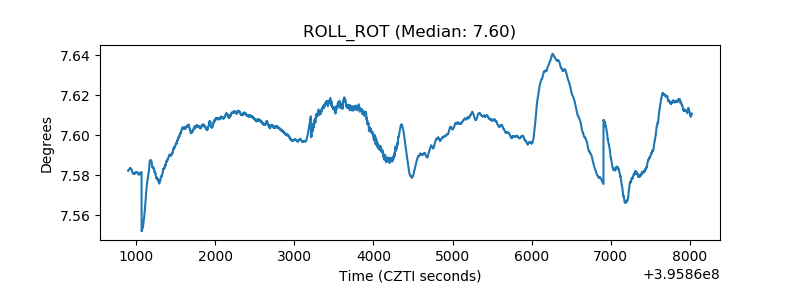 |
| _Roll_DEC | 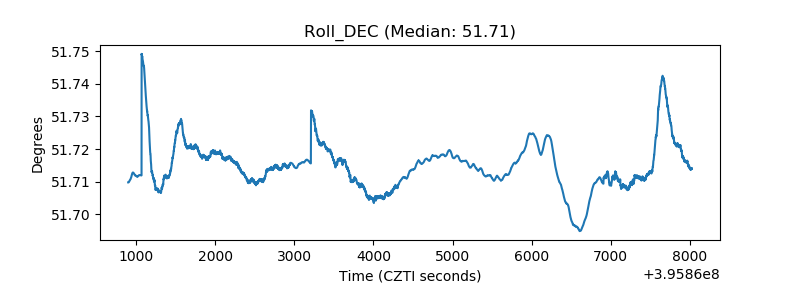 |
| _Roll_RA | 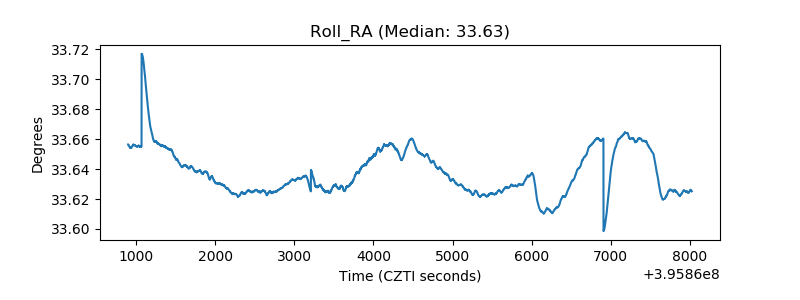 |
| Veto Counter | 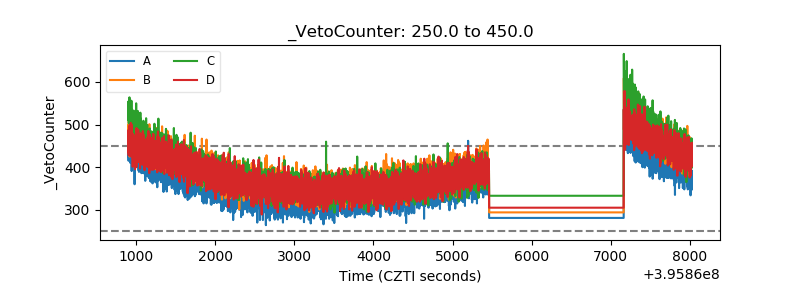 |