| Param | Original file | Final file |
|---|---|---|
| Filename | modeM0/AS1A11_075T01_9000005244_36794cztM0_level2.evt | modeM0/AS1A11_075T01_9000005244_36794cztM0_level2_quad_clean.evt |
| Size (bytes) | 685,321,920 | 79,237,440 |
| Size | 653.6 MB | 75.6 MB |
| Events in quadrant A | 3,228,378 | 559,595 |
| Events in quadrant B | 10,150,595 | 374,777 |
| Events in quadrant C | 3,297,517 | 566,570 |
| Events in quadrant D | 3,721,813 | 527,710 |
| Mode SS | |||
|---|---|---|---|
| Quadrant | BADHDUFLAG | Total packets | Discarded packets |
| A | 0 | 108 | 0 |
| B | 0 | 108 | 0 |
| C | 0 | 108 | 0 |
| D | 0 | 108 | 0 |
| Mode M0 | |||
|---|---|---|---|
| Quadrant | BADHDUFLAG | Total packets | Discarded packets |
| A | 0 | 13110 | 3 |
| B | 0 | 33873 | 2 |
| C | 0 | 13130 | 2 |
| D | 0 | 14737 | 2 |
| Mode M9 | |||
|---|---|---|---|
| Quadrant | BADHDUFLAG | Total packets | Discarded packets |
| A | 0 | 26 | 0 |
| B | 0 | 26 | 0 |
| C | 0 | 26 | 0 |
| D | 0 | 27 | 0 |
| Quadrant | Total seconds | Saturated seconds | Saturation percentage |
|---|---|---|---|
| A | 5273 | 192 | 3.641191% |
| B | 5273 | 3215 | 60.970984% |
| C | 5273 | 178 | 3.375687% |
| D | 5273 | 239 | 4.532524% |
Noise dominated data is calculated using 1-second bins in cleaned event files. If a bin has >2000 counts, and if more than 50% of those come from <1% of pixels, then it is considered to be noise-dominated and hence unusable.
| Quadrant | # 1 sec bins | Bins with >0 counts | Bins with >2000 counts | High rate bins dominated by noise | Noise dominated (total time) | Noise dominated (detector-on time) | Marked lightcurve |
|---|---|---|---|---|---|---|---|
| A | 7066 | 5274 | 132 | 132 | 1.87% | 2.50% | 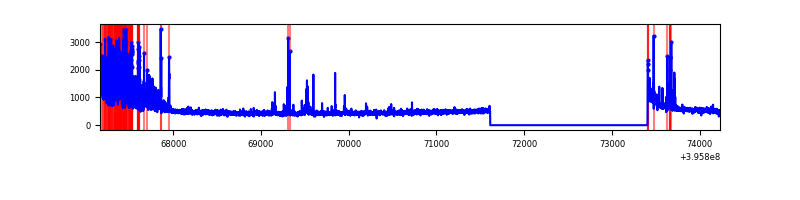 |
| B | 7066 | 5273 | 2905 | 2905 | 41.11% | 55.09% | 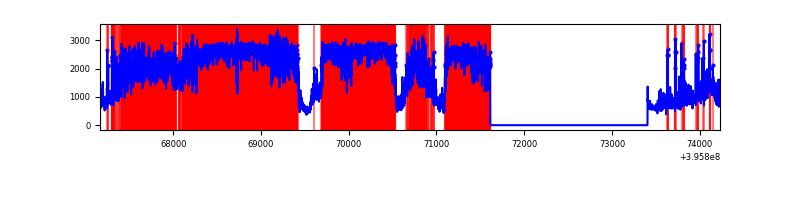 |
| C | 7066 | 5274 | 148 | 148 | 2.09% | 2.81% | 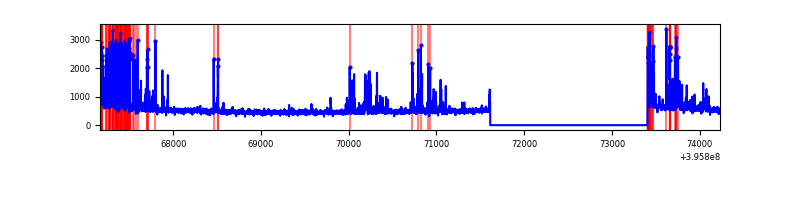 |
| D | 7066 | 5274 | 230 | 230 | 3.26% | 4.36% | 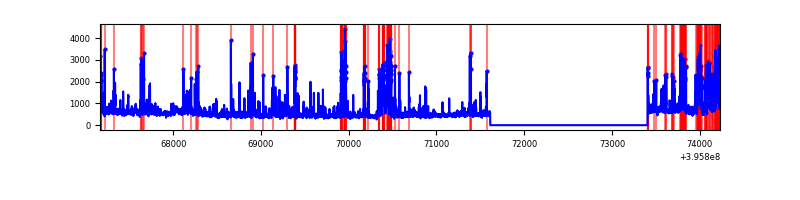 |
Top three noisy pixels from each quadrant. If the there are fewer than three noisy pixels in the level2.evt file, extra rows are filled as -1
| Pixel properties | Quadrant properties | ||||||
|---|---|---|---|---|---|---|---|
| Quadrant | DetID | PixID | Counts | Sigma | Mean | Median | Sigma |
| A | 7 | 16 | 464420 | 3747.68 | 608 | 598 | 123.8 |
| A | 10 | 83 | 228832 | 1844.13 | 608 | 598 | 123.8 |
| A | 13 | 248 | 100026 | 803.38 | 608 | 598 | 123.8 |
| B | 12 | 1 | 7501122 | 84054.08 | 472 | 460 | 89.2 |
| B | 5 | 172 | 167781 | 1875.03 | 472 | 460 | 89.2 |
| B | 0 | 221 | 127232 | 1420.63 | 472 | 460 | 89.2 |
| C | 1 | 23 | 340747 | 2442.76 | 602 | 609 | 139.2 |
| C | 15 | 214 | 236498 | 1694.08 | 602 | 609 | 139.2 |
| C | 0 | 207 | 177180 | 1268.07 | 602 | 609 | 139.2 |
| D | 13 | 249 | 463797 | 3211.15 | 596 | 580 | 144.3 |
| D | 12 | 227 | 461601 | 3195.93 | 596 | 580 | 144.3 |
| D | 5 | 222 | 179920 | 1243.23 | 596 | 580 | 144.3 |
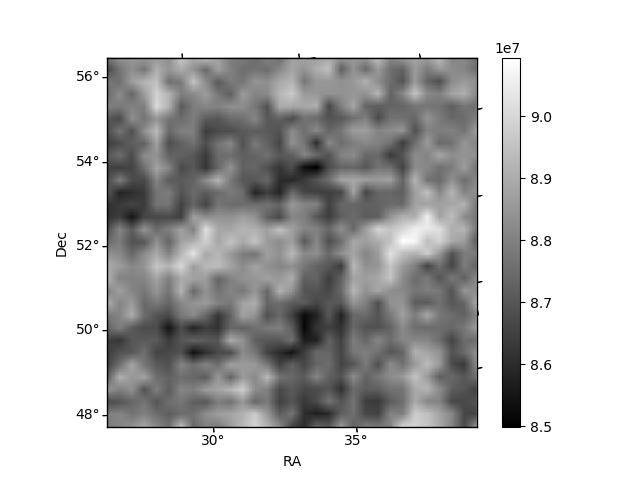
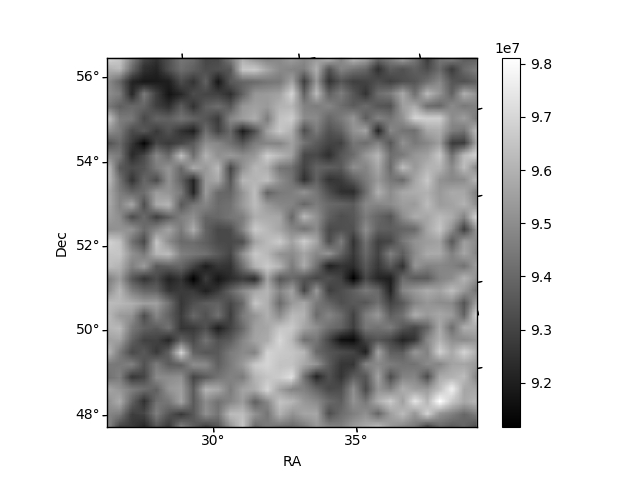
Histogram calculated using DETX and DETY for each event in the final _common_clean file
| Quadrant A | 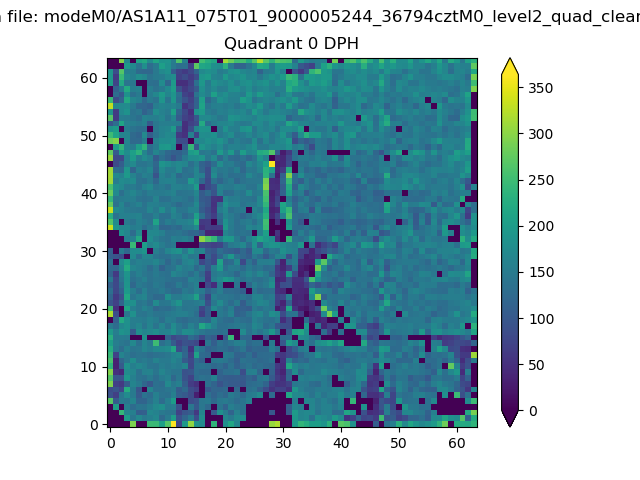 |
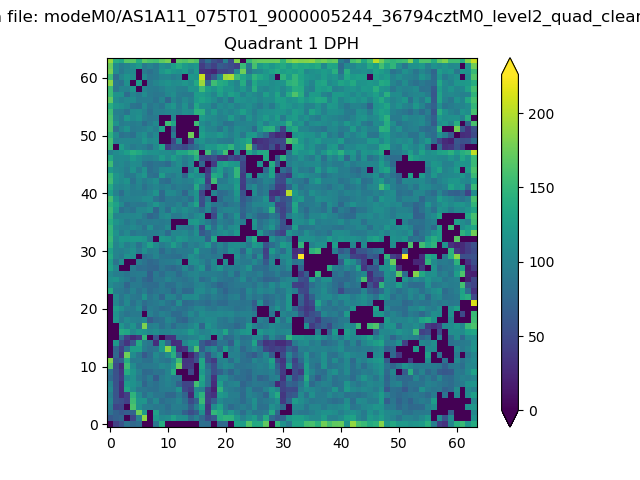 |
Quadrant B |
|---|---|---|---|
| Quadrant D | 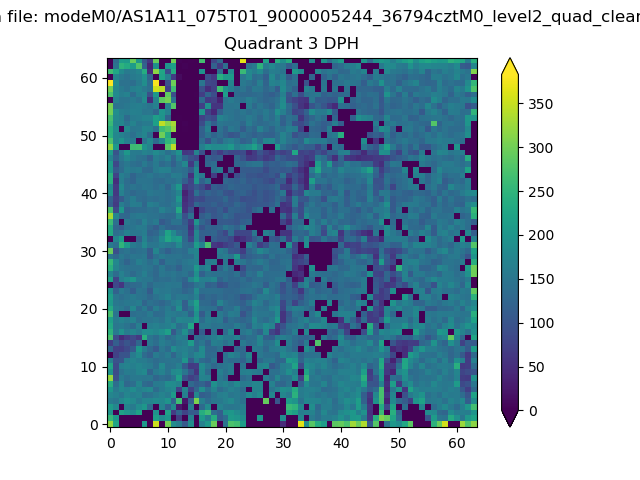 |
 |
Quadrant C |
| Plot type | Count rate plots | Images |
|---|---|---|
| Comparison with Poisson distribution Blue bars denote a histogram of data divided into 1 sec bins. Red curve is a Poisson curve with rate = median count rate of data. |
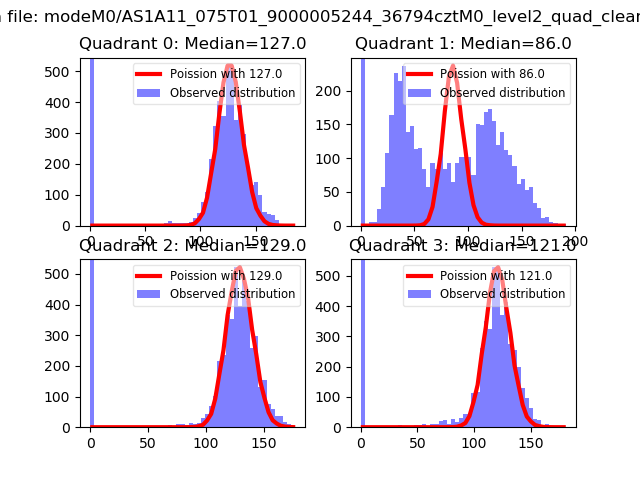 |
 |
| Quadrant-wise count rates Data is divided into 100 sec bins |
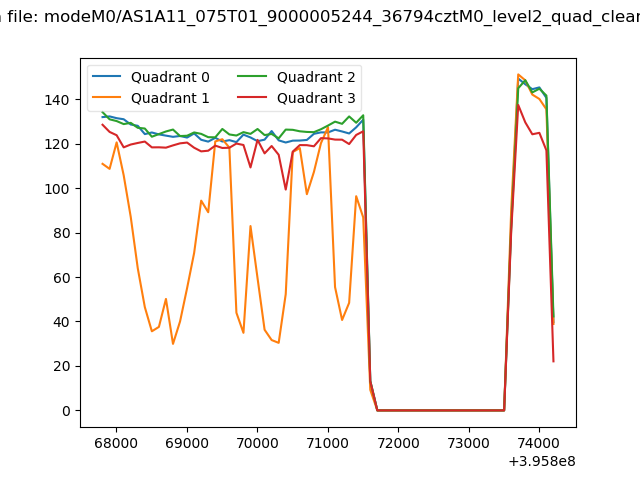 |
|
| Module-wise count rates for Quadrant A Data is divided into 100 sec bins |
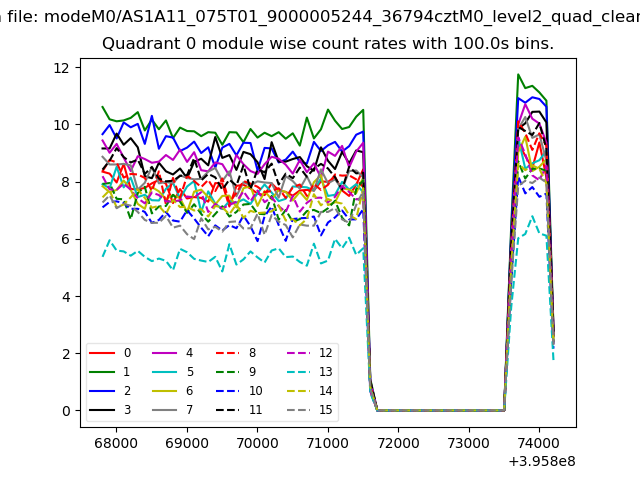 |
 |
| Module-wise count rates for Quadrant B Data is divided into 100 sec bins |
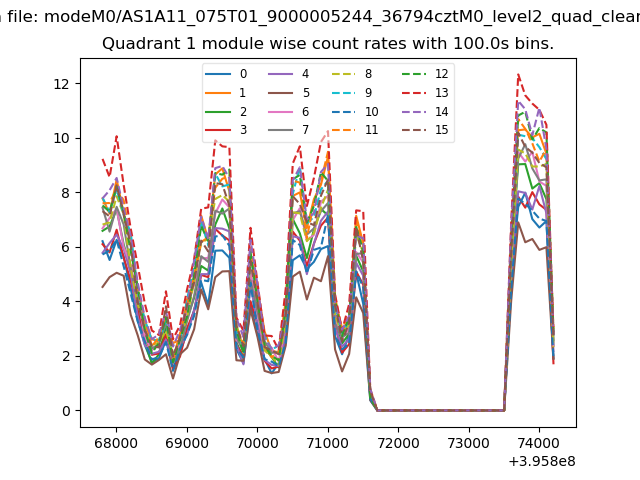 |
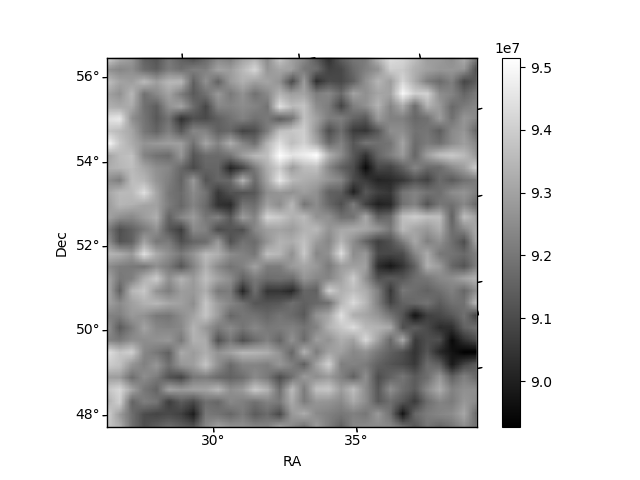 |
| Module-wise count rates for Quadrant C Data is divided into 100 sec bins |
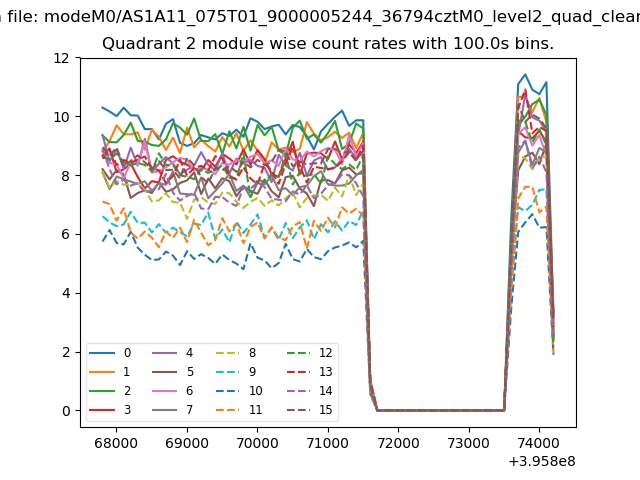 |
 |
| Module-wise count rates for Quadrant D Data is divided into 100 sec bins |
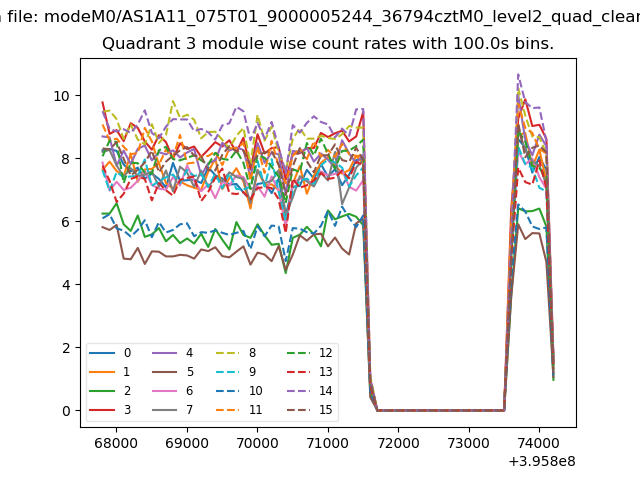 |
 |
| Parameter | Plot |
|---|---|
| CZT HV Monitor | 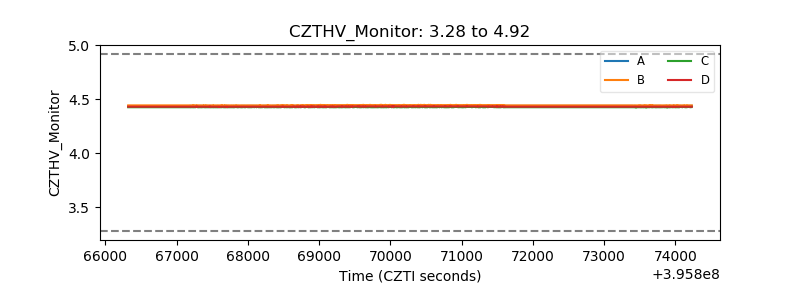 |
| D_VDD | 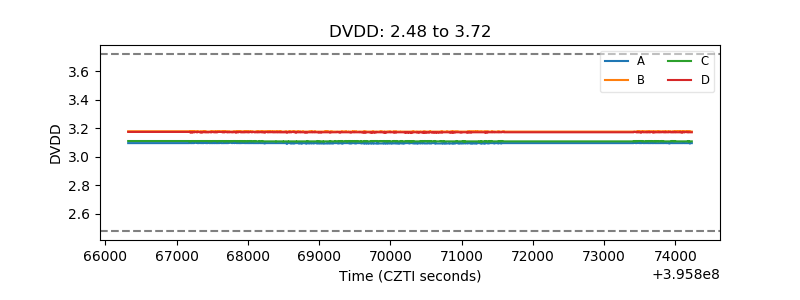 |
| Temperature 1 | 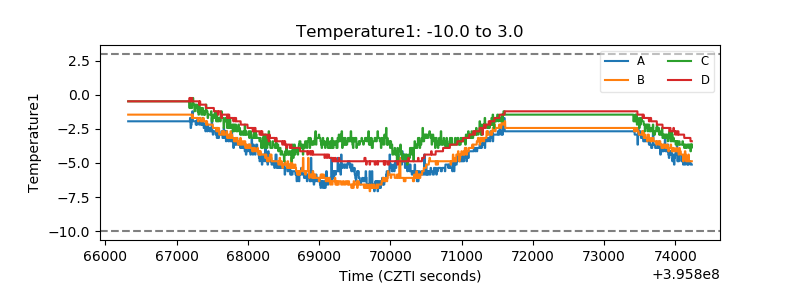 |
| Veto HV Monitor | 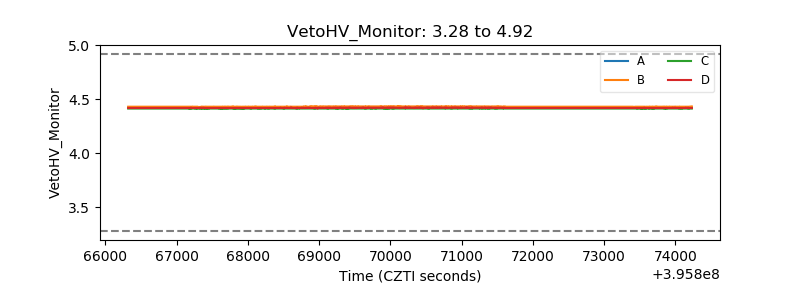 |
| Veto LLD | 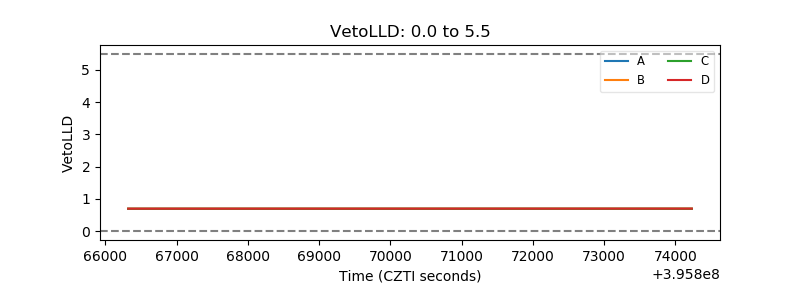 |
| Alpha Counter | 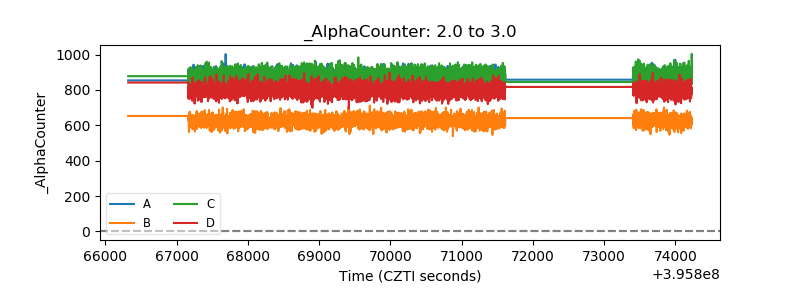 |
| _CPM_Rate | 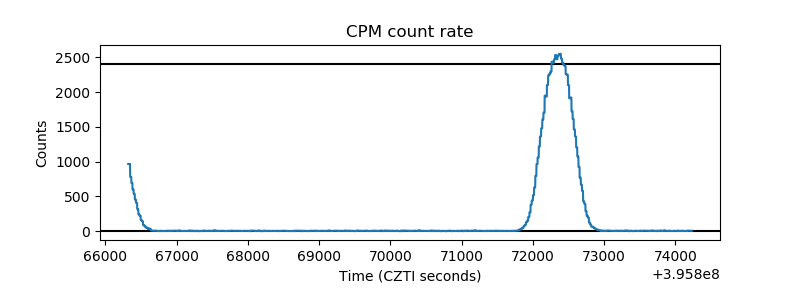 |
| CZT Counter |  |
| +2.5 Volts monitor |  |
| +5 Volts monitor |  |
| _ROLL_ROT |  |
| _Roll_DEC |  |
| _Roll_RA |  |
| Veto Counter |  |