| Param | Original file | Final file |
|---|---|---|
| Filename | modeM0/AS1A11_075T01_9000005244_36795cztM0_level2.evt | modeM0/AS1A11_075T01_9000005244_36795cztM0_level2_quad_clean.evt |
| Size (bytes) | 614,960,640 | 89,804,160 |
| Size | 586.5 MB | 85.6 MB |
| Events in quadrant A | 2,685,236 | 634,341 |
| Events in quadrant B | 8,510,046 | 484,296 |
| Events in quadrant C | 3,444,404 | 639,342 |
| Events in quadrant D | 3,633,624 | 597,426 |
| Mode SS | |||
|---|---|---|---|
| Quadrant | BADHDUFLAG | Total packets | Discarded packets |
| A | 0 | 108 | 0 |
| B | 0 | 108 | 0 |
| C | 0 | 108 | 0 |
| D | 0 | 108 | 0 |
| Mode M0 | |||
|---|---|---|---|
| Quadrant | BADHDUFLAG | Total packets | Discarded packets |
| A | 0 | 11290 | 3 |
| B | 0 | 28938 | 2 |
| C | 0 | 13507 | 2 |
| D | 0 | 14399 | 2 |
| Mode M9 | |||
|---|---|---|---|
| Quadrant | BADHDUFLAG | Total packets | Discarded packets |
| A | 0 | 35 | 0 |
| B | 0 | 35 | 0 |
| C | 0 | 35 | 0 |
| D | 0 | 36 | 0 |
| Quadrant | Total seconds | Saturated seconds | Saturation percentage |
|---|---|---|---|
| A | 5176 | 29 | 0.560278% |
| B | 5176 | 2290 | 44.242658% |
| C | 5176 | 142 | 2.743431% |
| D | 5176 | 270 | 5.216383% |
Noise dominated data is calculated using 1-second bins in cleaned event files. If a bin has >2000 counts, and if more than 50% of those come from <1% of pixels, then it is considered to be noise-dominated and hence unusable.
| Quadrant | # 1 sec bins | Bins with >0 counts | Bins with >2000 counts | High rate bins dominated by noise | Noise dominated (total time) | Noise dominated (detector-on time) | Marked lightcurve |
|---|---|---|---|---|---|---|---|
| A | 7118 | 5177 | 14 | 14 | 0.20% | 0.27% | 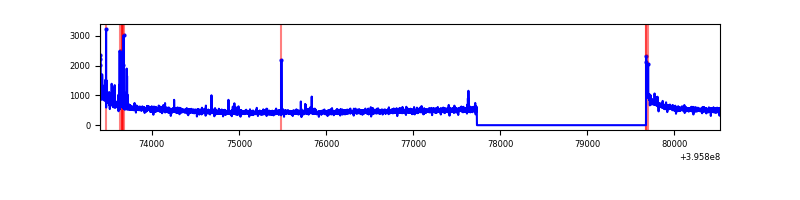 |
| B | 7118 | 5177 | 2177 | 2177 | 30.58% | 42.05% | 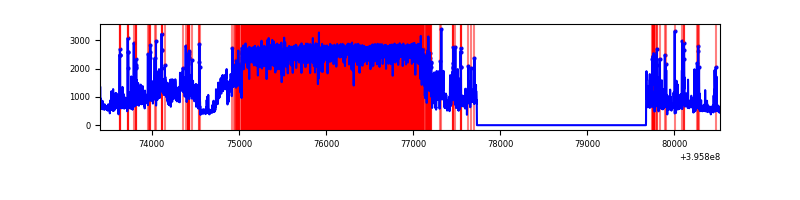 |
| C | 7118 | 5177 | 111 | 111 | 1.56% | 2.14% | 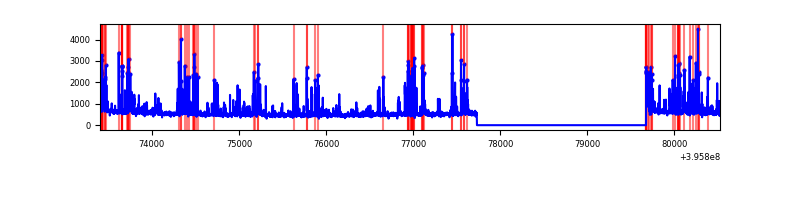 |
| D | 7118 | 5177 | 255 | 255 | 3.58% | 4.93% | 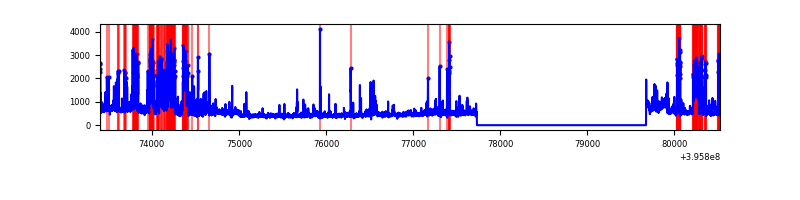 |
Top three noisy pixels from each quadrant. If the there are fewer than three noisy pixels in the level2.evt file, extra rows are filled as -1
| Pixel properties | Quadrant properties | ||||||
|---|---|---|---|---|---|---|---|
| Quadrant | DetID | PixID | Counts | Sigma | Mean | Median | Sigma |
| A | 10 | 83 | 223610 | 1801.11 | 613 | 603 | 123.8 |
| A | 13 | 248 | 43722 | 348.25 | 613 | 603 | 123.8 |
| A | 9 | 143 | 23289 | 183.22 | 613 | 603 | 123.8 |
| B | 12 | 1 | 5751675 | 60411.85 | 506 | 495 | 95.2 |
| B | 5 | 172 | 205639 | 2154.88 | 506 | 495 | 95.2 |
| B | 0 | 221 | 160137 | 1676.92 | 506 | 495 | 95.2 |
| C | 0 | 207 | 566439 | 4042.28 | 604 | 609 | 140.0 |
| C | 15 | 214 | 233759 | 1665.62 | 604 | 609 | 140.0 |
| C | 0 | 10 | 131757 | 936.92 | 604 | 609 | 140.0 |
| D | 12 | 227 | 805677 | 5590.5 | 594 | 578 | 144.0 |
| D | 5 | 222 | 107405 | 741.79 | 594 | 578 | 144.0 |
| D | 2 | 250 | 94828 | 654.46 | 594 | 578 | 144.0 |
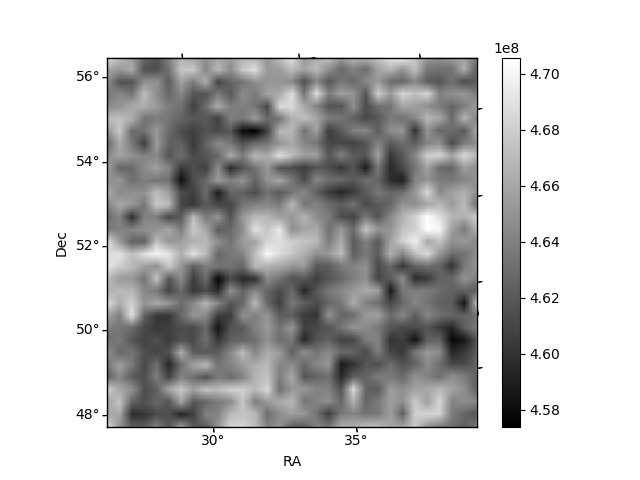
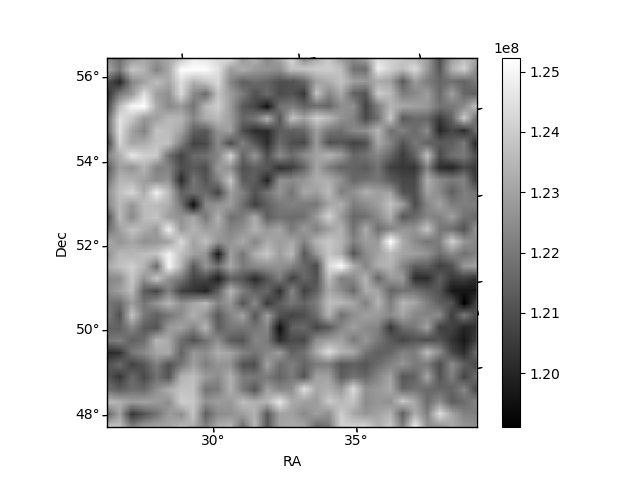
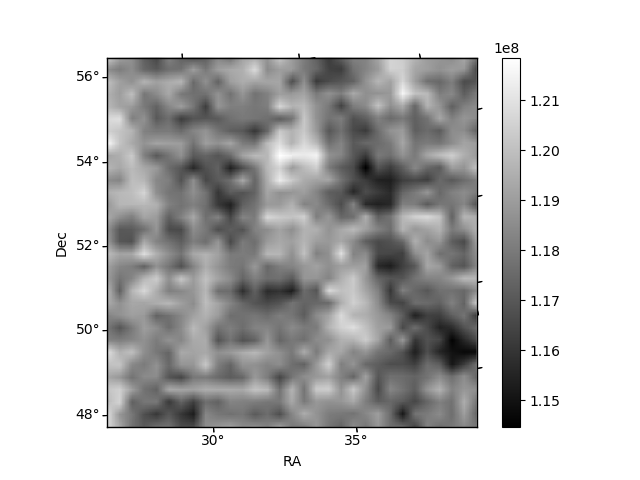
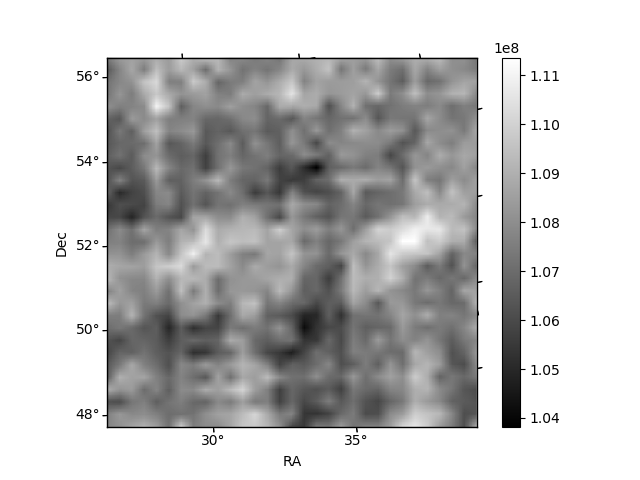
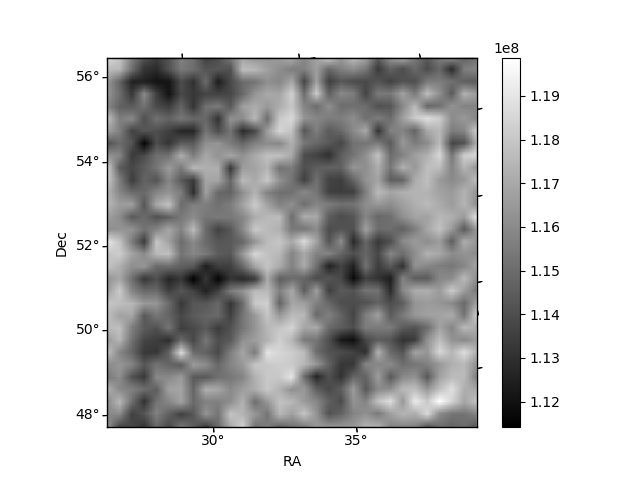
Histogram calculated using DETX and DETY for each event in the final _common_clean file
| Quadrant A | 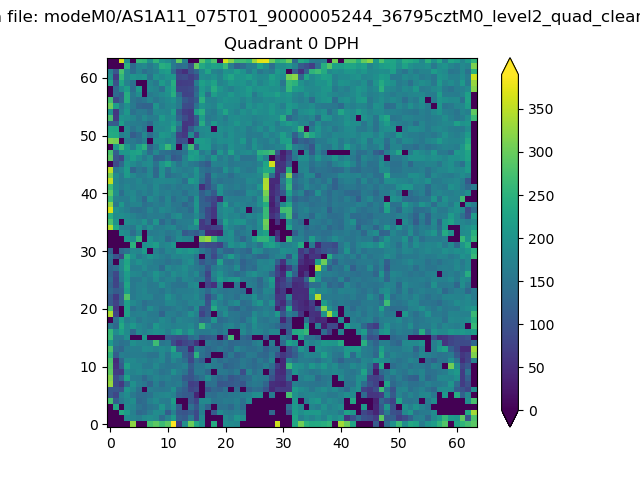 |
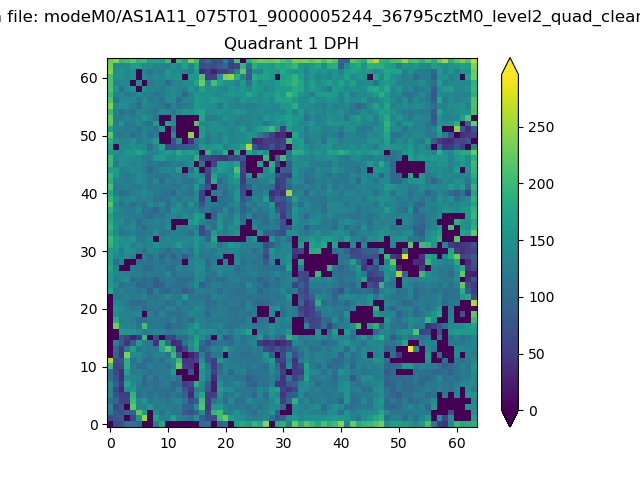 |
Quadrant B |
|---|---|---|---|
| Quadrant D | 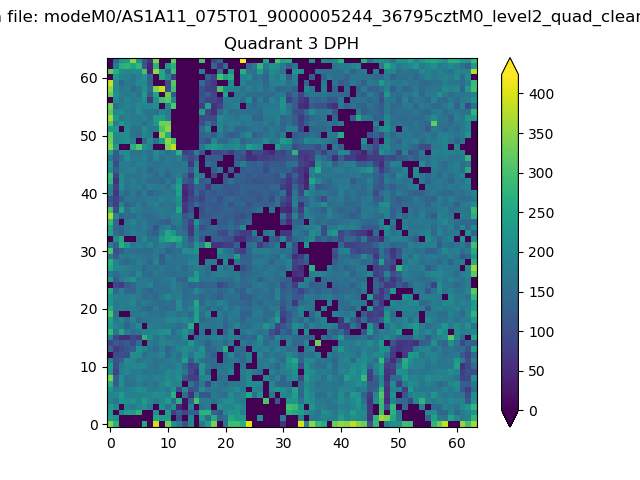 |
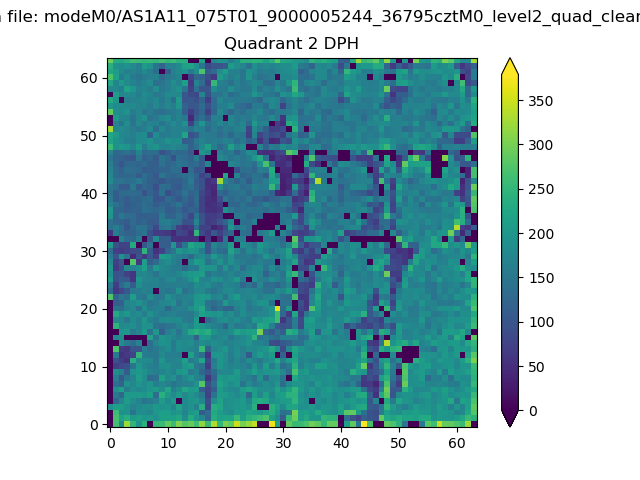 |
Quadrant C |
| Plot type | Count rate plots | Images |
|---|---|---|
| Comparison with Poisson distribution Blue bars denote a histogram of data divided into 1 sec bins. Red curve is a Poisson curve with rate = median count rate of data. |
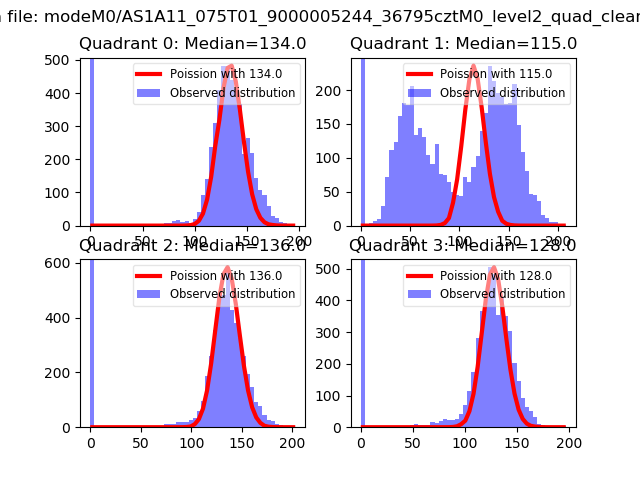 |
 |
| Quadrant-wise count rates Data is divided into 100 sec bins |
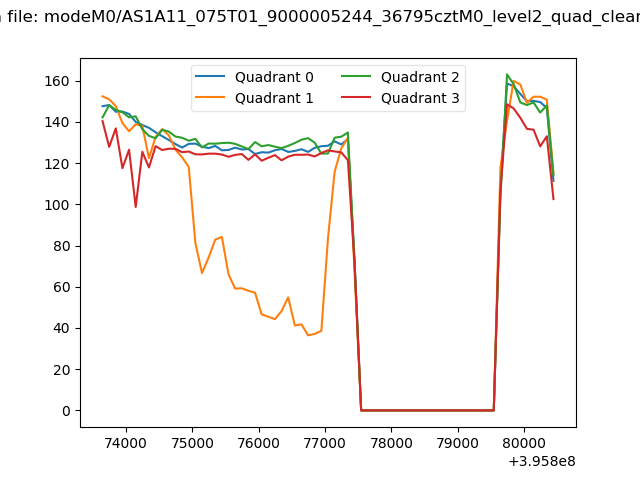 |
|
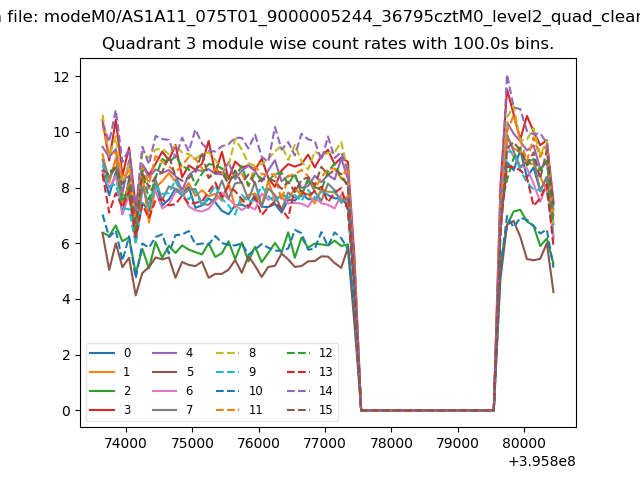
| Module-wise count rates for Quadrant A Data is divided into 100 sec bins |
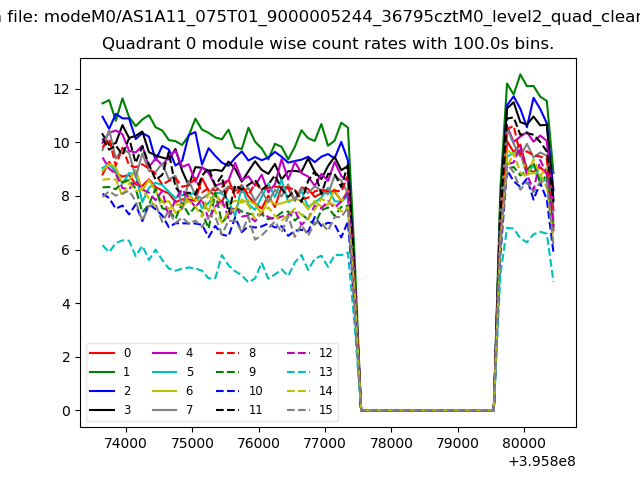 |
 |
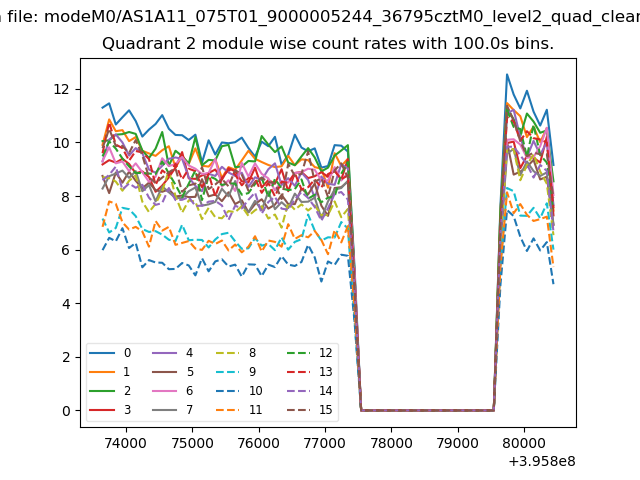
| Module-wise count rates for Quadrant B Data is divided into 100 sec bins |
 |
 |
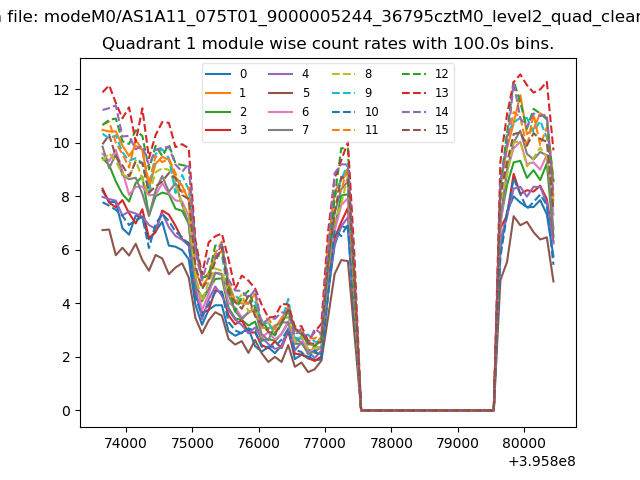
| Module-wise count rates for Quadrant C Data is divided into 100 sec bins |
 |
 |
| Module-wise count rates for Quadrant D Data is divided into 100 sec bins |
 |
 |
| Parameter | Plot |
|---|---|
| CZT HV Monitor | 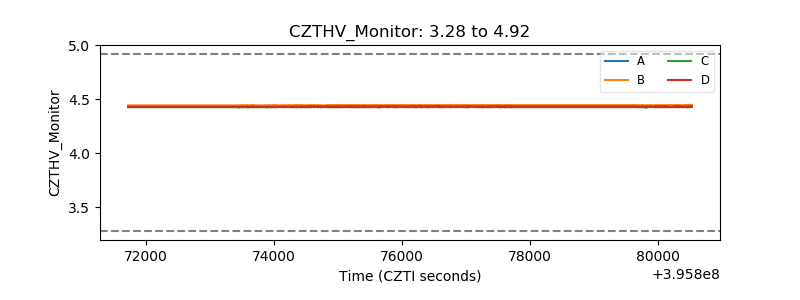 |
| D_VDD | 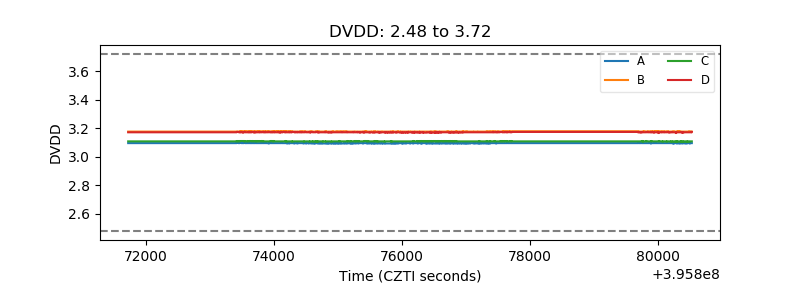 |
| Temperature 1 | 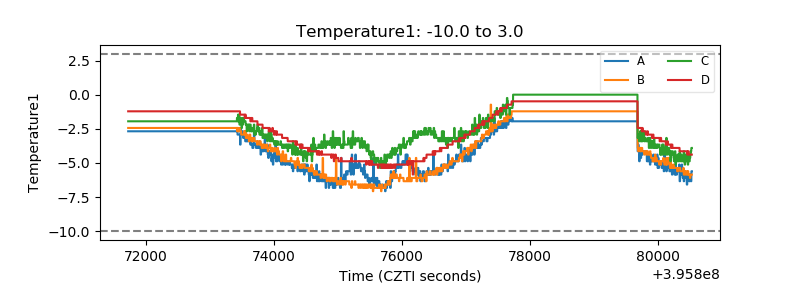 |
| Veto HV Monitor | 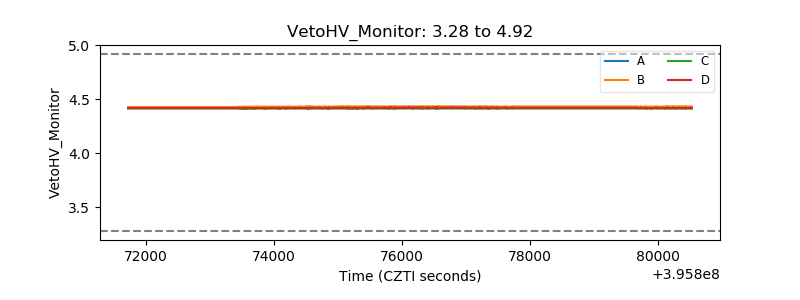 |
| Veto LLD | 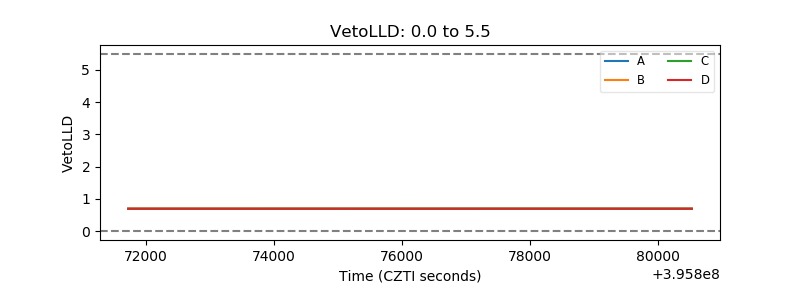 |
| Alpha Counter | 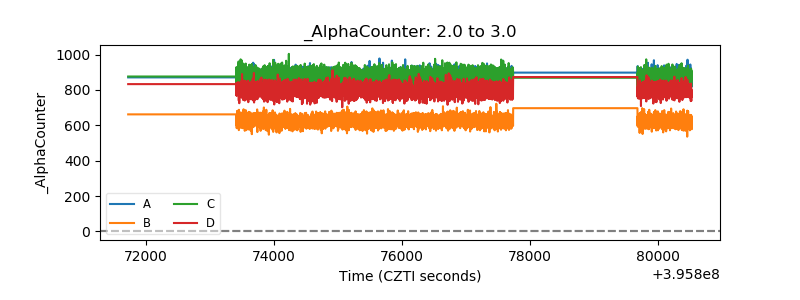 |
| _CPM_Rate | 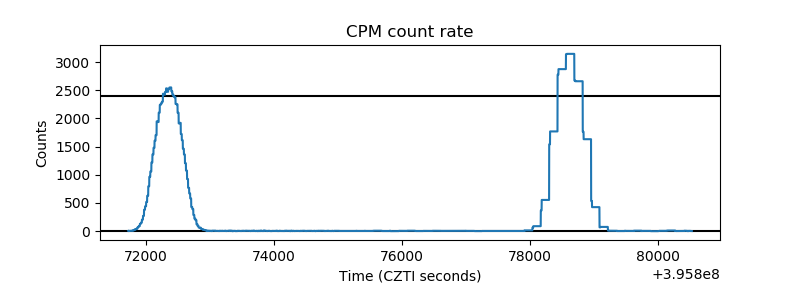 |
| CZT Counter | 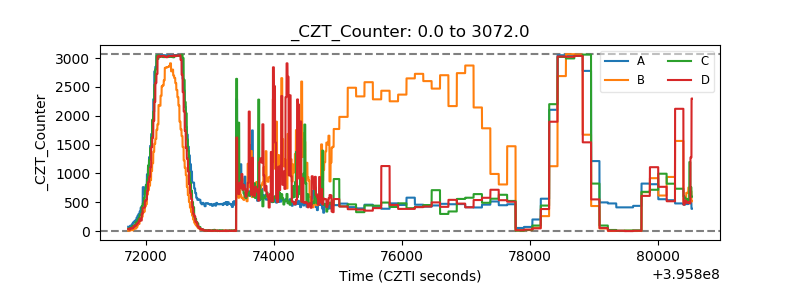 |
| +2.5 Volts monitor |  |
| +5 Volts monitor | 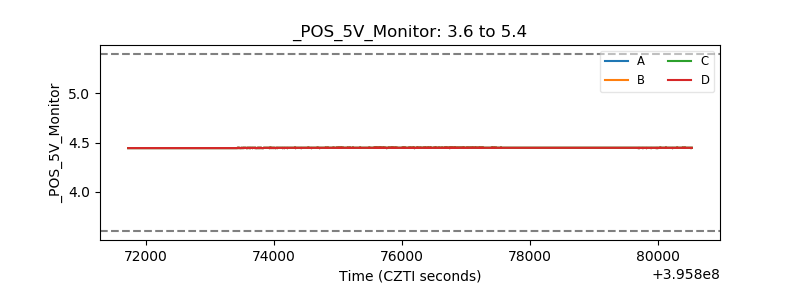 |
| _ROLL_ROT | 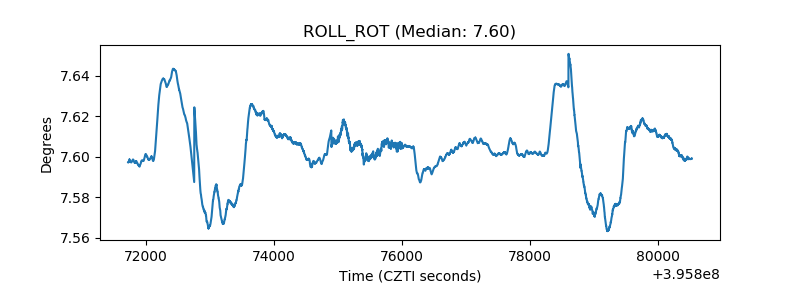 |
| _Roll_DEC |  |
| _Roll_RA | 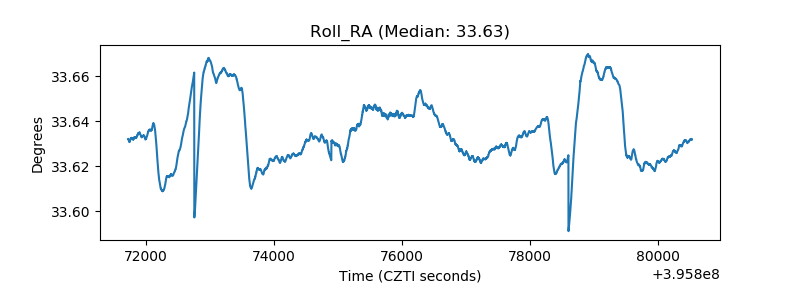 |
| Veto Counter | 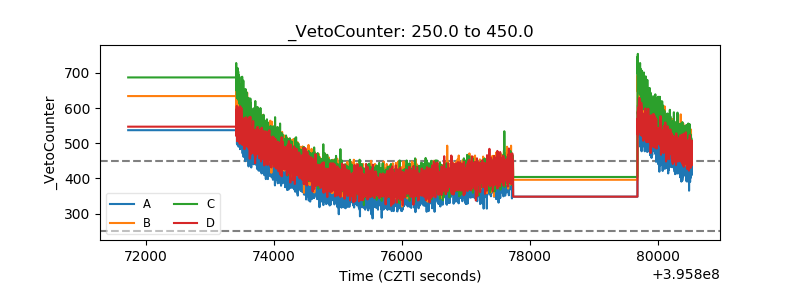 |