| Param | Original file | Final file |
|---|---|---|
| Filename | modeM0/AS1A11_075T01_9000005244_36796cztM0_level2.evt | modeM0/AS1A11_075T01_9000005244_36796cztM0_level2_quad_clean.evt |
| Size (bytes) | 527,711,040 | 90,141,120 |
| Size | 503.3 MB | 86.0 MB |
| Events in quadrant A | 2,543,322 | 613,760 |
| Events in quadrant B | 7,011,229 | 556,329 |
| Events in quadrant C | 3,174,349 | 621,454 |
| Events in quadrant D | 2,913,020 | 586,381 |
| Mode SS | |||
|---|---|---|---|
| Quadrant | BADHDUFLAG | Total packets | Discarded packets |
| A | 0 | 102 | 0 |
| B | 0 | 102 | 0 |
| C | 0 | 102 | 0 |
| D | 0 | 102 | 0 |
| Mode M0 | |||
|---|---|---|---|
| Quadrant | BADHDUFLAG | Total packets | Discarded packets |
| A | 0 | 10697 | 3 |
| B | 0 | 24265 | 2 |
| C | 0 | 12475 | 2 |
| D | 0 | 12043 | 2 |
| Mode M9 | |||
|---|---|---|---|
| Quadrant | BADHDUFLAG | Total packets | Discarded packets |
| A | 0 | 38 | 0 |
| B | 0 | 38 | 0 |
| C | 0 | 38 | 0 |
| D | 0 | 39 | 0 |
| Quadrant | Total seconds | Saturated seconds | Saturation percentage |
|---|---|---|---|
| A | 5013 | 10 | 0.199481% |
| B | 5013 | 1594 | 31.797327% |
| C | 5013 | 126 | 2.513465% |
| D | 5013 | 108 | 2.154399% |
Noise dominated data is calculated using 1-second bins in cleaned event files. If a bin has >2000 counts, and if more than 50% of those come from <1% of pixels, then it is considered to be noise-dominated and hence unusable.
| Quadrant | # 1 sec bins | Bins with >0 counts | Bins with >2000 counts | High rate bins dominated by noise | Noise dominated (total time) | Noise dominated (detector-on time) | Marked lightcurve |
|---|---|---|---|---|---|---|---|
| A | 7046 | 5014 | 6 | 6 | 0.09% | 0.12% | 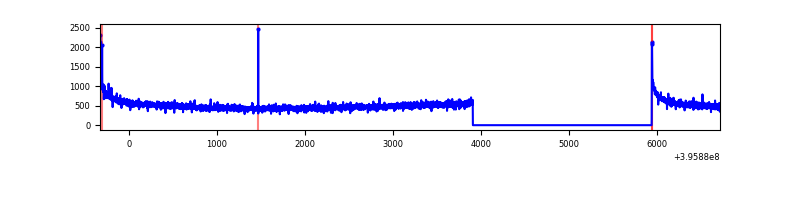 |
| B | 7046 | 5014 | 1433 | 1433 | 20.34% | 28.58% | 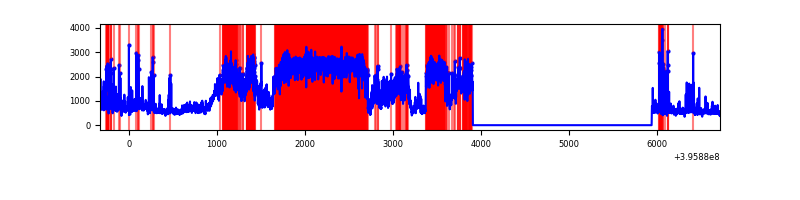 |
| C | 7046 | 5014 | 106 | 106 | 1.50% | 2.11% | 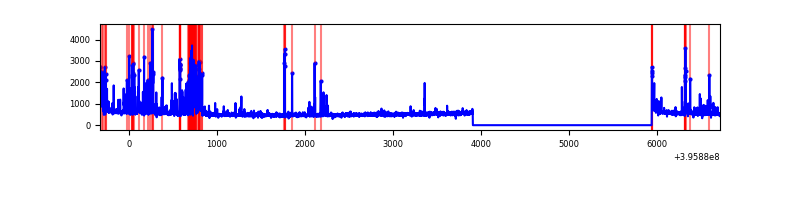 |
| D | 7046 | 5014 | 97 | 97 | 1.38% | 1.93% | 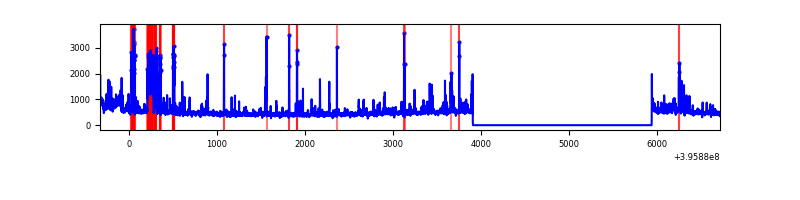 |
Top three noisy pixels from each quadrant. If the there are fewer than three noisy pixels in the level2.evt file, extra rows are filled as -1
| Pixel properties | Quadrant properties | ||||||
|---|---|---|---|---|---|---|---|
| Quadrant | DetID | PixID | Counts | Sigma | Mean | Median | Sigma |
| A | 10 | 83 | 212653 | 1774.43 | 596 | 586 | 119.5 |
| A | 9 | 143 | 12484 | 99.55 | 596 | 586 | 119.5 |
| A | 13 | 6 | 11466 | 91.04 | 596 | 586 | 119.5 |
| B | 12 | 1 | 4192536 | 41122.42 | 547 | 535 | 101.9 |
| B | 5 | 172 | 226134 | 2213.07 | 547 | 535 | 101.9 |
| B | 0 | 190 | 130650 | 1276.39 | 547 | 535 | 101.9 |
| C | 1 | 23 | 254370 | 1879.88 | 587 | 593 | 135.0 |
| C | 15 | 214 | 228491 | 1688.18 | 587 | 593 | 135.0 |
| C | 0 | 207 | 207988 | 1536.3 | 587 | 593 | 135.0 |
| D | 12 | 227 | 248093 | 1776.62 | 579 | 565 | 139.3 |
| D | 5 | 222 | 72939 | 519.46 | 579 | 565 | 139.3 |
| D | 10 | 203 | 59817 | 425.28 | 579 | 565 | 139.3 |
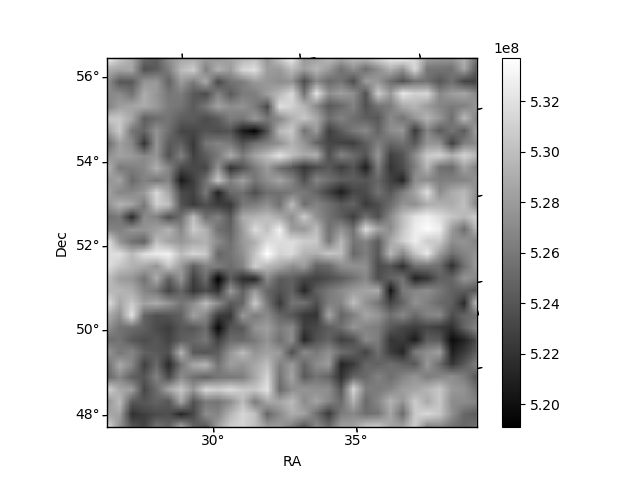
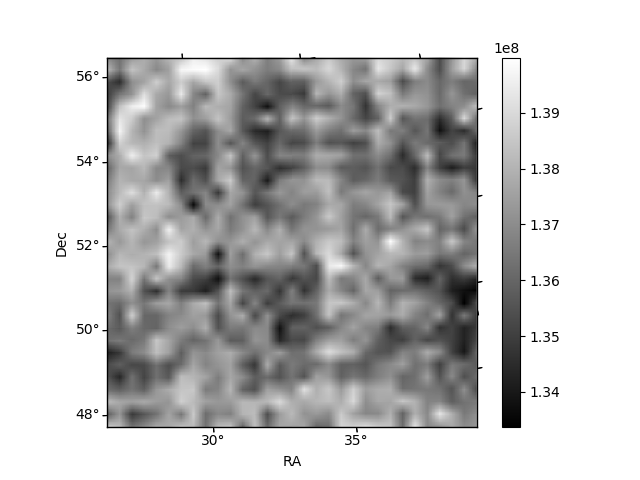
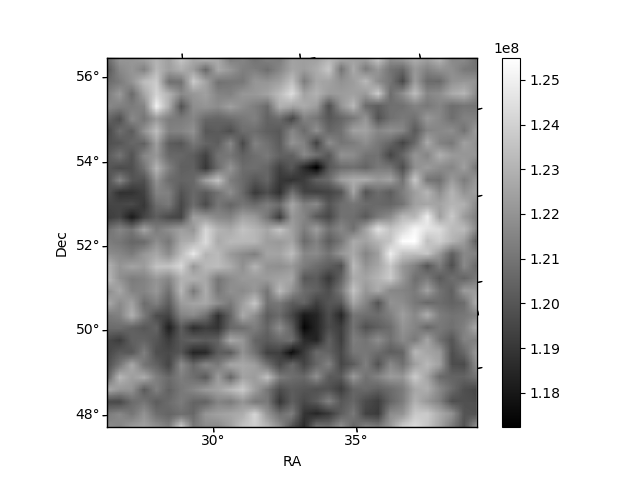
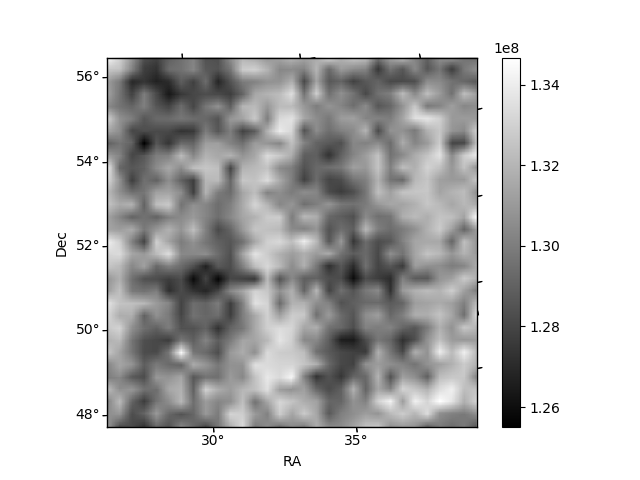
Histogram calculated using DETX and DETY for each event in the final _common_clean file
| Quadrant A | 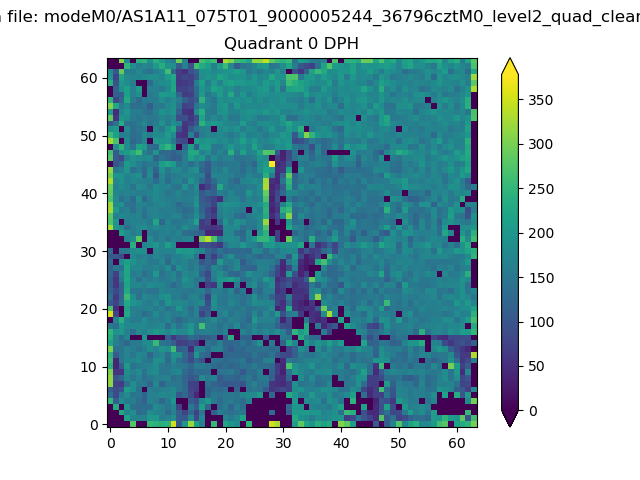 |
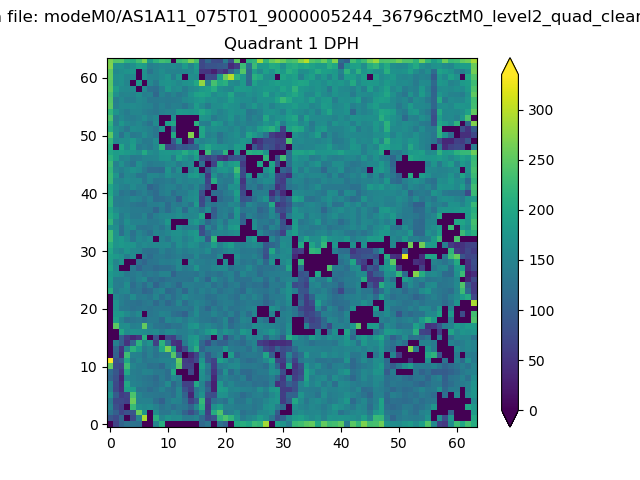 |
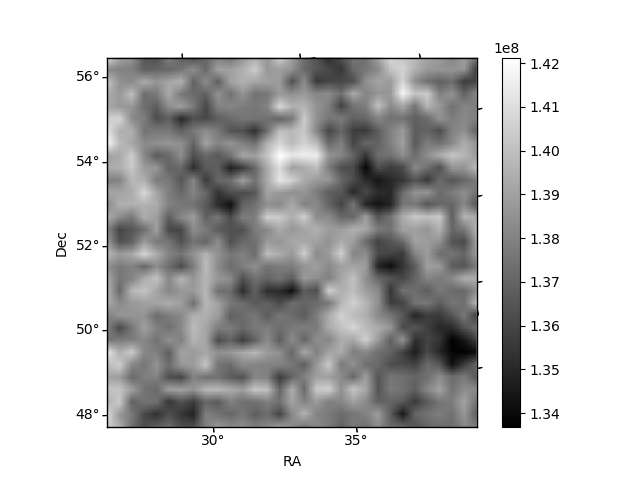
Quadrant B |
|---|---|---|---|
| Quadrant D | 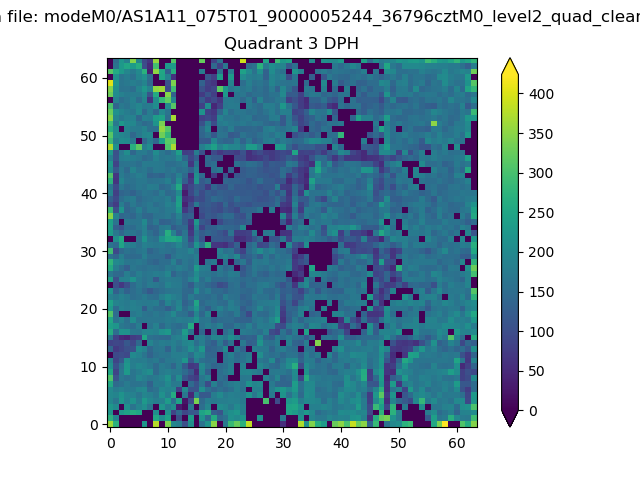 |
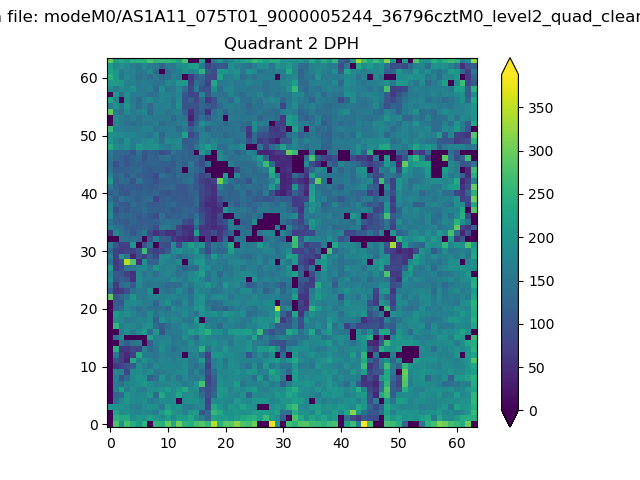 |
Quadrant C |
| Plot type | Count rate plots | Images |
|---|---|---|
| Comparison with Poisson distribution Blue bars denote a histogram of data divided into 1 sec bins. Red curve is a Poisson curve with rate = median count rate of data. |
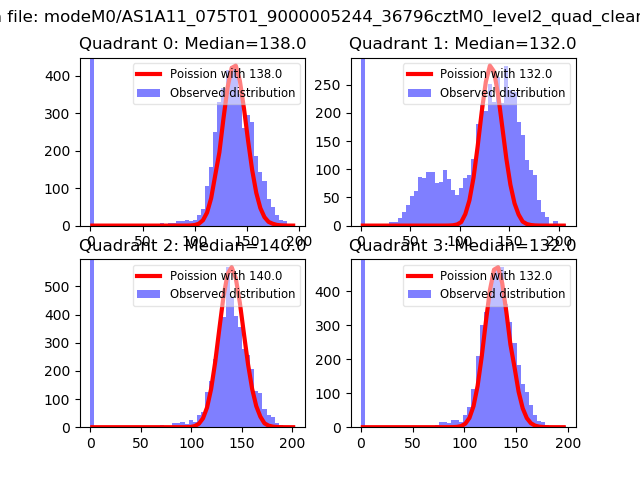 |
 |
| Quadrant-wise count rates Data is divided into 100 sec bins |
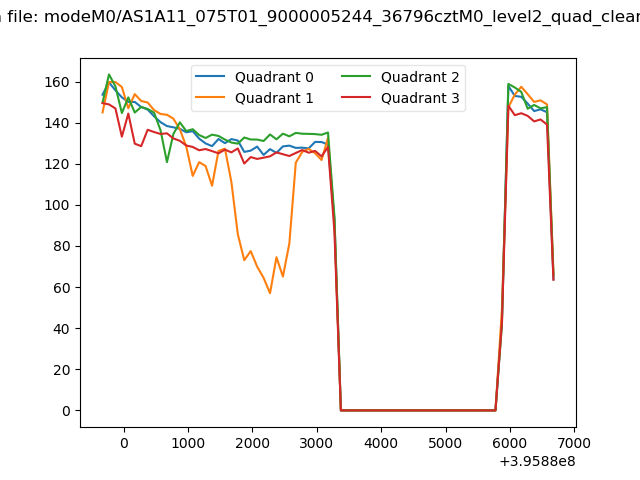 |
|
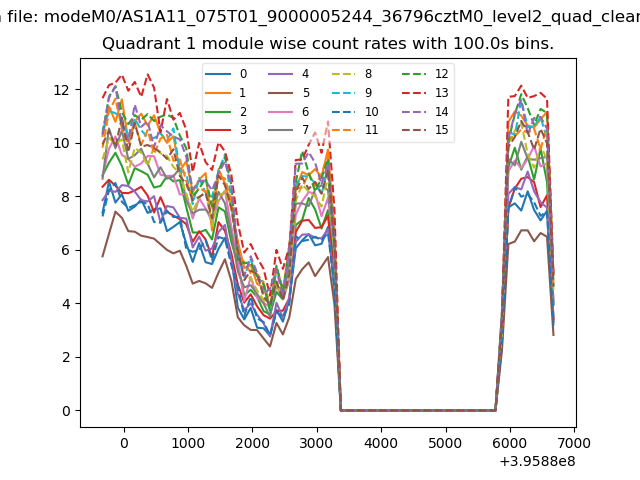
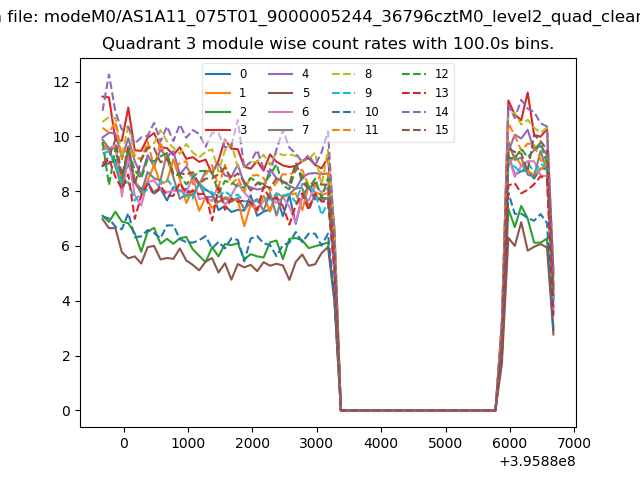
| Module-wise count rates for Quadrant A Data is divided into 100 sec bins |
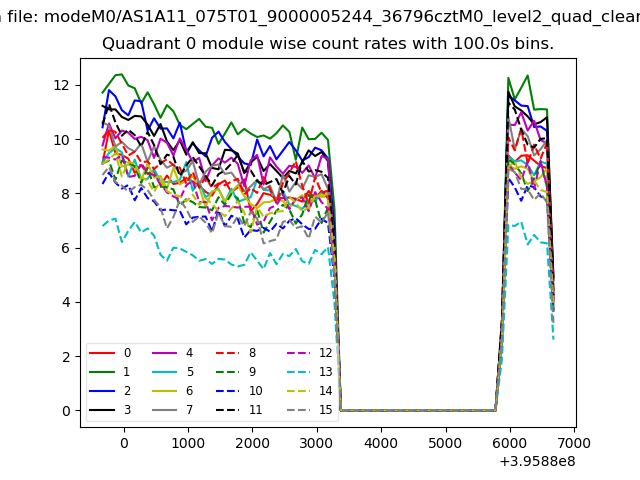 |
 |
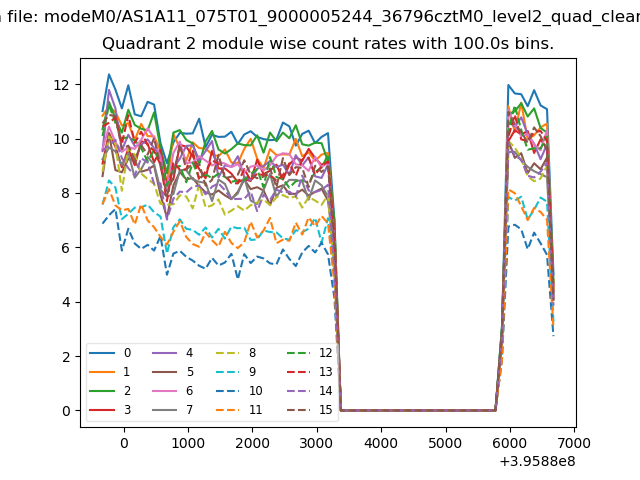
| Module-wise count rates for Quadrant B Data is divided into 100 sec bins |
 |
 |
| Module-wise count rates for Quadrant C Data is divided into 100 sec bins |
 |
 |
| Module-wise count rates for Quadrant D Data is divided into 100 sec bins |
 |
 |
| Parameter | Plot |
|---|---|
| CZT HV Monitor | 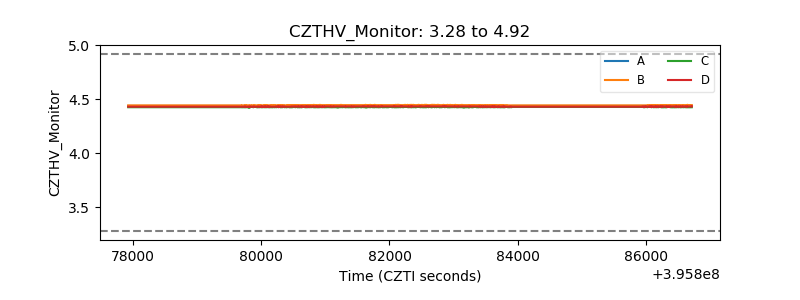 |
| D_VDD | 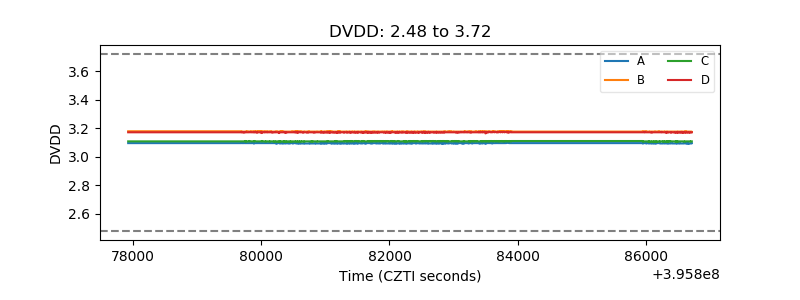 |
| Temperature 1 | 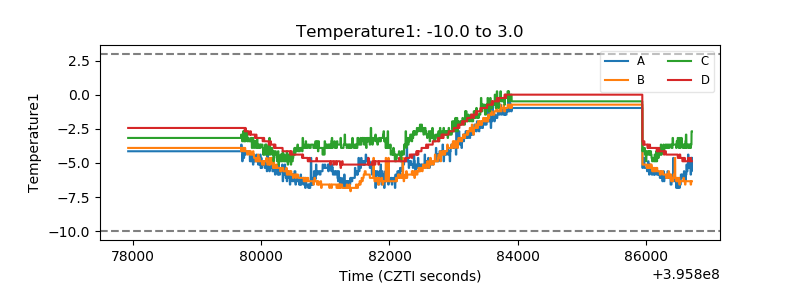 |
| Veto HV Monitor | 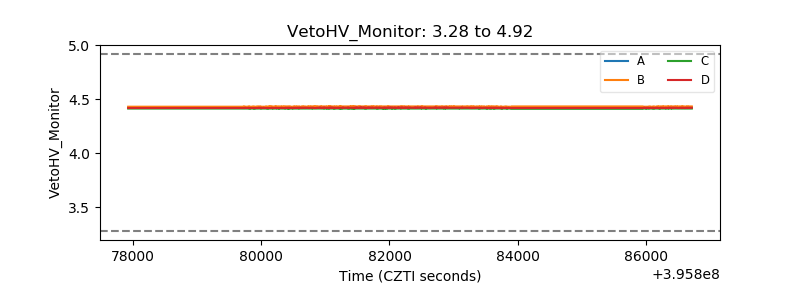 |
| Veto LLD | 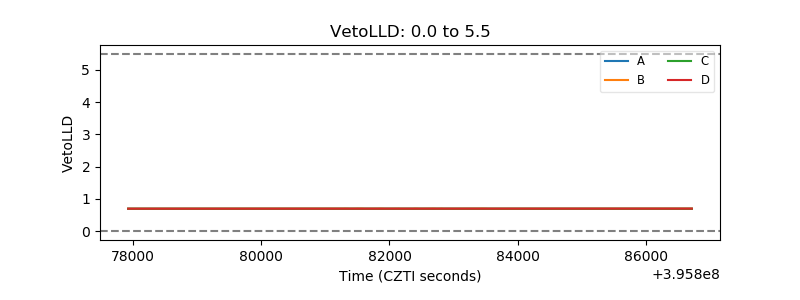 |
| Alpha Counter | 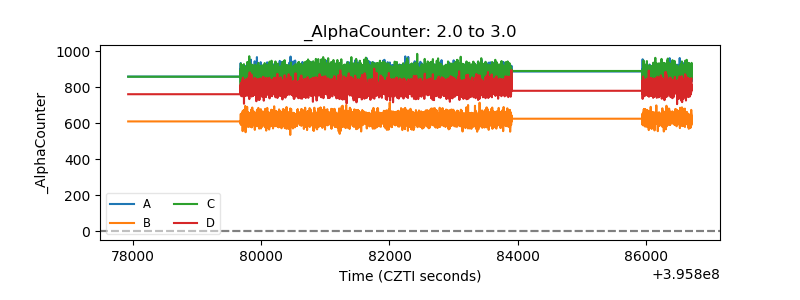 |
| _CPM_Rate | 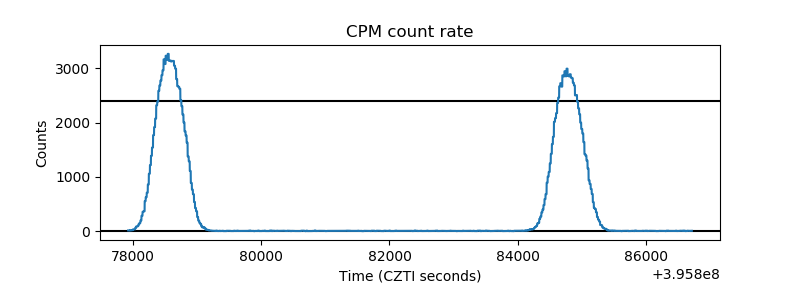 |
| CZT Counter | 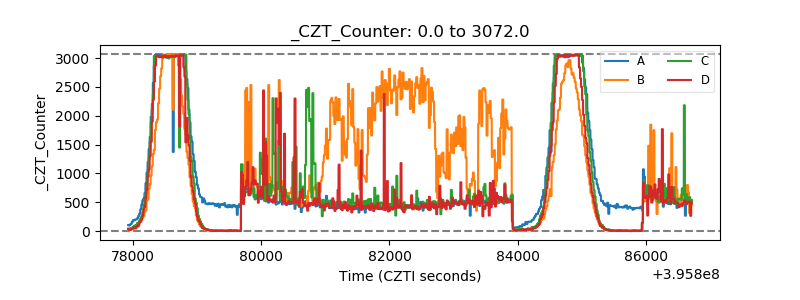 |
| +2.5 Volts monitor | 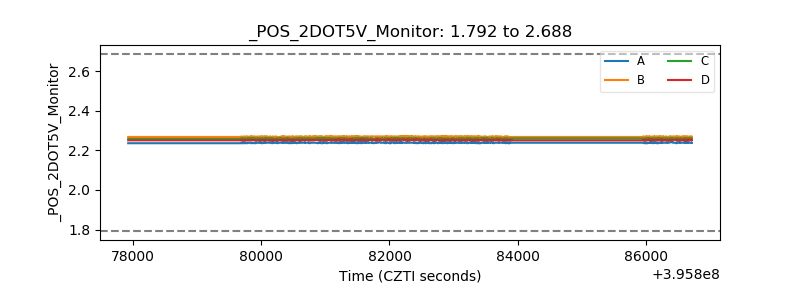 |
| +5 Volts monitor | 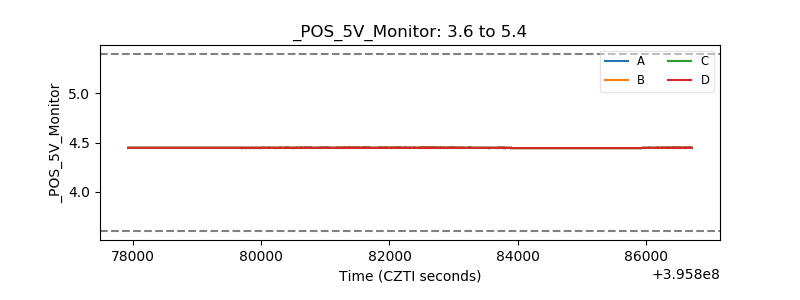 |
| _ROLL_ROT | 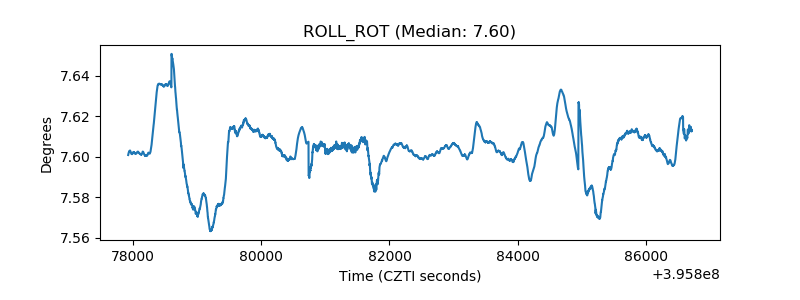 |
| _Roll_DEC | 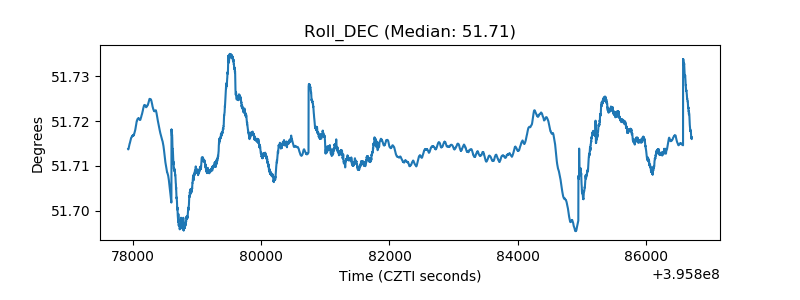 |
| _Roll_RA | 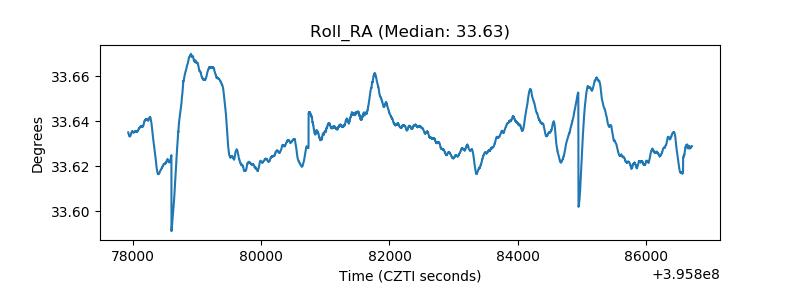 |
| Veto Counter | 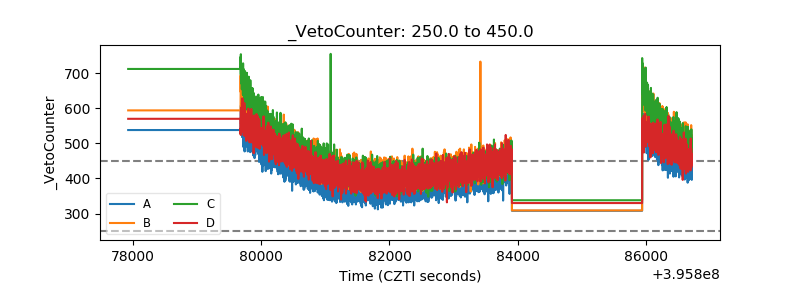 |