| Param | Original file | Final file |
|---|---|---|
| Filename | modeM0/AS1A11_075T01_9000005244_36797cztM0_level2.evt | modeM0/AS1A11_075T01_9000005244_36797cztM0_level2_quad_clean.evt |
| Size (bytes) | 517,158,720 | 80,023,680 |
| Size | 493.2 MB | 76.3 MB |
| Events in quadrant A | 2,497,327 | 543,035 |
| Events in quadrant B | 7,009,774 | 460,703 |
| Events in quadrant C | 2,804,727 | 555,510 |
| Events in quadrant D | 3,017,027 | 519,180 |
| Mode SS | |||
|---|---|---|---|
| Quadrant | BADHDUFLAG | Total packets | Discarded packets |
| A | 0 | 100 | 0 |
| B | 0 | 100 | 0 |
| C | 0 | 100 | 0 |
| D | 0 | 100 | 0 |
| Mode M0 | |||
|---|---|---|---|
| Quadrant | BADHDUFLAG | Total packets | Discarded packets |
| A | 0 | 10453 | 3 |
| B | 0 | 24102 | 2 |
| C | 0 | 11256 | 2 |
| D | 0 | 12272 | 2 |
| Mode M9 | |||
|---|---|---|---|
| Quadrant | BADHDUFLAG | Total packets | Discarded packets |
| A | 0 | 37 | 0 |
| B | 0 | 37 | 0 |
| C | 0 | 37 | 0 |
| D | 0 | 38 | 0 |
| Quadrant | Total seconds | Saturated seconds | Saturation percentage |
|---|---|---|---|
| A | 4911 | 4 | 0.081450% |
| B | 4911 | 1885 | 38.383221% |
| C | 4911 | 35 | 0.712686% |
| D | 4911 | 97 | 1.975158% |
Noise dominated data is calculated using 1-second bins in cleaned event files. If a bin has >2000 counts, and if more than 50% of those come from <1% of pixels, then it is considered to be noise-dominated and hence unusable.
| Quadrant | # 1 sec bins | Bins with >0 counts | Bins with >2000 counts | High rate bins dominated by noise | Noise dominated (total time) | Noise dominated (detector-on time) | Marked lightcurve |
|---|---|---|---|---|---|---|---|
| A | 7035 | 4912 | 2 | 2 | 0.03% | 0.04% | 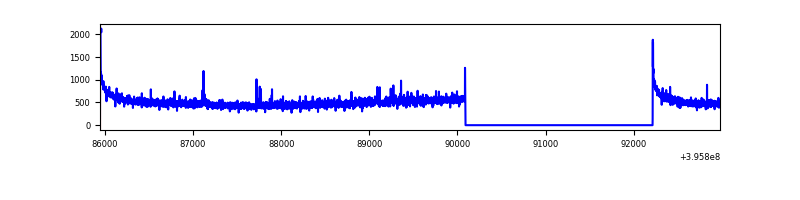 |
| B | 7035 | 4911 | 1774 | 1774 | 25.22% | 36.12% | 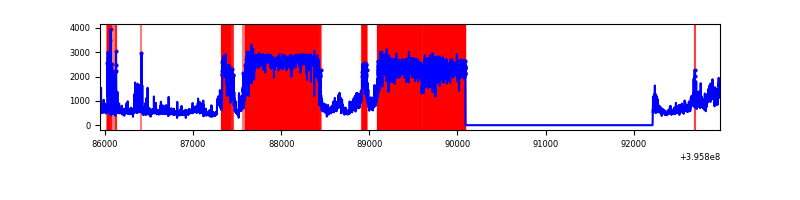 |
| C | 7035 | 4912 | 32 | 32 | 0.45% | 0.65% | 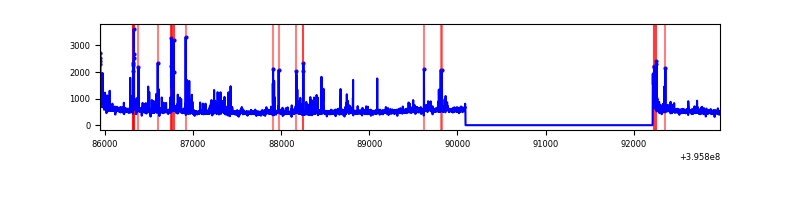 |
| D | 7035 | 4912 | 105 | 105 | 1.49% | 2.14% | 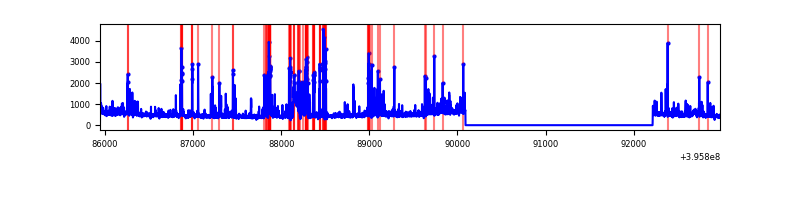 |
Top three noisy pixels from each quadrant. If the there are fewer than three noisy pixels in the level2.evt file, extra rows are filled as -1
| Pixel properties | Quadrant properties | ||||||
|---|---|---|---|---|---|---|---|
| Quadrant | DetID | PixID | Counts | Sigma | Mean | Median | Sigma |
| A | 10 | 83 | 209778 | 1809.55 | 574 | 563 | 115.6 |
| A | 15 | 223 | 48114 | 411.28 | 574 | 563 | 115.6 |
| A | 13 | 6 | 12242 | 101.01 | 574 | 563 | 115.6 |
| B | 12 | 1 | 4719764 | 53599.4 | 466 | 455 | 88.0 |
| B | 5 | 172 | 172323 | 1951.99 | 466 | 455 | 88.0 |
| B | 0 | 190 | 99013 | 1119.37 | 466 | 455 | 88.0 |
| C | 15 | 214 | 223678 | 1715.72 | 565 | 571 | 130.0 |
| C | 14 | 254 | 138207 | 1058.44 | 565 | 571 | 130.0 |
| C | 3 | 233 | 64987 | 495.37 | 565 | 571 | 130.0 |
| D | 13 | 249 | 538028 | 3984.89 | 554 | 538 | 134.9 |
| D | 2 | 153 | 86922 | 640.44 | 554 | 538 | 134.9 |
| D | 2 | 250 | 68508 | 503.92 | 554 | 538 | 134.9 |
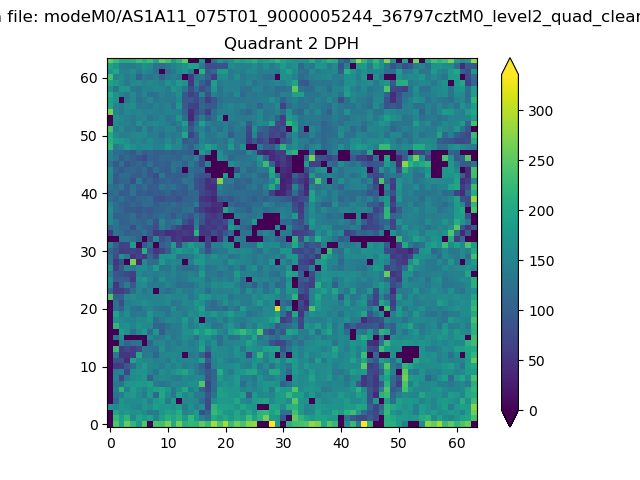
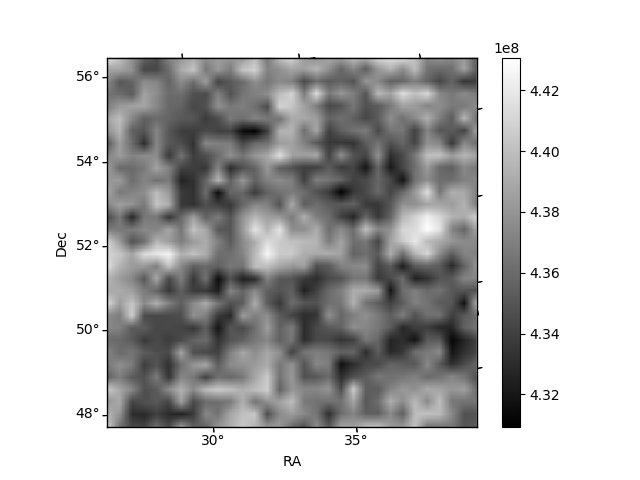
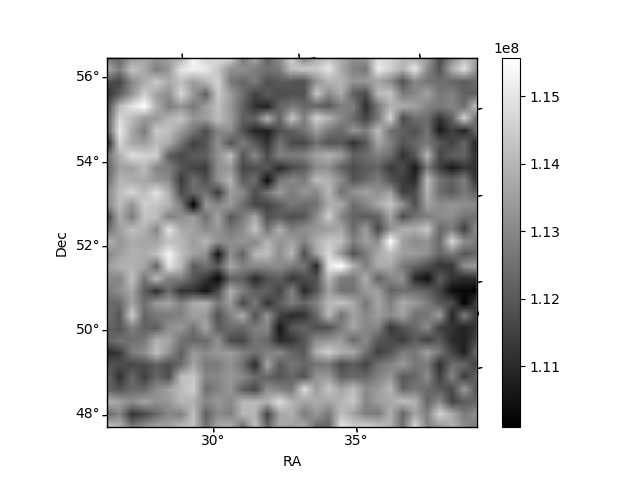
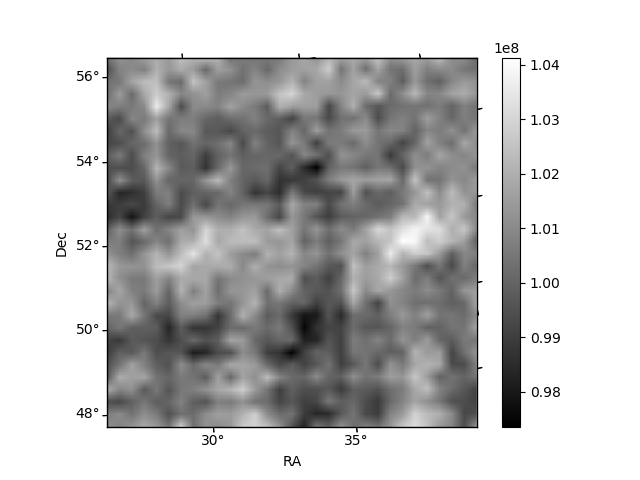
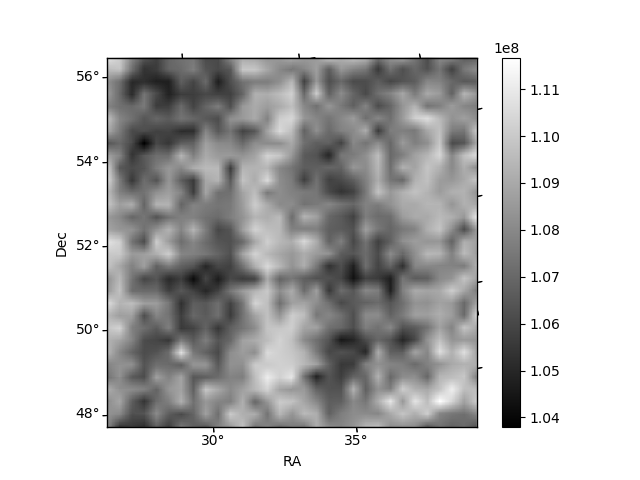
Histogram calculated using DETX and DETY for each event in the final _common_clean file
| Quadrant A | 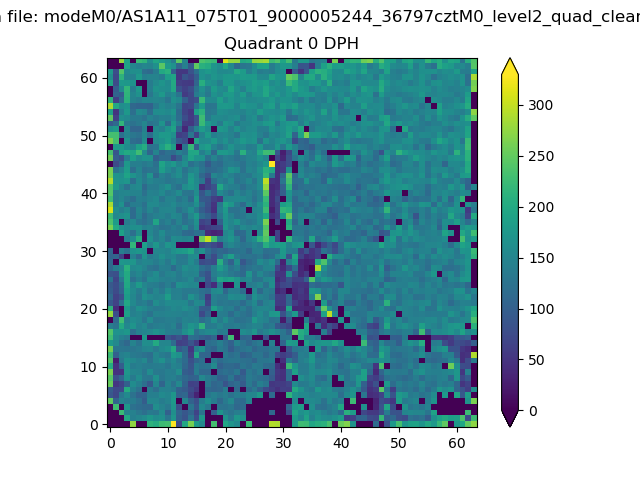 |
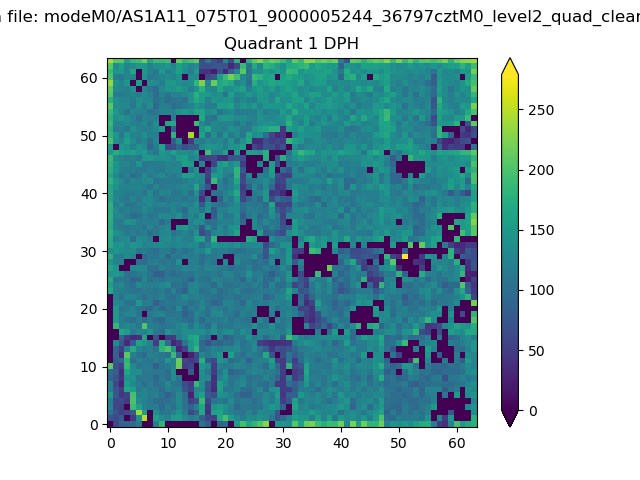 |
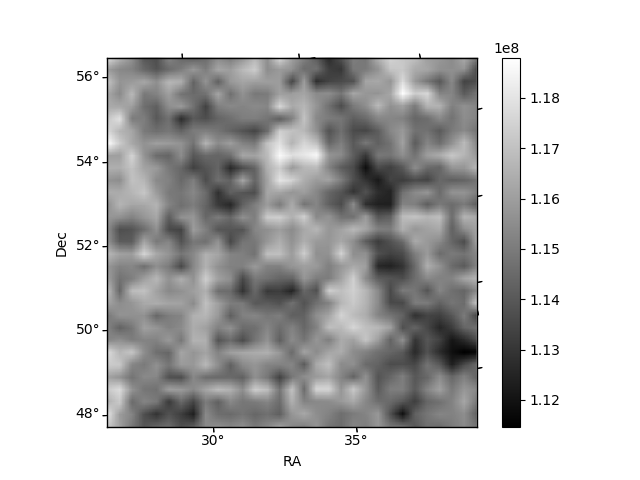
Quadrant B |
|---|---|---|---|
| Quadrant D | 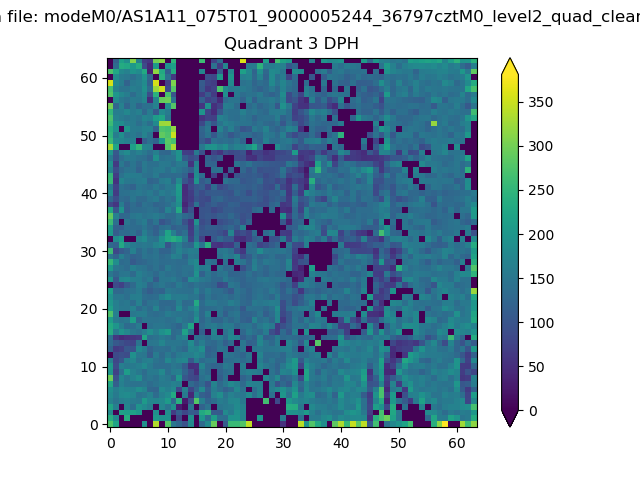 |
 |
Quadrant C |
| Plot type | Count rate plots | Images |
|---|---|---|
| Comparison with Poisson distribution Blue bars denote a histogram of data divided into 1 sec bins. Red curve is a Poisson curve with rate = median count rate of data. |
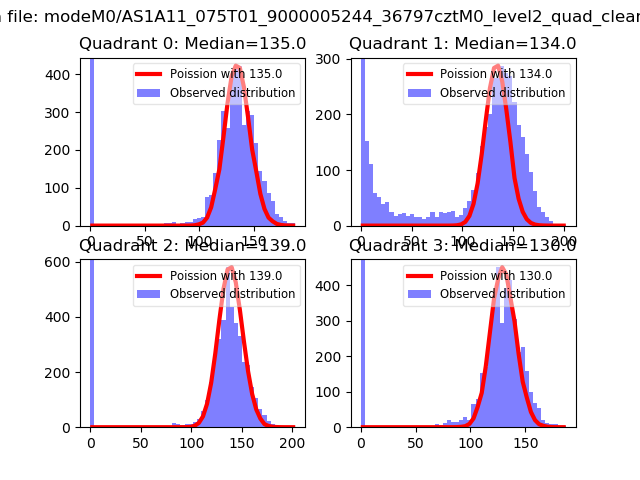 |
 |
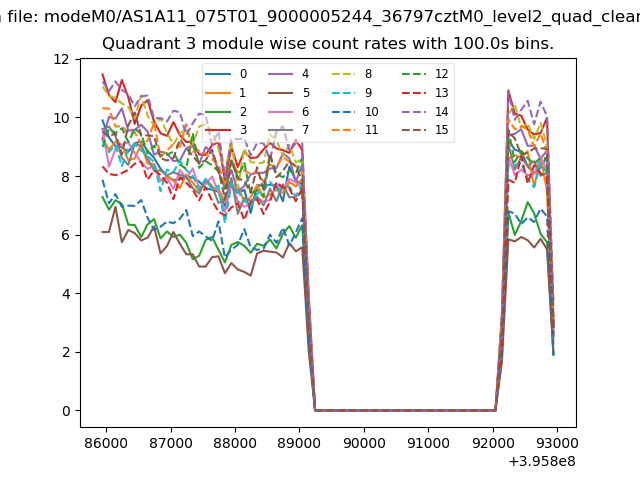
| Quadrant-wise count rates Data is divided into 100 sec bins |
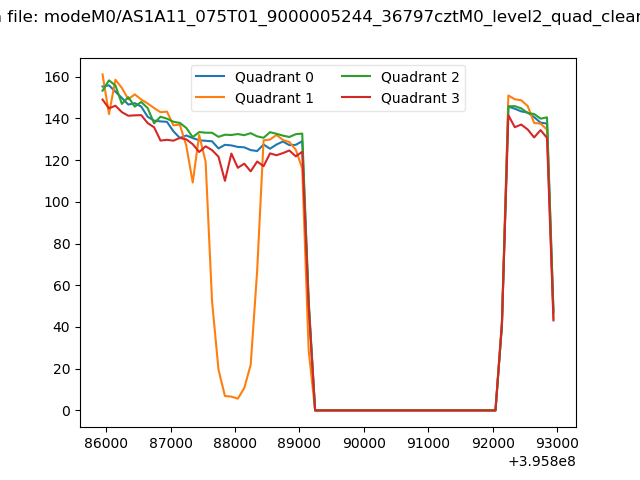 |
|
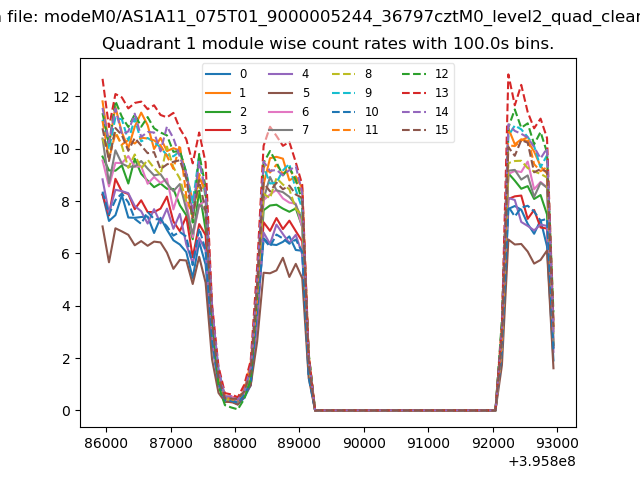
| Module-wise count rates for Quadrant A Data is divided into 100 sec bins |
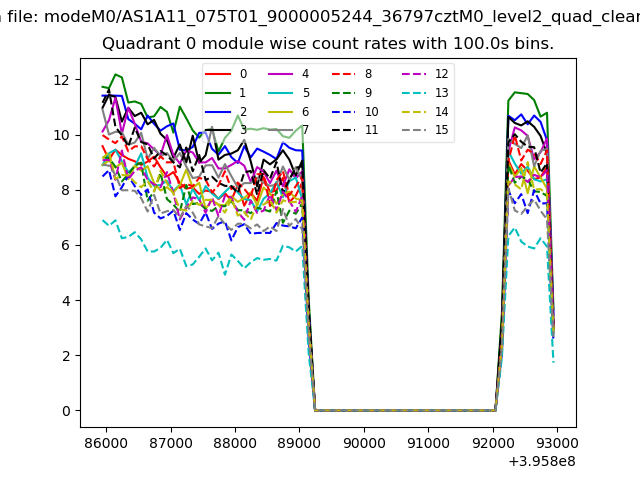 |
 |
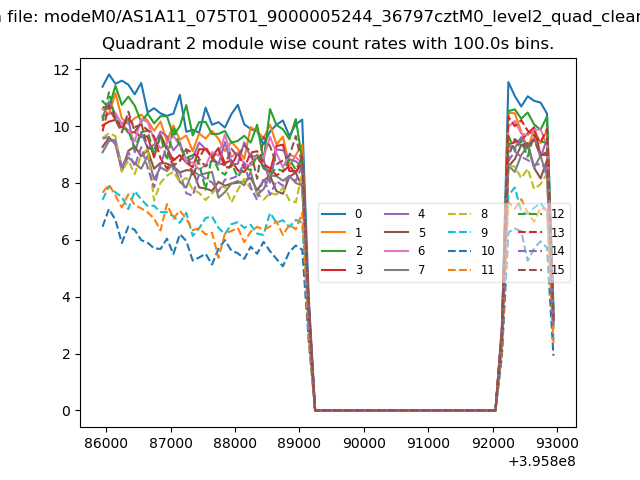
| Module-wise count rates for Quadrant B Data is divided into 100 sec bins |
 |
 |
| Module-wise count rates for Quadrant C Data is divided into 100 sec bins |
 |
 |
| Module-wise count rates for Quadrant D Data is divided into 100 sec bins |
 |
 |
| Parameter | Plot |
|---|---|
| CZT HV Monitor | 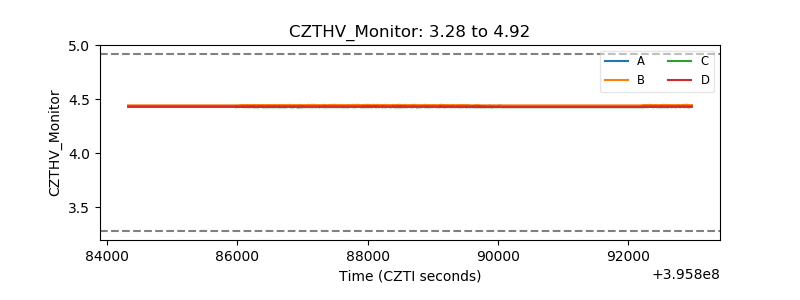 |
| D_VDD | 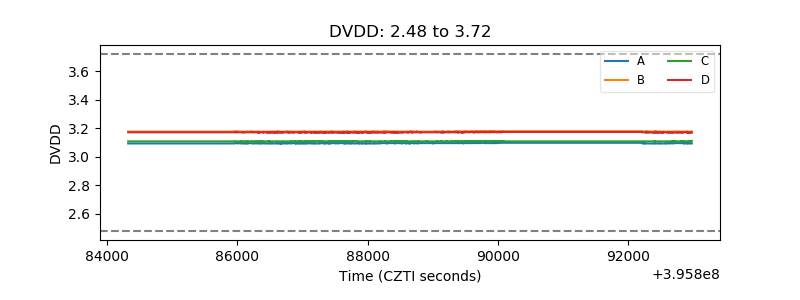 |
| Temperature 1 | 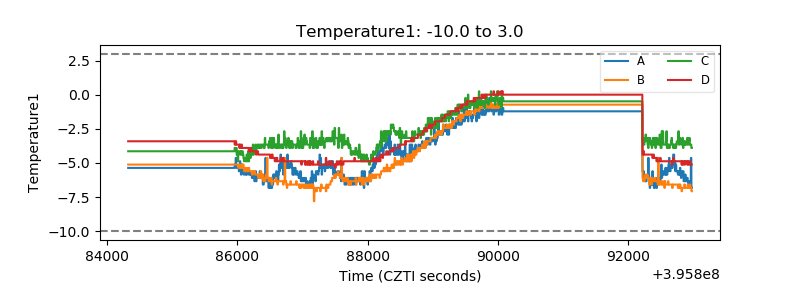 |
| Veto HV Monitor | 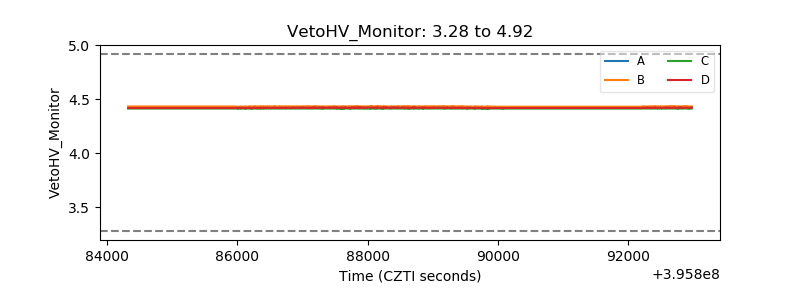 |
| Veto LLD | 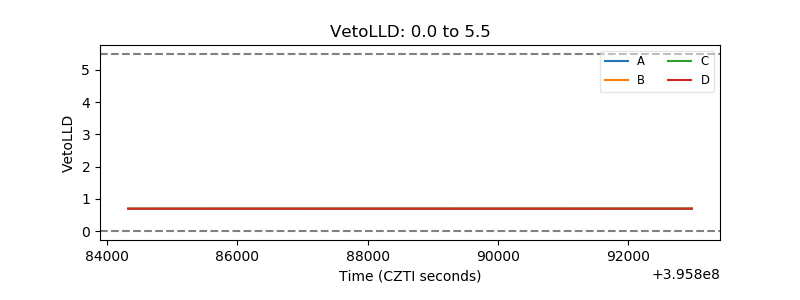 |
| Alpha Counter | 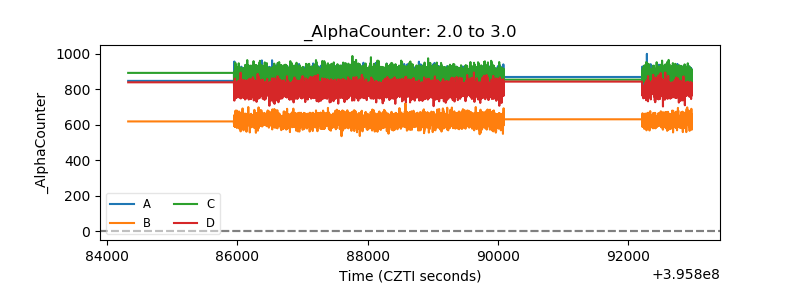 |
| _CPM_Rate | 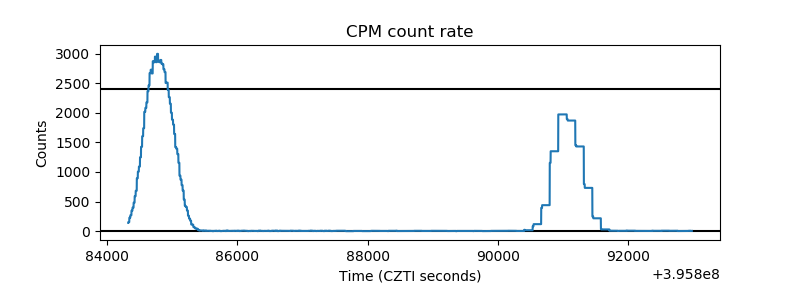 |
| CZT Counter | 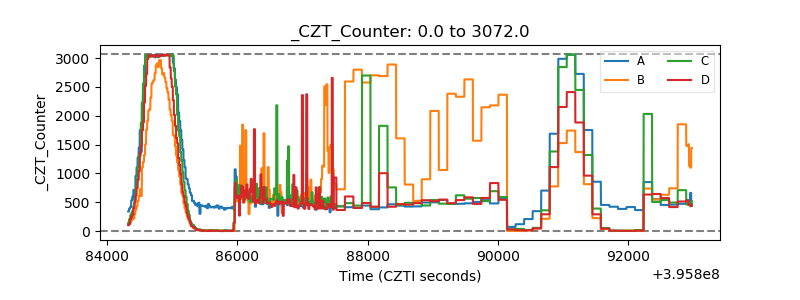 |
| +2.5 Volts monitor | 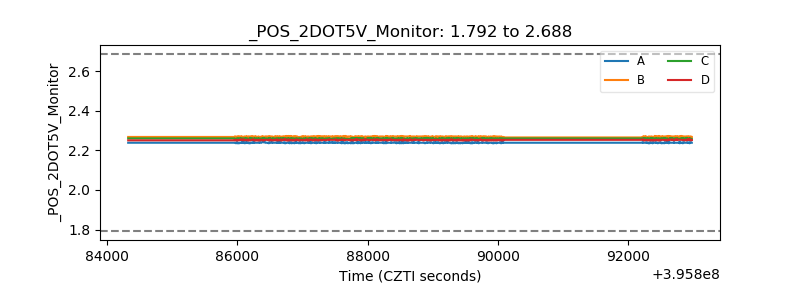 |
| +5 Volts monitor | 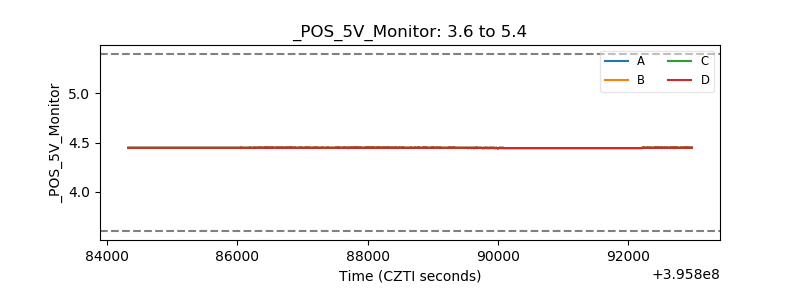 |
| _ROLL_ROT | 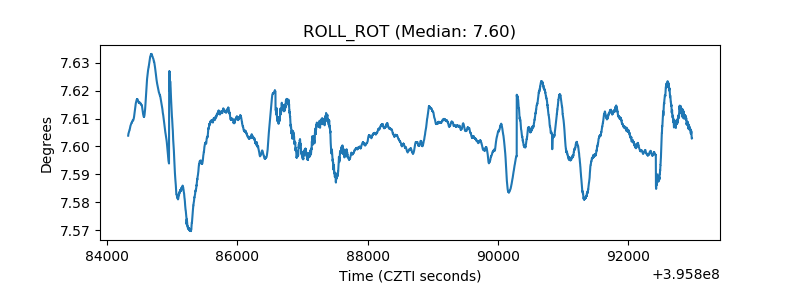 |
| _Roll_DEC | 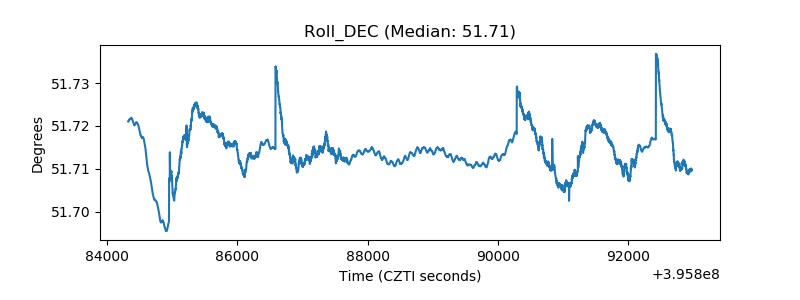 |
| _Roll_RA | 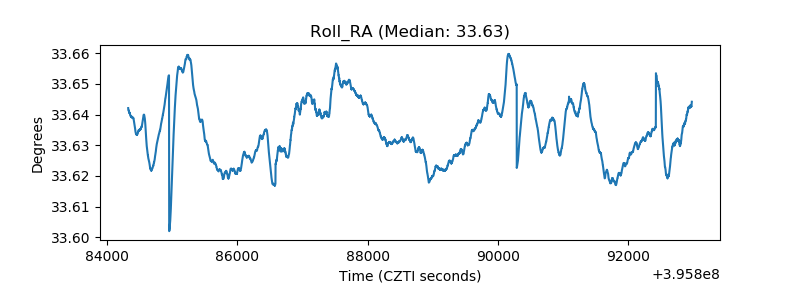 |
| Veto Counter | 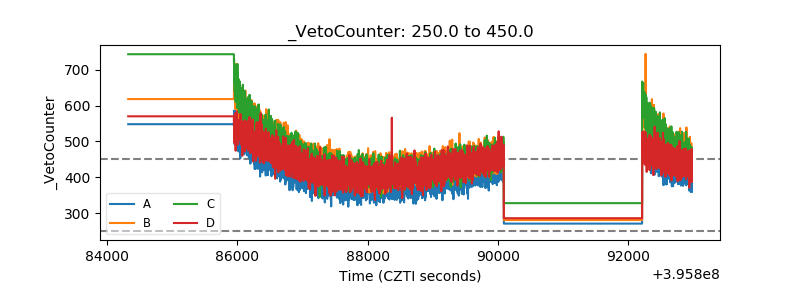 |