| Param | Original file | Final file |
|---|---|---|
| Filename | modeM0/AS1A11_075T01_9000005244_36798cztM0_level2.evt | modeM0/AS1A11_075T01_9000005244_36798cztM0_level2_quad_clean.evt |
| Size (bytes) | 574,888,320 | 72,002,880 |
| Size | 548.3 MB | 68.7 MB |
| Events in quadrant A | 2,437,689 | 468,903 |
| Events in quadrant B | 8,456,968 | 443,089 |
| Events in quadrant C | 3,015,203 | 477,854 |
| Events in quadrant D | 3,165,413 | 442,804 |
| Mode SS | |||
|---|---|---|---|
| Quadrant | BADHDUFLAG | Total packets | Discarded packets |
| A | 0 | 102 | 0 |
| B | 0 | 102 | 0 |
| C | 0 | 102 | 0 |
| D | 0 | 102 | 0 |
| Mode M0 | |||
|---|---|---|---|
| Quadrant | BADHDUFLAG | Total packets | Discarded packets |
| A | 0 | 10422 | 3 |
| B | 0 | 28479 | 2 |
| C | 0 | 11964 | 2 |
| D | 0 | 12858 | 2 |
| Mode M9 | |||
|---|---|---|---|
| Quadrant | BADHDUFLAG | Total packets | Discarded packets |
| A | 0 | 29 | 0 |
| B | 0 | 29 | 0 |
| C | 0 | 29 | 0 |
| D | 0 | 30 | 0 |
| Quadrant | Total seconds | Saturated seconds | Saturation percentage |
|---|---|---|---|
| A | 4948 | 10 | 0.202102% |
| B | 4948 | 2068 | 41.794665% |
| C | 4948 | 79 | 1.596605% |
| D | 4948 | 139 | 2.809216% |
Noise dominated data is calculated using 1-second bins in cleaned event files. If a bin has >2000 counts, and if more than 50% of those come from <1% of pixels, then it is considered to be noise-dominated and hence unusable.
| Quadrant | # 1 sec bins | Bins with >0 counts | Bins with >2000 counts | High rate bins dominated by noise | Noise dominated (total time) | Noise dominated (detector-on time) | Marked lightcurve |
|---|---|---|---|---|---|---|---|
| A | 7071 | 4949 | 4 | 4 | 0.06% | 0.08% | 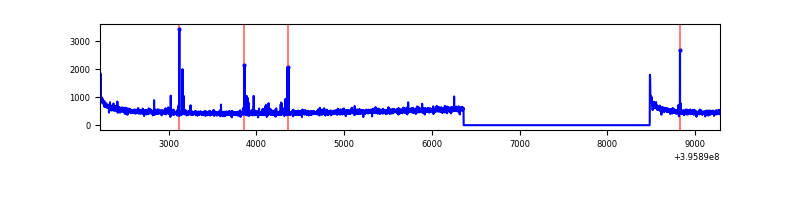 |
| B | 7071 | 4948 | 2038 | 2038 | 28.82% | 41.19% | 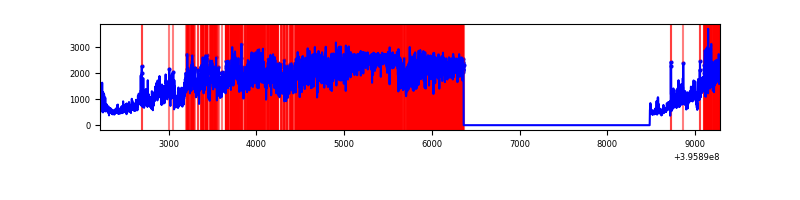 |
| C | 7071 | 4949 | 66 | 66 | 0.93% | 1.33% | 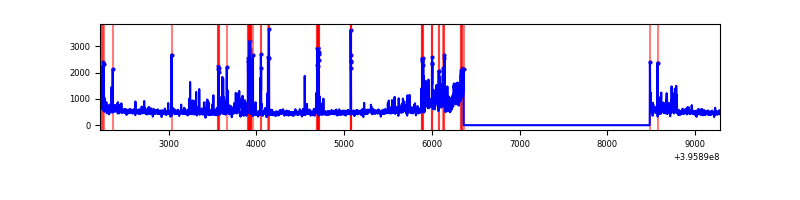 |
| D | 7071 | 4949 | 152 | 152 | 2.15% | 3.07% | 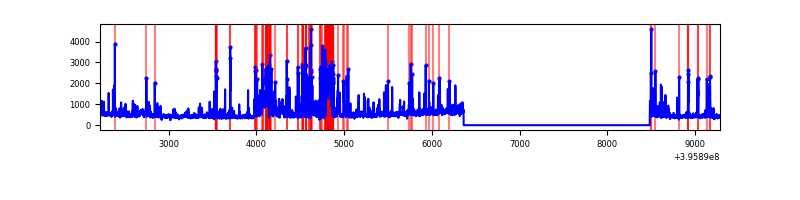 |
Top three noisy pixels from each quadrant. If the there are fewer than three noisy pixels in the level2.evt file, extra rows are filled as -1
| Pixel properties | Quadrant properties | ||||||
|---|---|---|---|---|---|---|---|
| Quadrant | DetID | PixID | Counts | Sigma | Mean | Median | Sigma |
| A | 10 | 83 | 206253 | 1817.2 | 563 | 553 | 113.2 |
| A | 9 | 143 | 38899 | 338.76 | 563 | 553 | 113.2 |
| A | 13 | 6 | 9382 | 78.0 | 563 | 553 | 113.2 |
| B | 12 | 1 | 6070908 | 65557.74 | 490 | 478 | 92.6 |
| B | 5 | 255 | 76936 | 825.71 | 490 | 478 | 92.6 |
| B | 0 | 190 | 69518 | 745.6 | 490 | 478 | 92.6 |
| C | 0 | 207 | 396181 | 3121.31 | 549 | 554 | 126.8 |
| C | 15 | 214 | 222429 | 1750.49 | 549 | 554 | 126.8 |
| C | 1 | 23 | 149247 | 1173.12 | 549 | 554 | 126.8 |
| D | 13 | 249 | 736276 | 5572.4 | 540 | 525 | 132.0 |
| D | 2 | 153 | 126563 | 954.58 | 540 | 525 | 132.0 |
| D | 2 | 249 | 54271 | 407.06 | 540 | 525 | 132.0 |
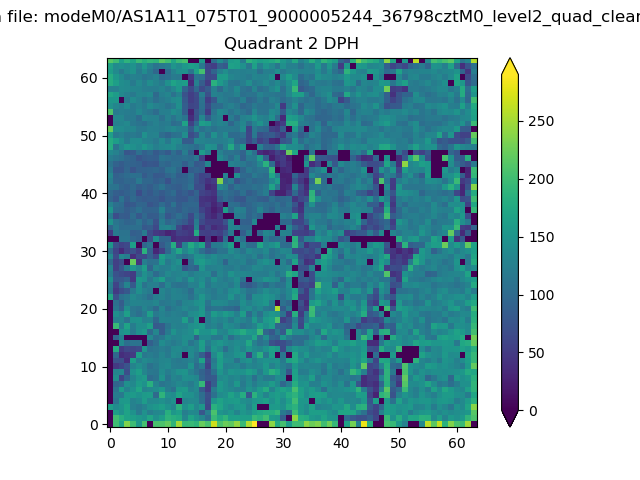
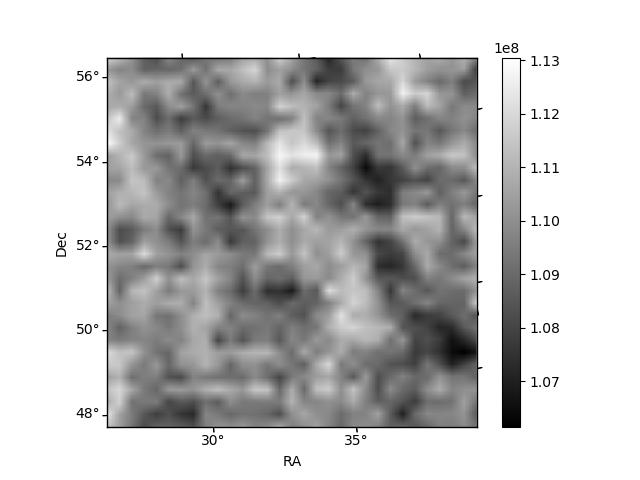
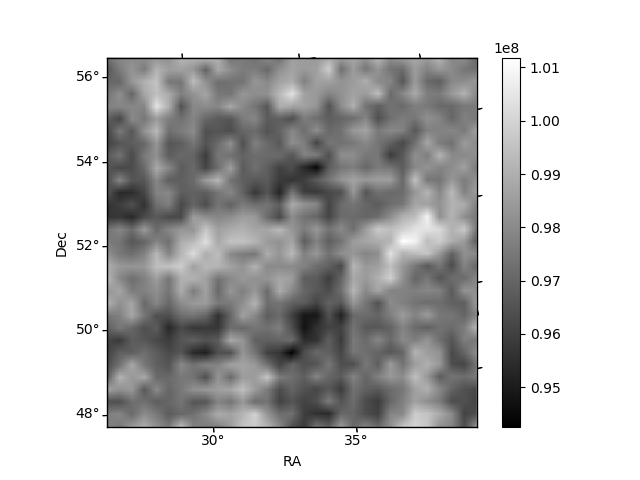
Histogram calculated using DETX and DETY for each event in the final _common_clean file
| Quadrant A | 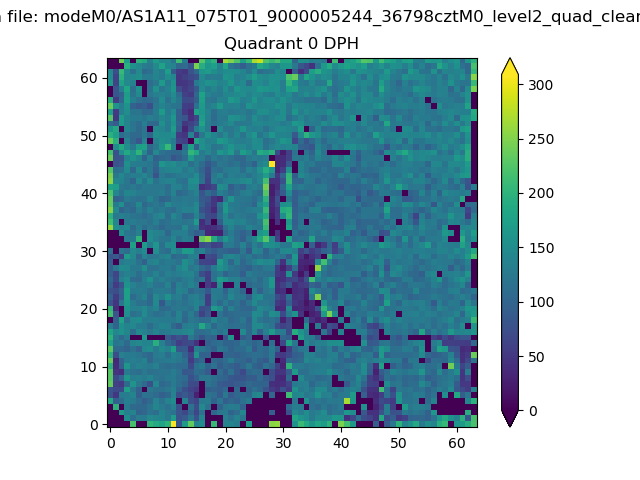 |
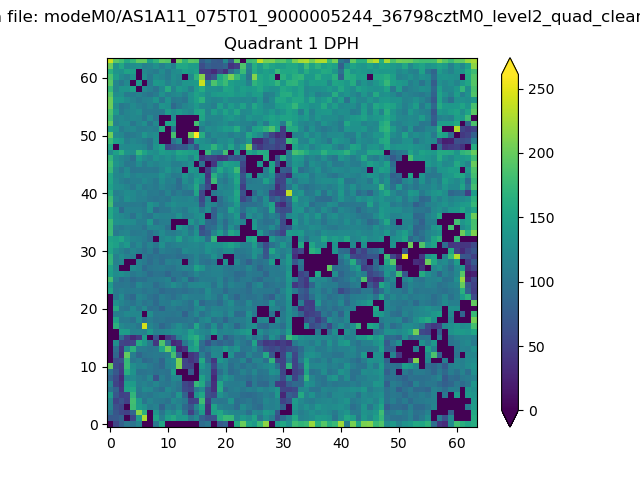 |
Quadrant B |
|---|---|---|---|
| Quadrant D | 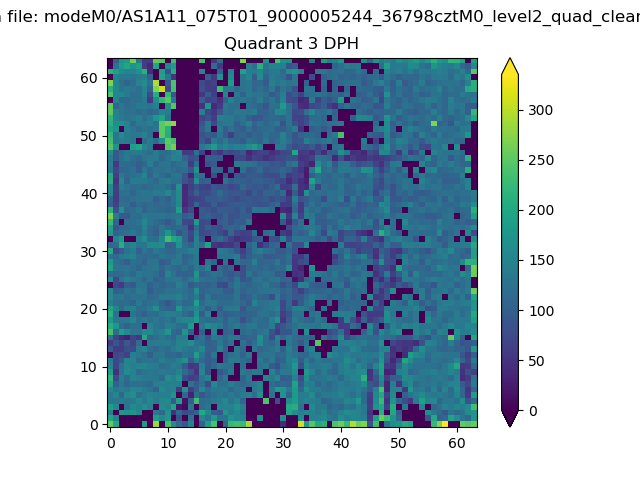 |
 |
Quadrant C |
| Plot type | Count rate plots | Images |
|---|---|---|
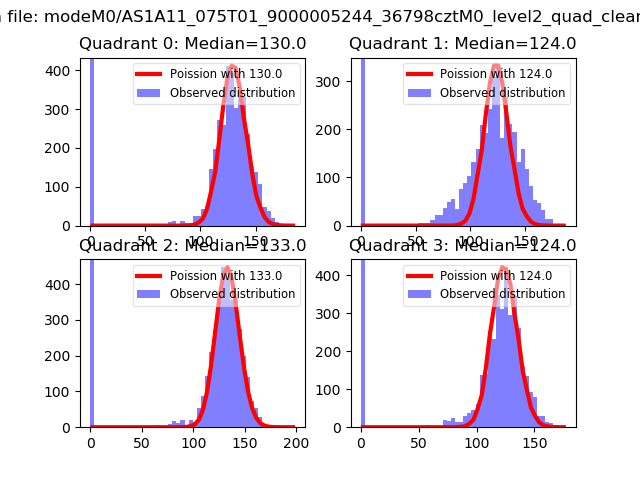
| Comparison with Poisson distribution Blue bars denote a histogram of data divided into 1 sec bins. Red curve is a Poisson curve with rate = median count rate of data. |
 |
 |
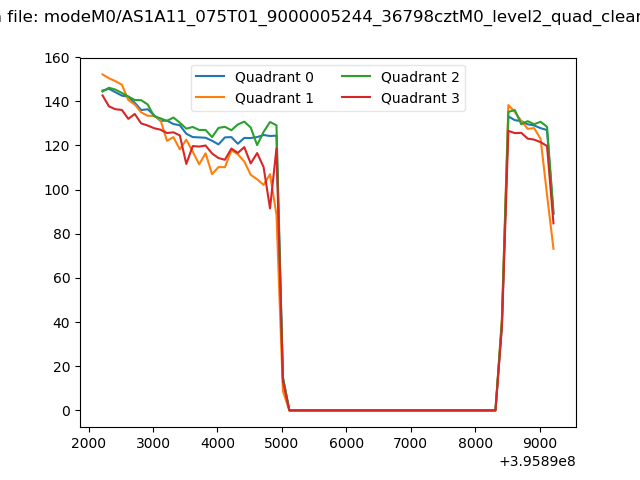
| Quadrant-wise count rates Data is divided into 100 sec bins |
 |
|
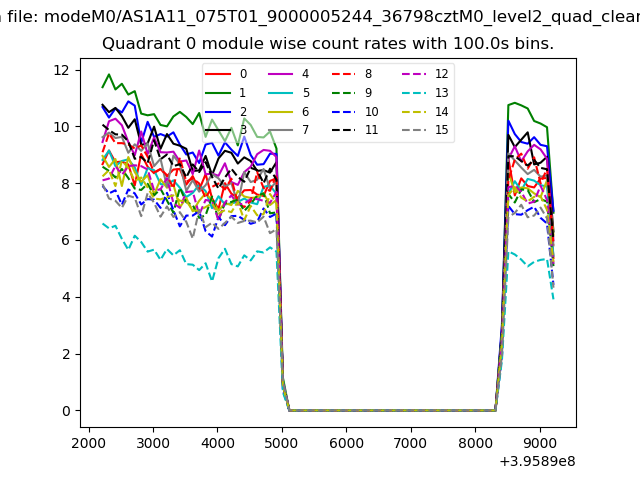
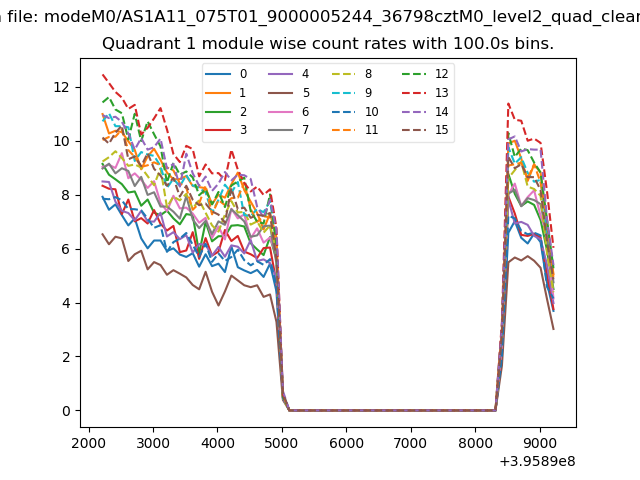
| Module-wise count rates for Quadrant A Data is divided into 100 sec bins |
 |
 |
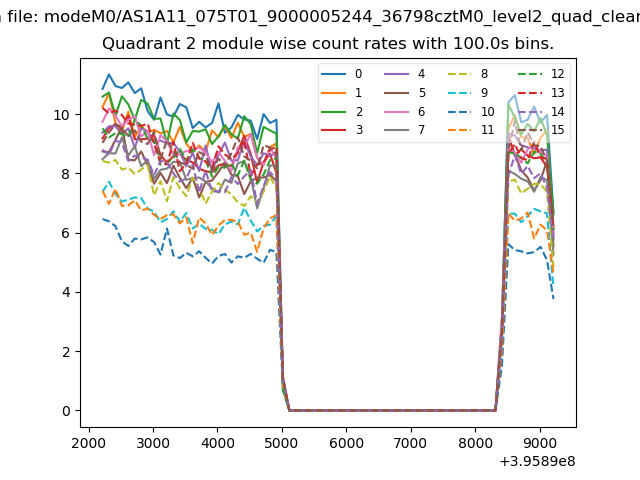
| Module-wise count rates for Quadrant B Data is divided into 100 sec bins |
 |
 |
| Module-wise count rates for Quadrant C Data is divided into 100 sec bins |
 |
 |
| Module-wise count rates for Quadrant D Data is divided into 100 sec bins |
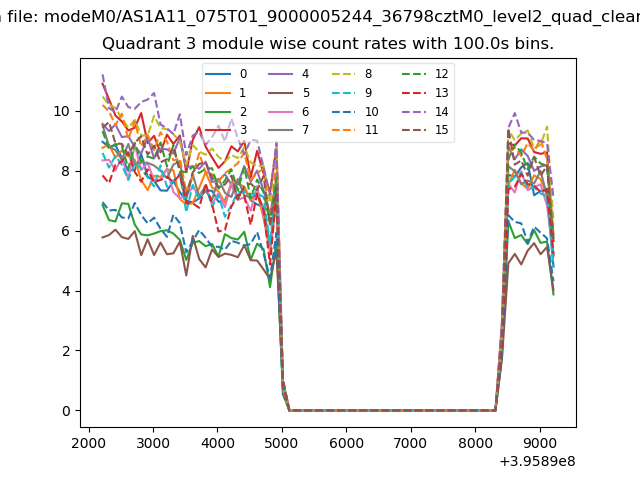 |
 |
| Parameter | Plot |
|---|---|
| CZT HV Monitor | 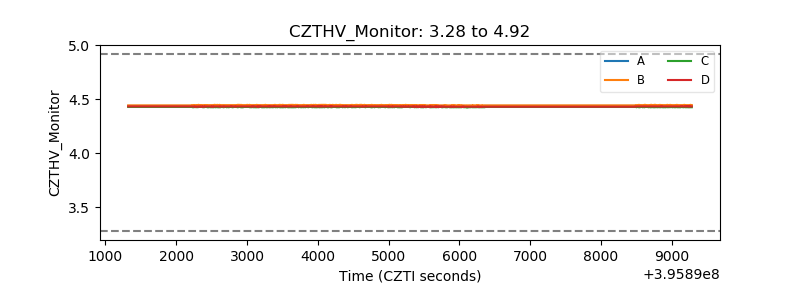 |
| D_VDD | 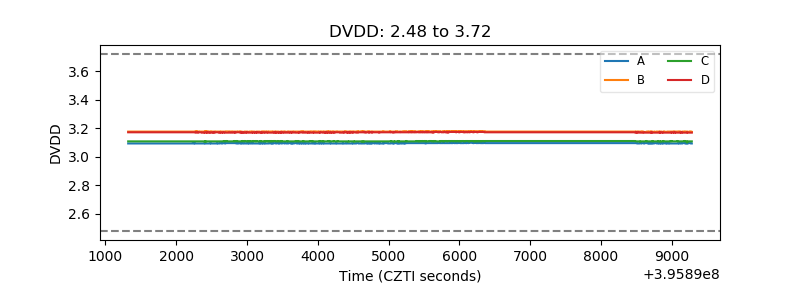 |
| Temperature 1 | 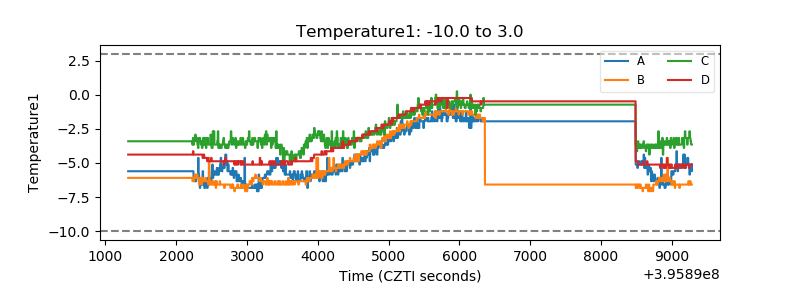 |
| Veto HV Monitor | 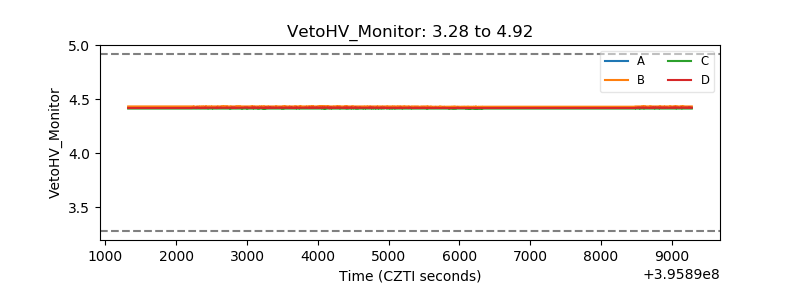 |
| Veto LLD | 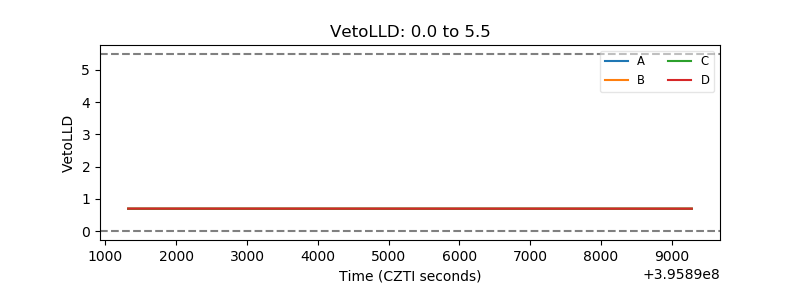 |
| Alpha Counter | 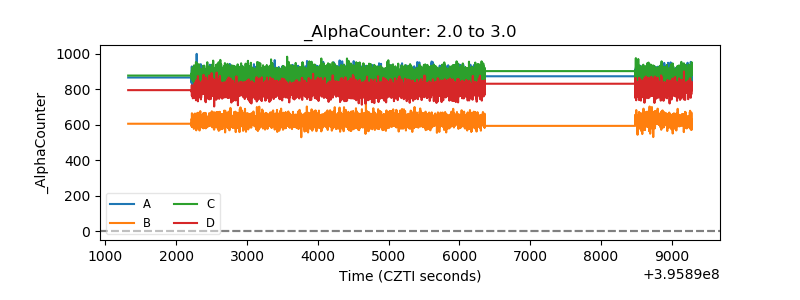 |
| _CPM_Rate | 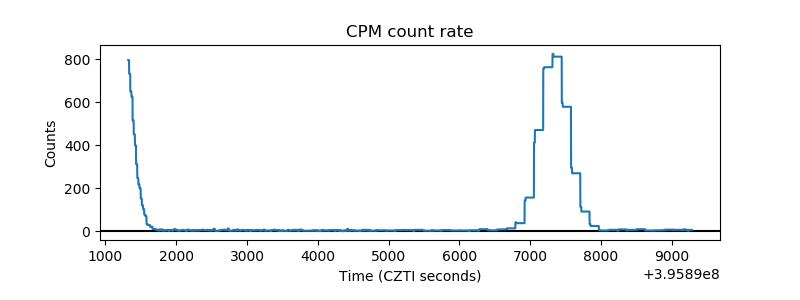 |
| CZT Counter | 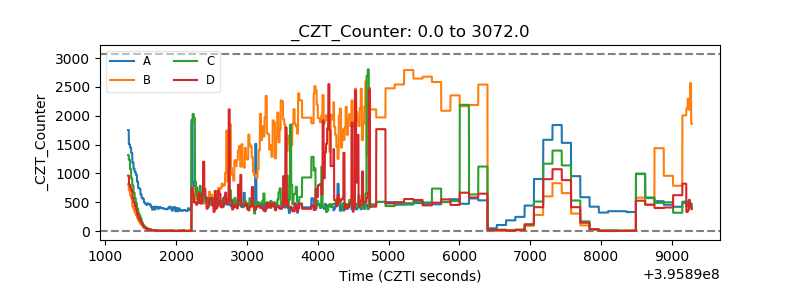 |
| +2.5 Volts monitor | 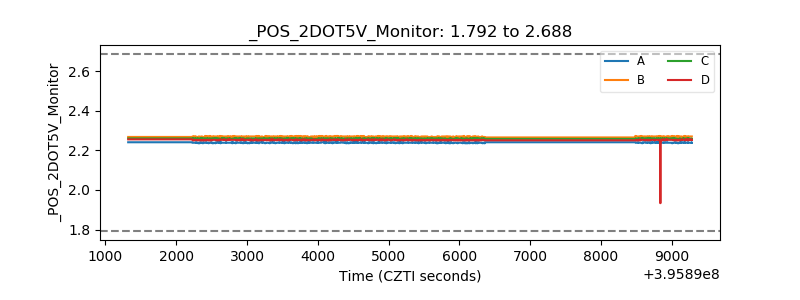 |
| +5 Volts monitor |  |
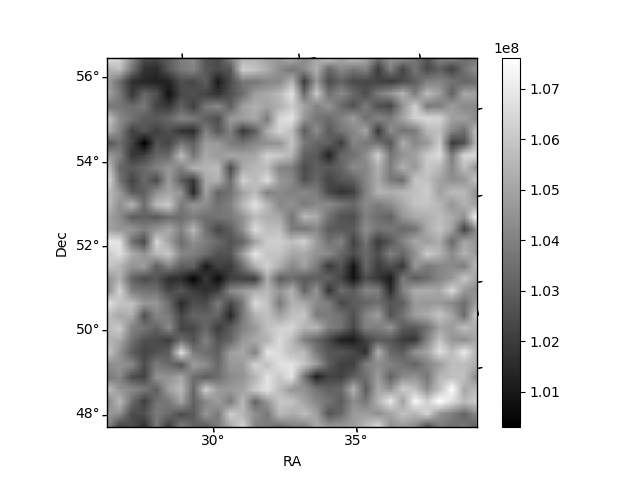
| _ROLL_ROT |  |
| _Roll_DEC | 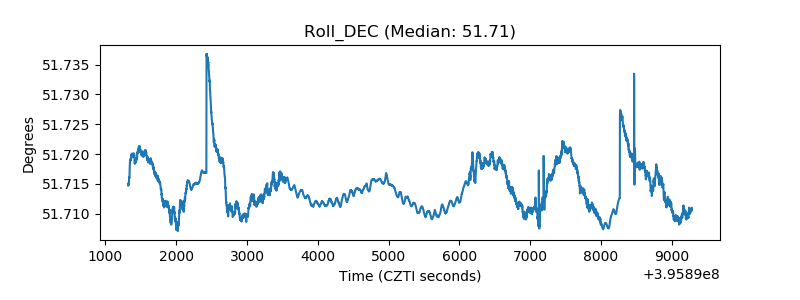 |
| _Roll_RA |  |
| Veto Counter | 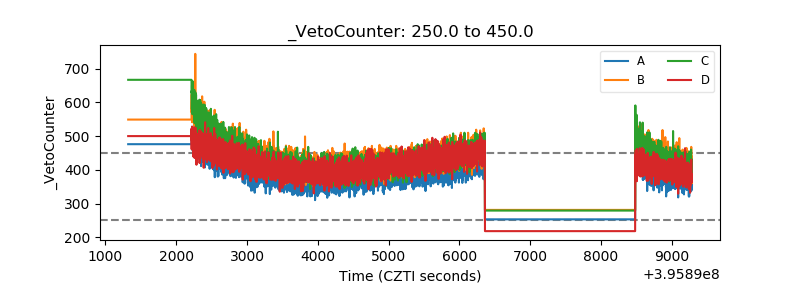 |