| Param | Original file | Final file |
|---|---|---|
| Filename | modeM0/AS1A11_075T01_9000005244_36799cztM0_level2.evt | modeM0/AS1A11_075T01_9000005244_36799cztM0_level2_quad_clean.evt |
| Size (bytes) | 232,459,200 | 34,862,400 |
| Size | 221.7 MB | 33.2 MB |
| Events in quadrant A | 888,525 | 245,541 |
| Events in quadrant B | 3,656,059 | 192,708 |
| Events in quadrant C | 1,166,808 | 246,890 |
| Events in quadrant D | 1,193,414 | 227,029 |
| Mode SS | |||
|---|---|---|---|
| Quadrant | BADHDUFLAG | Total packets | Discarded packets |
| A | 0 | 46 | 6 |
| B | 0 | 46 | 4 |
| C | 0 | 46 | 10 |
| D | 0 | 46 | 10 |
| Mode M0 | |||
|---|---|---|---|
| Quadrant | BADHDUFLAG | Total packets | Discarded packets |
| A | 0 | 4733 | 668 |
| B | 0 | 14468 | 2325 |
| C | 0 | 5587 | 854 |
| D | 0 | 5810 | 748 |
| Quadrant | Total seconds | Saturated seconds | Saturation percentage |
|---|---|---|---|
| A | 1993 | 2 | 0.100351% |
| B | 1903 | 1117 | 58.696795% |
| C | 1973 | 20 | 1.013685% |
| D | 1975 | 119 | 6.025316% |
Noise dominated data is calculated using 1-second bins in cleaned event files. If a bin has >2000 counts, and if more than 50% of those come from <1% of pixels, then it is considered to be noise-dominated and hence unusable.
| Quadrant | # 1 sec bins | Bins with >0 counts | Bins with >2000 counts | High rate bins dominated by noise | Noise dominated (total time) | Noise dominated (detector-on time) | Marked lightcurve |
|---|---|---|---|---|---|---|---|
| A | 2175 | 2080 | 2 | 2 | 0.09% | 0.10% | 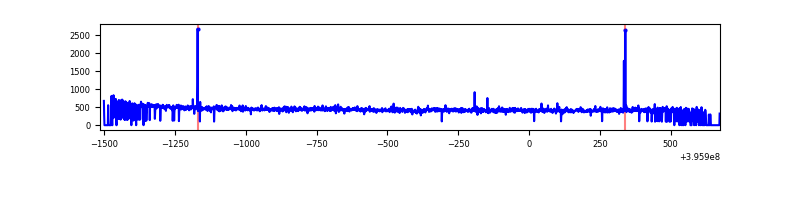 |
| B | 2117 | 1990 | 1093 | 1093 | 51.63% | 54.92% | 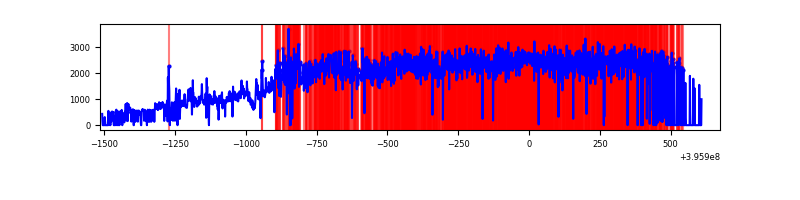 |
| C | 2169 | 2055 | 25 | 25 | 1.15% | 1.22% | 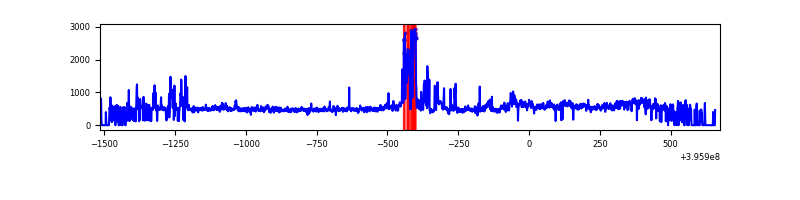 |
| D | 2145 | 2056 | 116 | 116 | 5.41% | 5.64% | 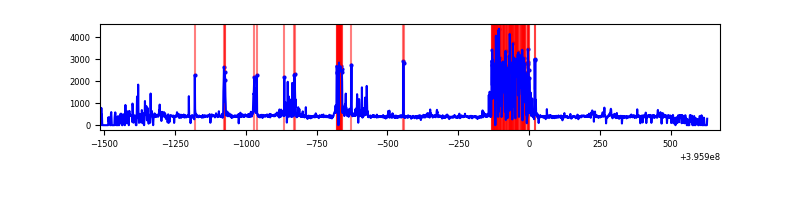 |
Top three noisy pixels from each quadrant. If the there are fewer than three noisy pixels in the level2.evt file, extra rows are filled as -1
| Pixel properties | Quadrant properties | ||||||
|---|---|---|---|---|---|---|---|
| Quadrant | DetID | PixID | Counts | Sigma | Mean | Median | Sigma |
| A | 10 | 83 | 67535 | 1549.56 | 209 | 205 | 43.5 |
| A | 9 | 143 | 6800 | 151.78 | 209 | 205 | 43.5 |
| A | 13 | 6 | 3677 | 79.91 | 209 | 205 | 43.5 |
| B | 12 | 1 | 2784605 | 80590.79 | 173 | 169 | 34.6 |
| B | 5 | 255 | 84847 | 2450.86 | 173 | 169 | 34.6 |
| B | 5 | 172 | 51258 | 1478.68 | 173 | 169 | 34.6 |
| C | 1 | 23 | 142867 | 2975.25 | 201 | 202 | 48.0 |
| C | 0 | 207 | 137538 | 2864.11 | 201 | 202 | 48.0 |
| C | 15 | 214 | 88310 | 1837.47 | 201 | 202 | 48.0 |
| D | 13 | 249 | 376817 | 7867.42 | 192 | 187 | 47.9 |
| D | 2 | 153 | 43099 | 896.39 | 192 | 187 | 47.9 |
| D | 2 | 250 | 13601 | 280.2 | 192 | 187 | 47.9 |
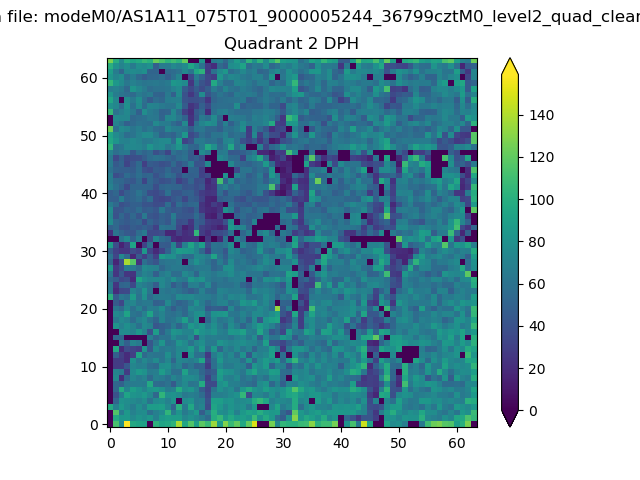
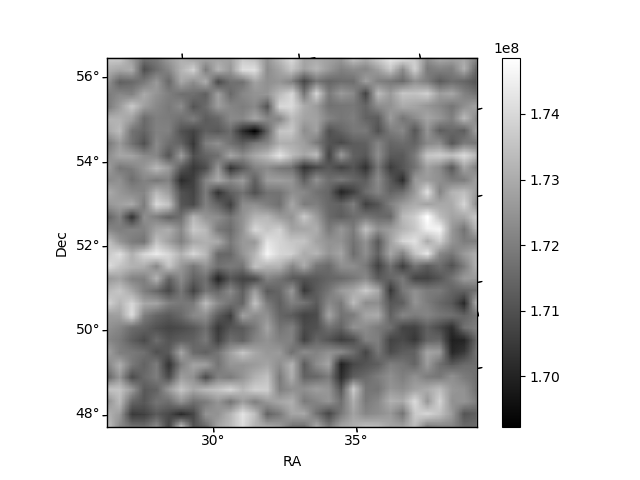
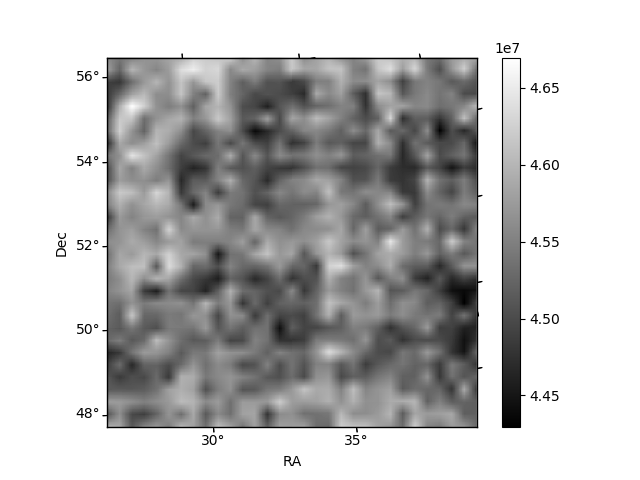
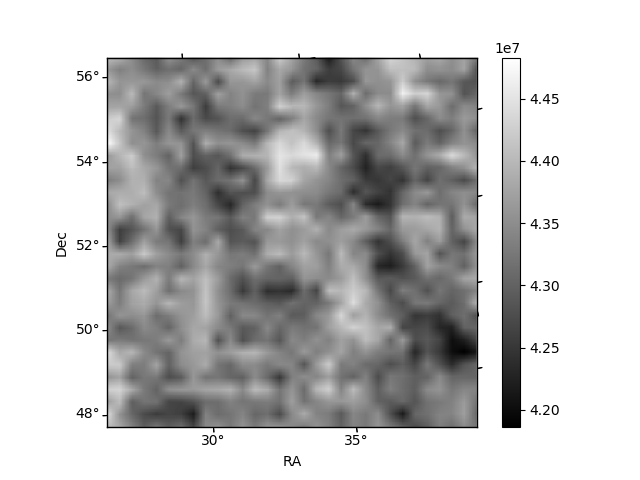
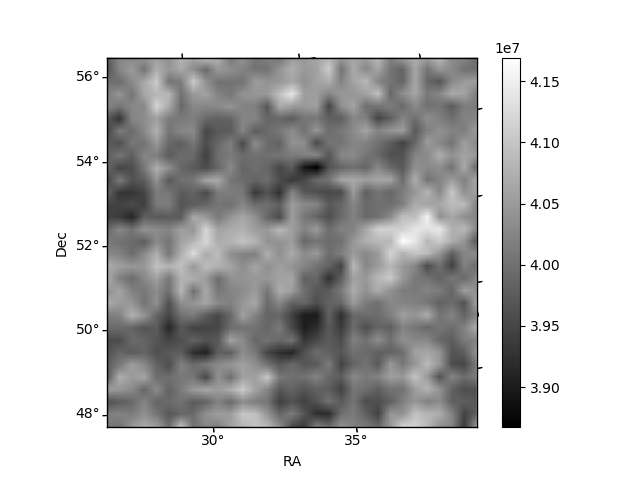
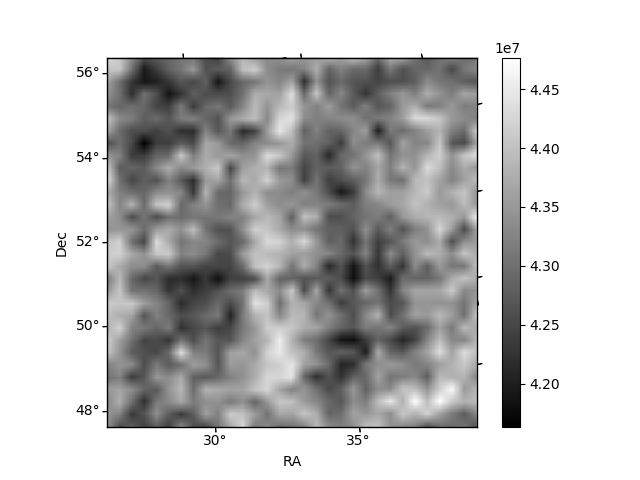
Histogram calculated using DETX and DETY for each event in the final _common_clean file
| Quadrant A | 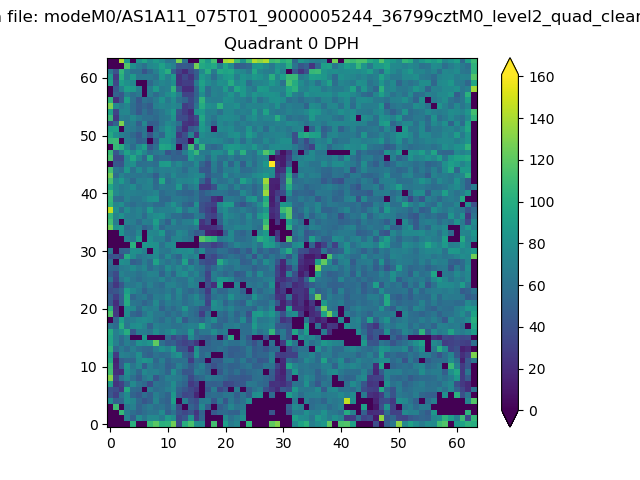 |
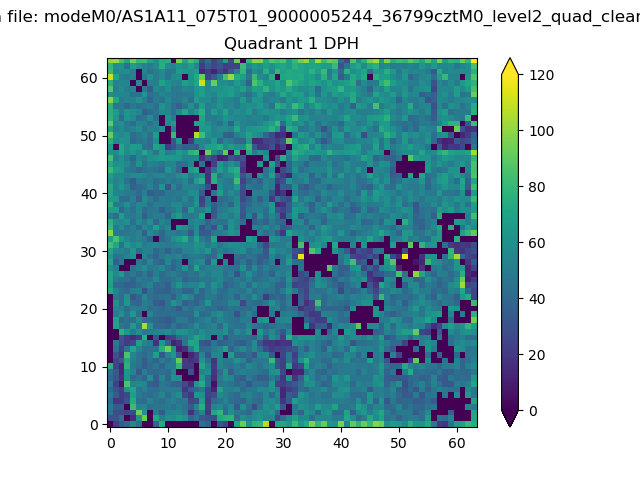 |
Quadrant B |
|---|---|---|---|
| Quadrant D | 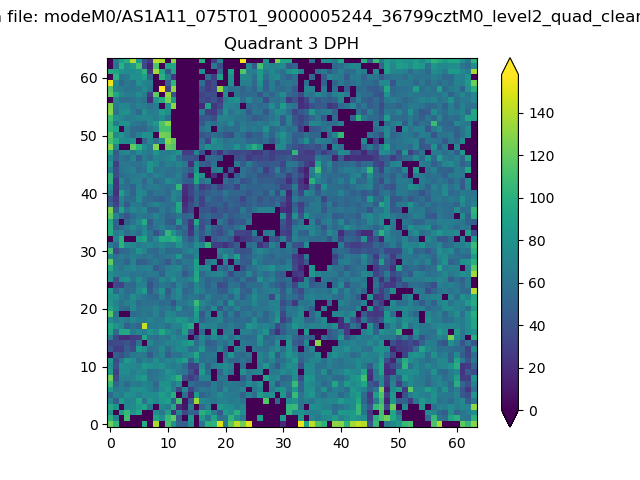 |
 |
Quadrant C |
| Plot type | Count rate plots | Images |
|---|---|---|
| Comparison with Poisson distribution Blue bars denote a histogram of data divided into 1 sec bins. Red curve is a Poisson curve with rate = median count rate of data. |
 |
 |
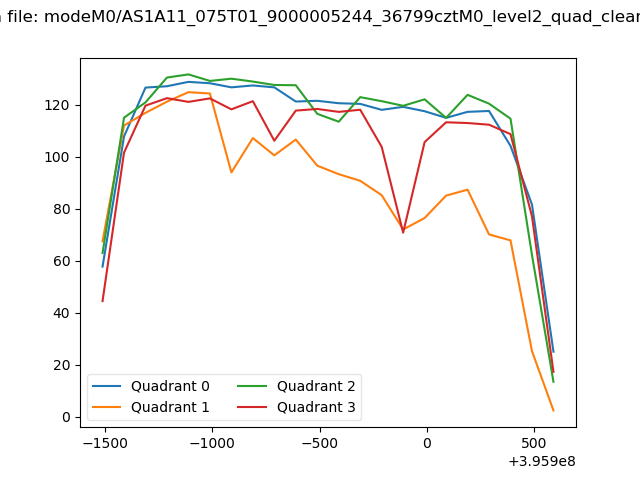
| Quadrant-wise count rates Data is divided into 100 sec bins |
 |
|
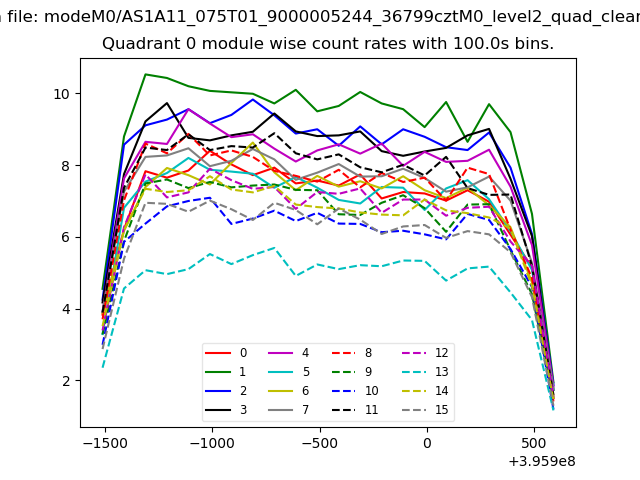
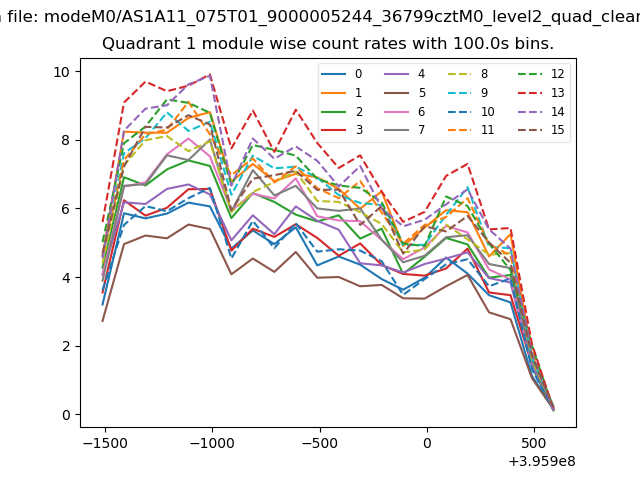
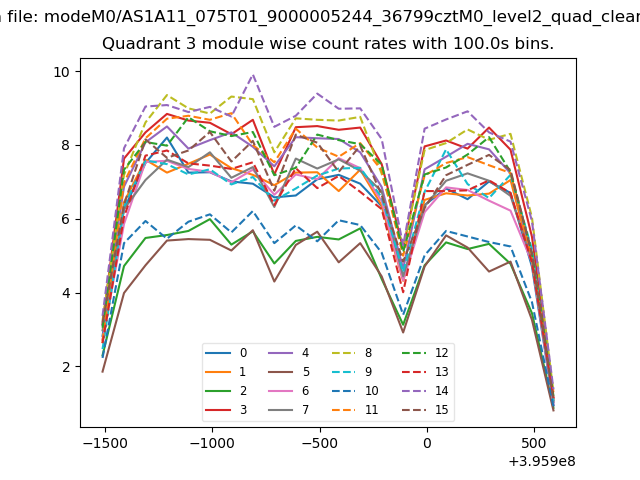
| Module-wise count rates for Quadrant A Data is divided into 100 sec bins |
 |
 |
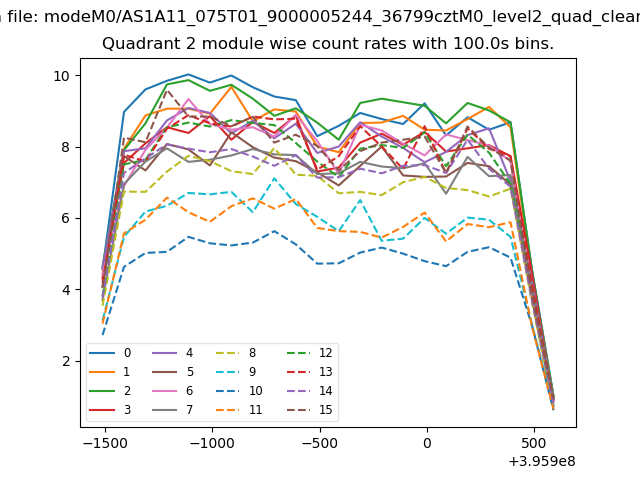
| Module-wise count rates for Quadrant B Data is divided into 100 sec bins |
 |
 |
| Module-wise count rates for Quadrant C Data is divided into 100 sec bins |
 |
 |
| Module-wise count rates for Quadrant D Data is divided into 100 sec bins |
 |
 |
| Parameter | Plot |
|---|---|
| CZT HV Monitor | 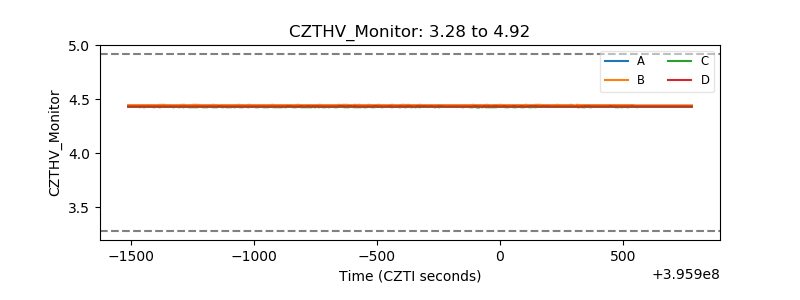 |
| D_VDD | 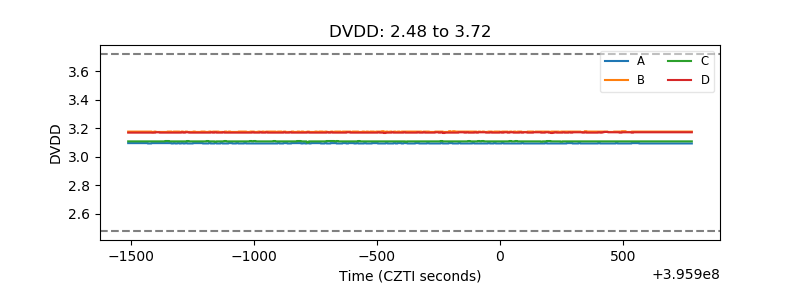 |
| Temperature 1 |  |
| Veto HV Monitor |  |
| Veto LLD | 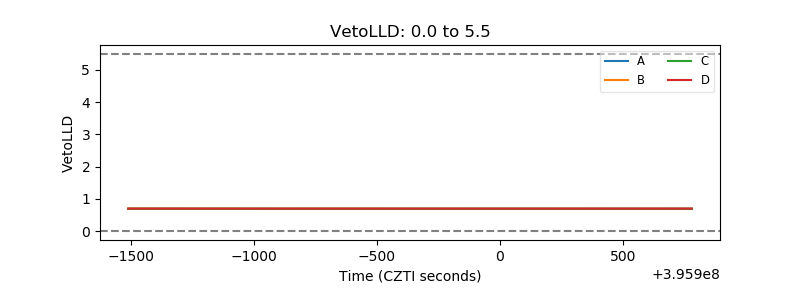 |
| Alpha Counter |  |
| _CPM_Rate | 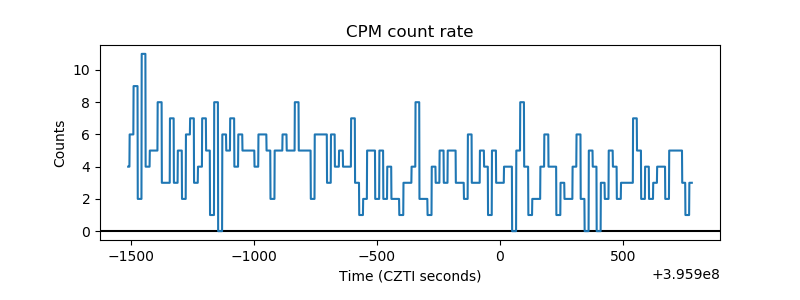 |
| CZT Counter |  |
| +2.5 Volts monitor |  |
| +5 Volts monitor |  |
| _ROLL_ROT | 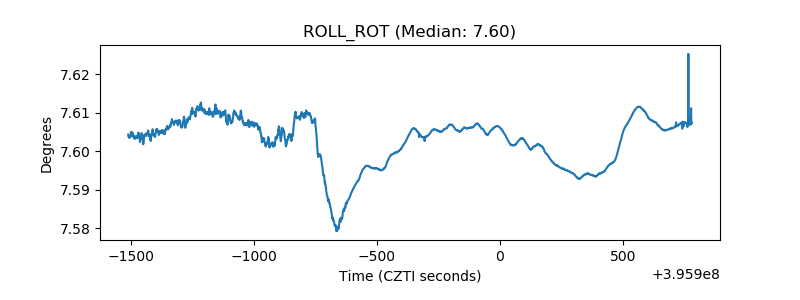 |
| _Roll_DEC | 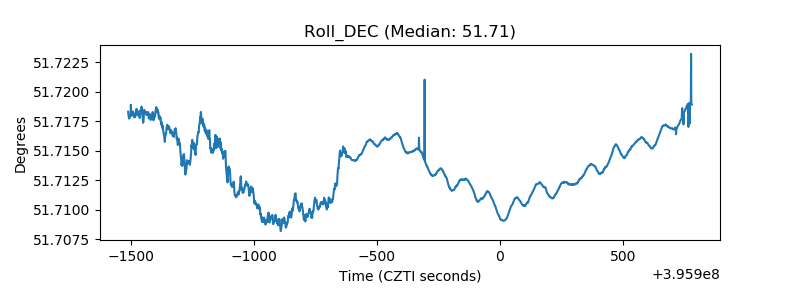 |
| _Roll_RA |  |
| Veto Counter | 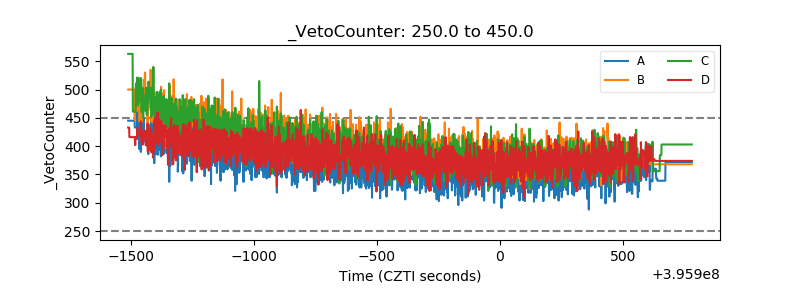 |