| Param | Original file | Final file |
|---|---|---|
| Filename | modeM0/AS1A11_075T01_9000005244_36801cztM0_level2.evt | modeM0/AS1A11_075T01_9000005244_36801cztM0_level2_quad_clean.evt |
| Size (bytes) | 1,949,584,320 | 158,261,760 |
| Size | 1.8 GB | 150.9 MB |
| Events in quadrant A | 6,917,097 | 1,048,855 |
| Events in quadrant B | 32,812,450 | 682,985 |
| Events in quadrant C | 9,285,200 | 1,059,195 |
| Events in quadrant D | 9,048,834 | 993,005 |
| Mode SS | |||
|---|---|---|---|
| Quadrant | BADHDUFLAG | Total packets | Discarded packets |
| A | 0 | 298 | 0 |
| B | 0 | 298 | 0 |
| C | 0 | 298 | 0 |
| D | 0 | 298 | 0 |
| Mode M0 | |||
|---|---|---|---|
| Quadrant | BADHDUFLAG | Total packets | Discarded packets |
| A | 0 | 29767 | 4 |
| B | 0 | 107440 | 3 |
| C | 0 | 36872 | 3 |
| D | 0 | 37510 | 11 |
| Mode M9 | |||
|---|---|---|---|
| Quadrant | BADHDUFLAG | Total packets | Discarded packets |
| A | 0 | 51 | 0 |
| B | 0 | 51 | 0 |
| C | 0 | 51 | 0 |
| D | 0 | 51 | 0 |
| Quadrant | Total seconds | Saturated seconds | Saturation percentage |
|---|---|---|---|
| A | 14570 | 17 | 0.116678% |
| B | 14570 | 11372 | 78.050789% |
| C | 14570 | 547 | 3.754290% |
| D | 14569 | 532 | 3.651589% |
Noise dominated data is calculated using 1-second bins in cleaned event files. If a bin has >2000 counts, and if more than 50% of those come from <1% of pixels, then it is considered to be noise-dominated and hence unusable.
| Quadrant | # 1 sec bins | Bins with >0 counts | Bins with >2000 counts | High rate bins dominated by noise | Noise dominated (total time) | Noise dominated (detector-on time) | Marked lightcurve |
|---|---|---|---|---|---|---|---|
| A | 19678 | 14573 | 3 | 3 | 0.02% | 0.02% | 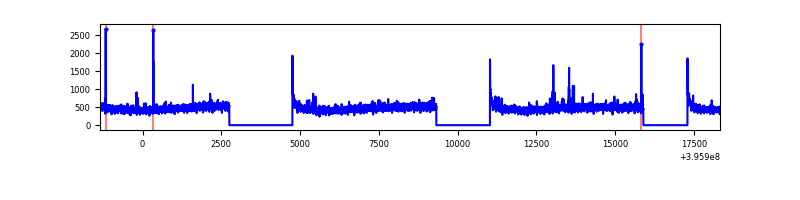 |
| B | 19677 | 14569 | 11053 | 11053 | 56.17% | 75.87% | 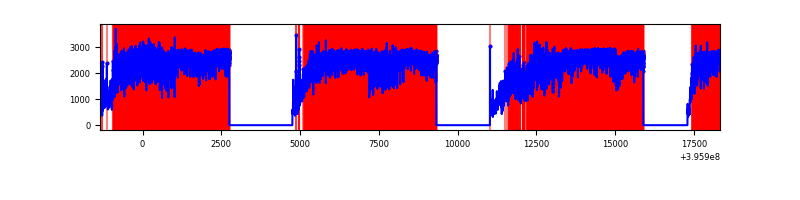 |
| C | 19678 | 14573 | 484 | 484 | 2.46% | 3.32% | 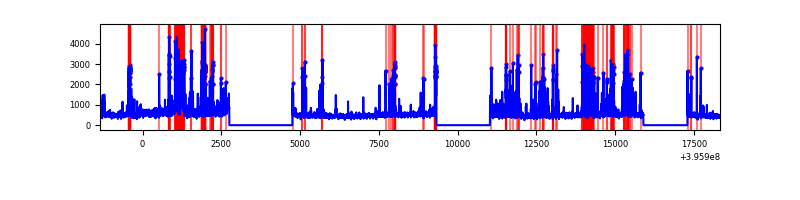 |
| D | 19677 | 14571 | 464 | 464 | 2.36% | 3.18% | 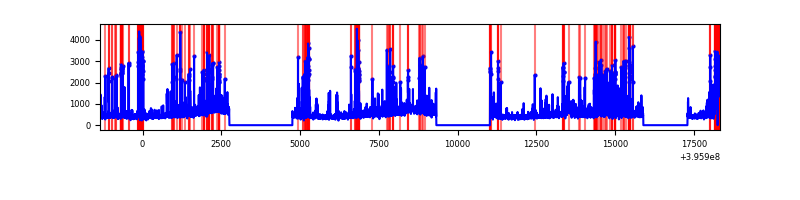 |
Top three noisy pixels from each quadrant. If the there are fewer than three noisy pixels in the level2.evt file, extra rows are filled as -1
| Pixel properties | Quadrant properties | ||||||
|---|---|---|---|---|---|---|---|
| Quadrant | DetID | PixID | Counts | Sigma | Mean | Median | Sigma |
| A | 10 | 83 | 508488 | 1551.21 | 1636 | 1603 | 326.8 |
| A | 10 | 255 | 28974 | 83.76 | 1636 | 1603 | 326.8 |
| A | 13 | 6 | 27915 | 80.52 | 1636 | 1603 | 326.8 |
| B | 12 | 1 | 27764300 | 150530.35 | 992 | 969 | 184.4 |
| B | 4 | 171 | 208208 | 1123.63 | 992 | 969 | 184.4 |
| B | 0 | 190 | 189111 | 1020.09 | 992 | 969 | 184.4 |
| C | 0 | 207 | 1510301 | 4243.91 | 1557 | 1568 | 355.5 |
| C | 1 | 23 | 935648 | 2627.47 | 1557 | 1568 | 355.5 |
| C | 15 | 214 | 616257 | 1729.05 | 1557 | 1568 | 355.5 |
| D | 13 | 249 | 1308476 | 3437.25 | 1569 | 1526 | 380.2 |
| D | 1 | 20 | 442549 | 1159.88 | 1569 | 1526 | 380.2 |
| D | 10 | 203 | 370107 | 969.36 | 1569 | 1526 | 380.2 |
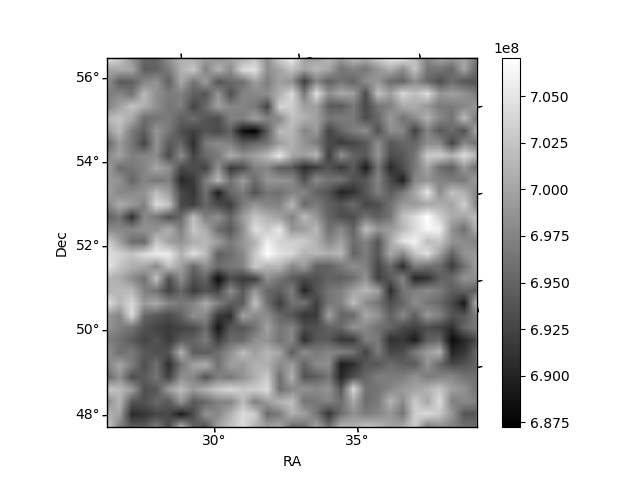
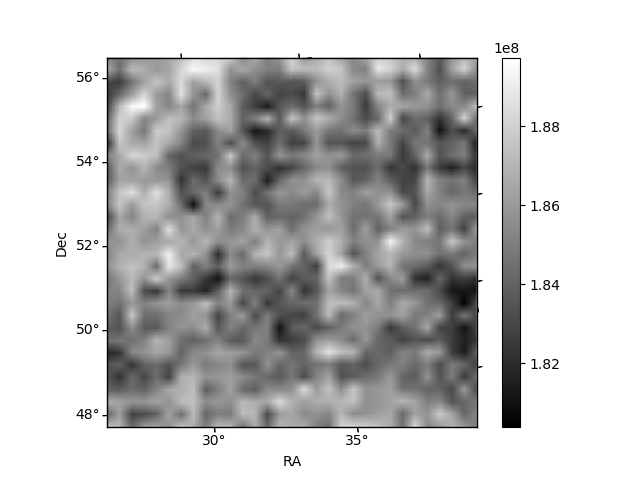
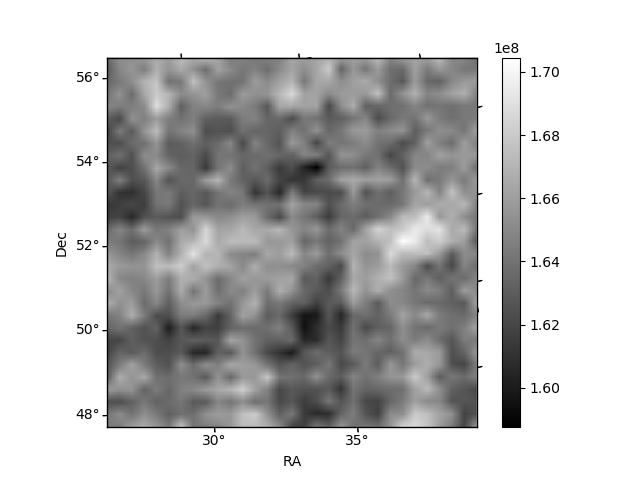
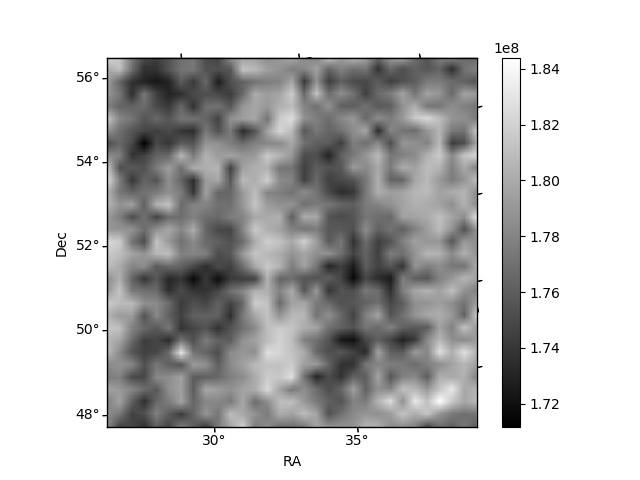
Histogram calculated using DETX and DETY for each event in the final _common_clean file
| Quadrant A | 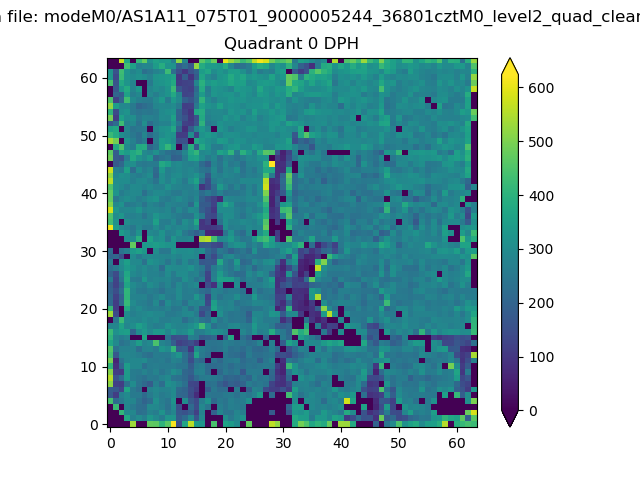 |
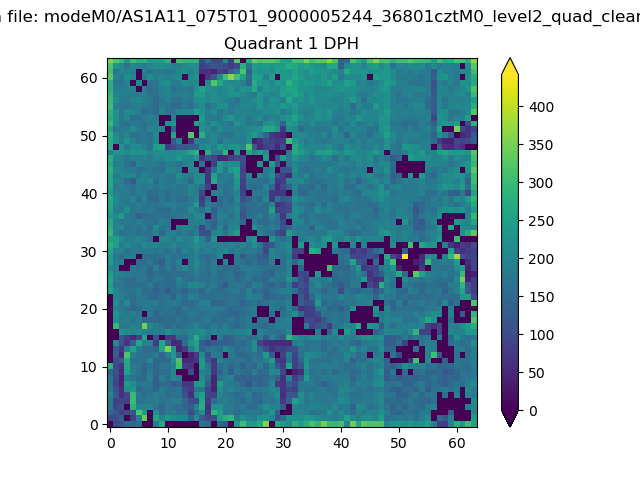 |
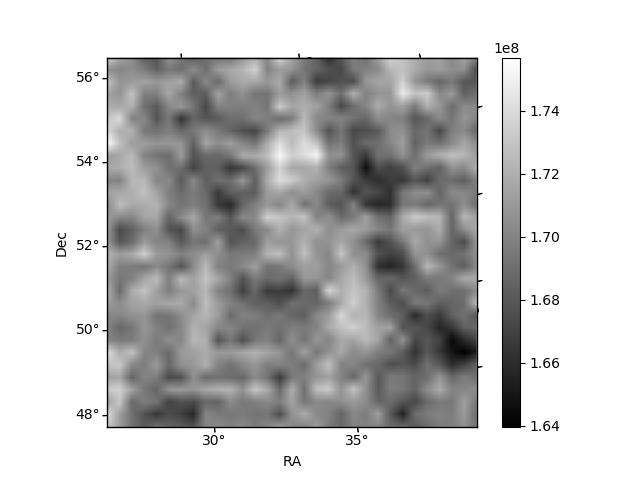
Quadrant B |
|---|---|---|---|
| Quadrant D | 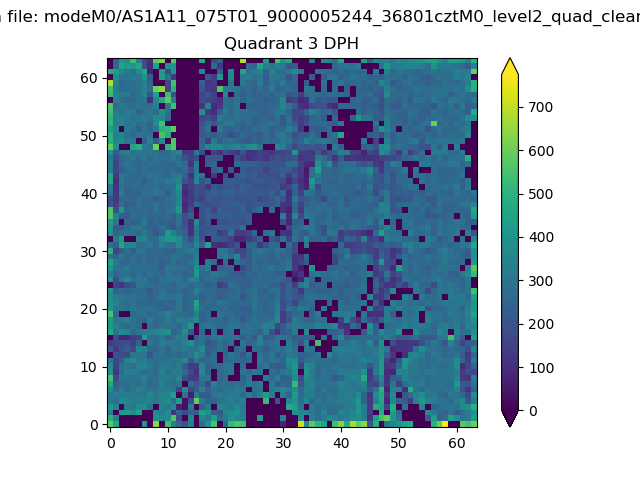 |
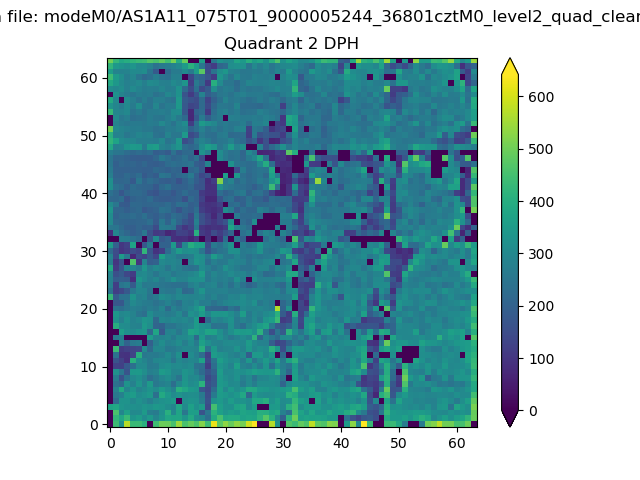 |
Quadrant C |
| Plot type | Count rate plots | Images |
|---|---|---|
| Comparison with Poisson distribution Blue bars denote a histogram of data divided into 1 sec bins. Red curve is a Poisson curve with rate = median count rate of data. |
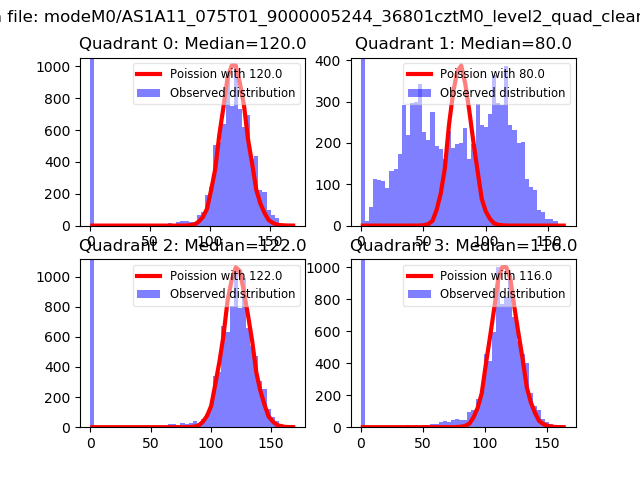 |
 |
| Quadrant-wise count rates Data is divided into 100 sec bins |
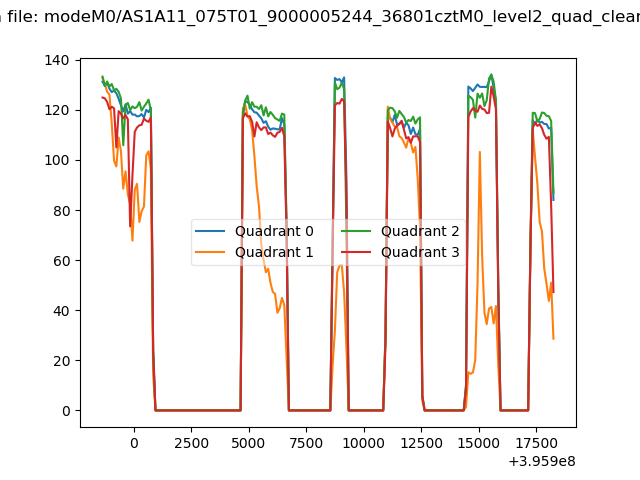 |
|
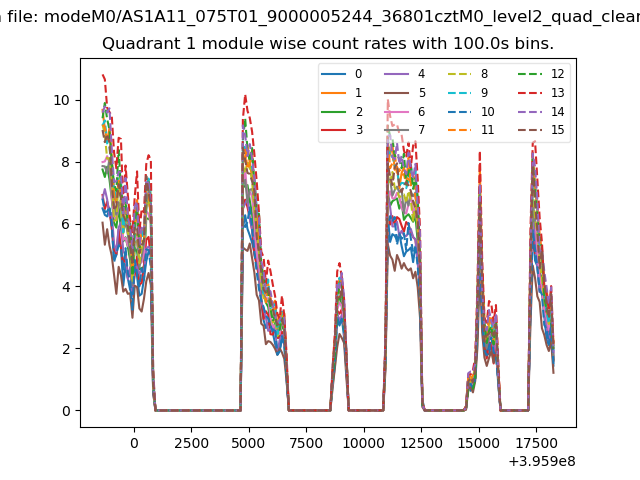
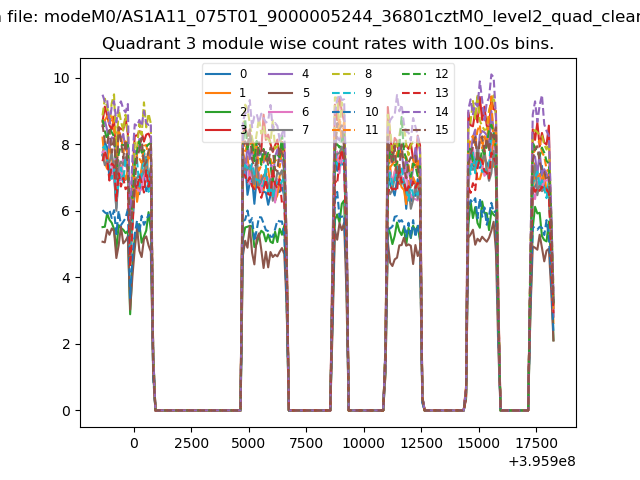
| Module-wise count rates for Quadrant A Data is divided into 100 sec bins |
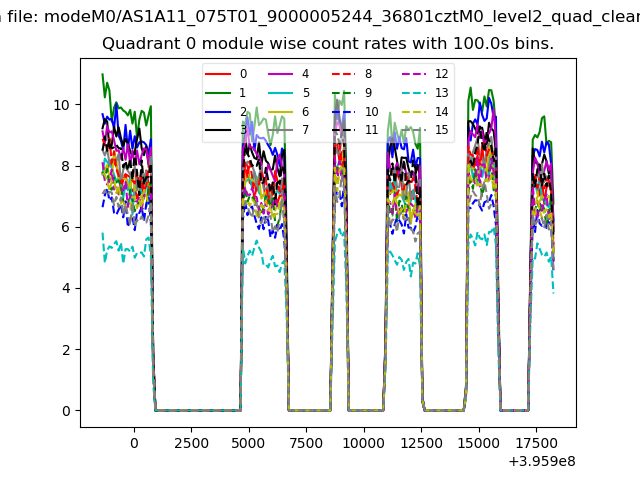 |
 |
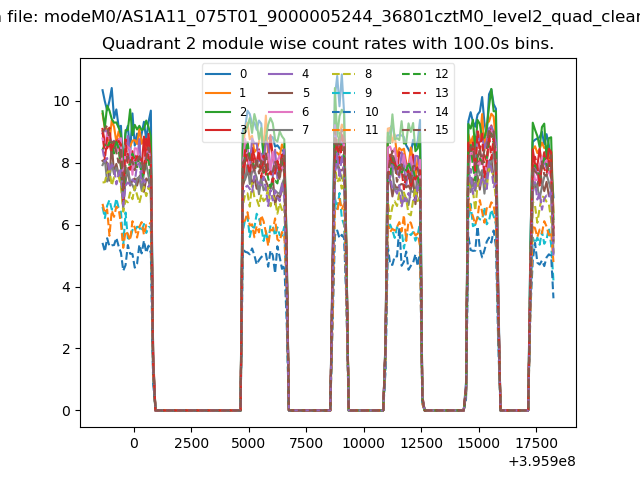
| Module-wise count rates for Quadrant B Data is divided into 100 sec bins |
 |
 |
| Module-wise count rates for Quadrant C Data is divided into 100 sec bins |
 |
 |
| Module-wise count rates for Quadrant D Data is divided into 100 sec bins |
 |
 |
| Parameter | Plot |
|---|---|
| CZT HV Monitor | 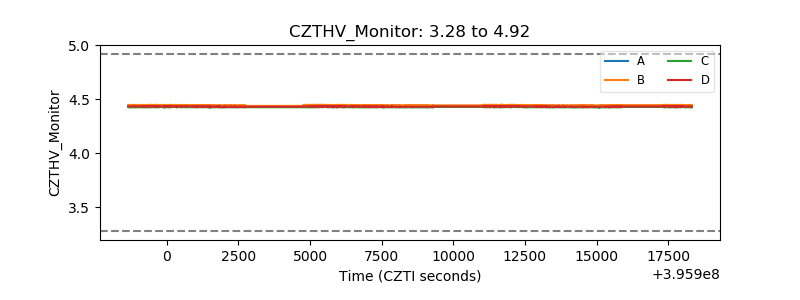 |
| D_VDD | 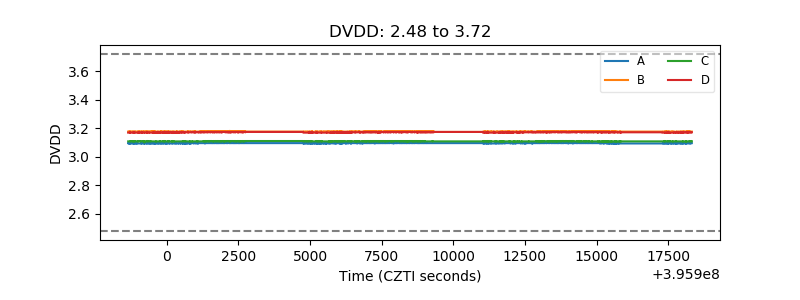 |
| Temperature 1 |  |
| Veto HV Monitor | 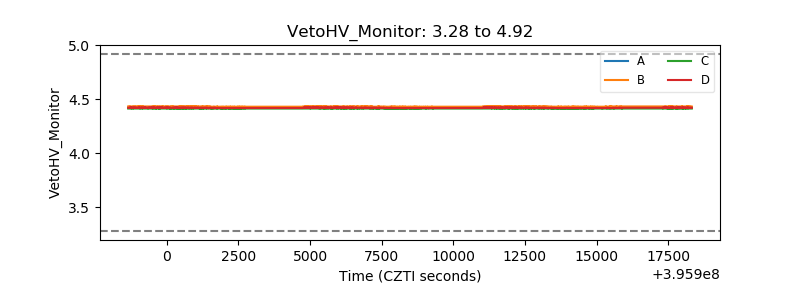 |
| Veto LLD | 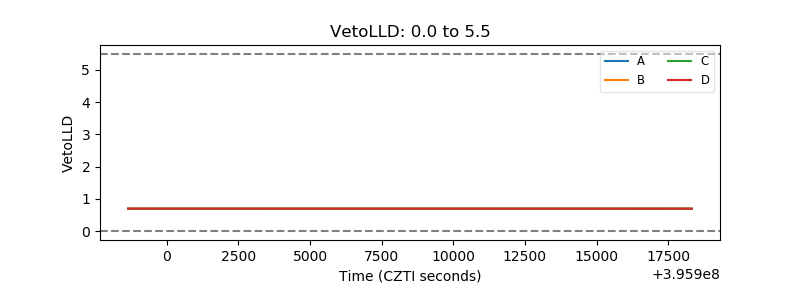 |
| Alpha Counter | 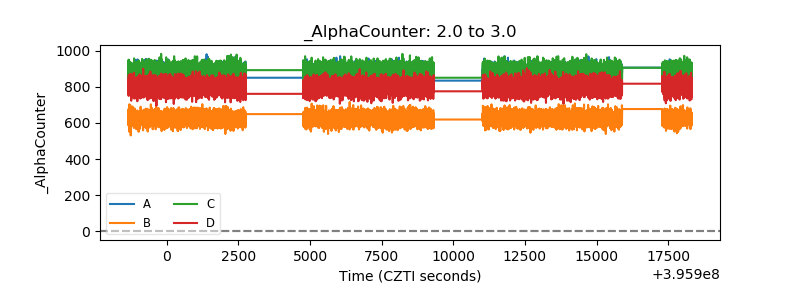 |
| _CPM_Rate | 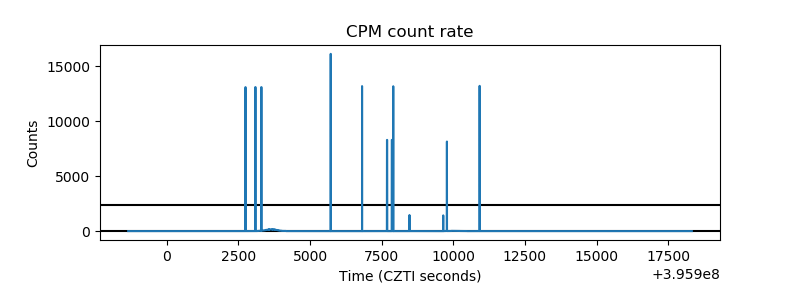 |
| CZT Counter | 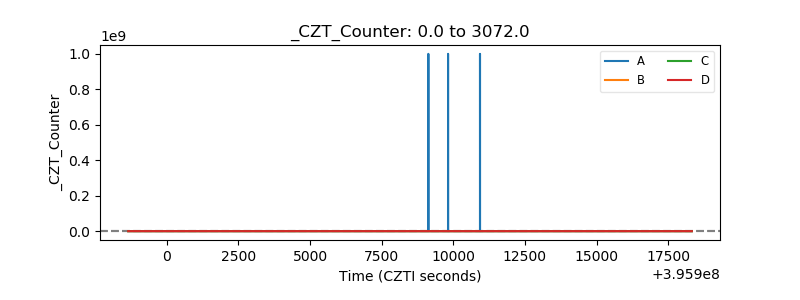 |
| +2.5 Volts monitor |  |
| +5 Volts monitor |  |
| _ROLL_ROT | 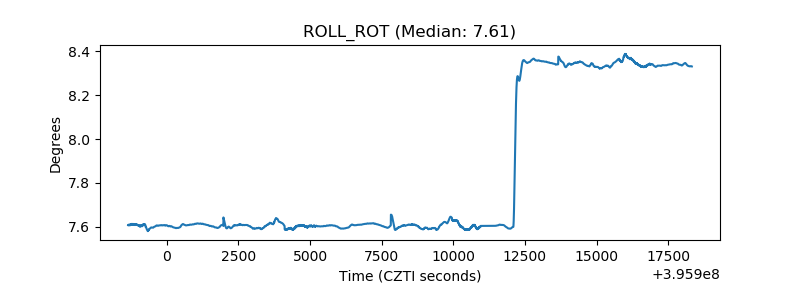 |
| _Roll_DEC | 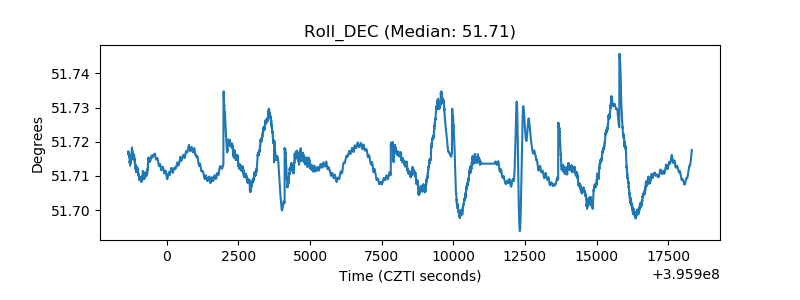 |
| _Roll_RA | 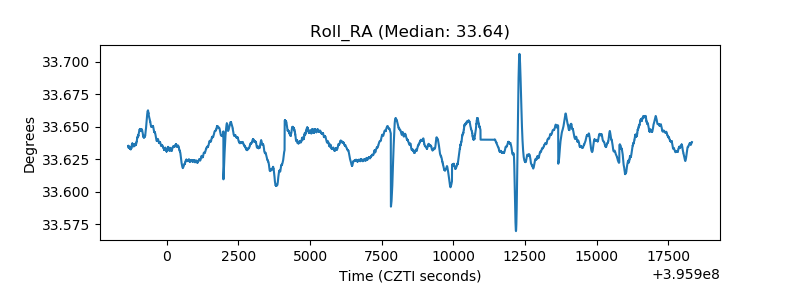 |
| Veto Counter | 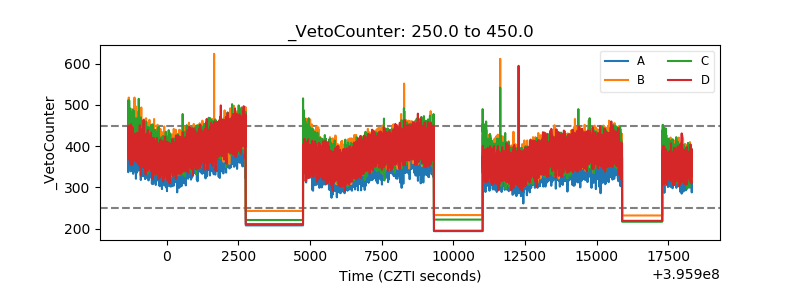 |