| Param | Original file | Final file |
|---|---|---|
| Filename | modeM0/AS1A11_075T01_9000005244_36802cztM0_level2.evt | modeM0/AS1A11_075T01_9000005244_36802cztM0_level2_quad_clean.evt |
| Size (bytes) | 808,323,840 | 56,842,560 |
| Size | 770.9 MB | 54.2 MB |
| Events in quadrant A | 2,674,991 | 403,765 |
| Events in quadrant B | 14,485,928 | 139,523 |
| Events in quadrant C | 2,756,749 | 408,382 |
| Events in quadrant D | 4,182,372 | 374,635 |
| Mode SS | |||
|---|---|---|---|
| Quadrant | BADHDUFLAG | Total packets | Discarded packets |
| A | 0 | 114 | 0 |
| B | 0 | 114 | 0 |
| C | 0 | 114 | 0 |
| D | 0 | 114 | 0 |
| Mode M0 | |||
|---|---|---|---|
| Quadrant | BADHDUFLAG | Total packets | Discarded packets |
| A | 0 | 11486 | 2 |
| B | 0 | 46882 | 1 |
| C | 0 | 11514 | 1 |
| D | 0 | 16267 | 1 |
| Mode M9 | |||
|---|---|---|---|
| Quadrant | BADHDUFLAG | Total packets | Discarded packets |
| A | 0 | 13 | 0 |
| B | 0 | 13 | 0 |
| C | 0 | 13 | 0 |
| D | 0 | 13 | 0 |
| Quadrant | Total seconds | Saturated seconds | Saturation percentage |
|---|---|---|---|
| A | 5619 | 6 | 0.106781% |
| B | 5619 | 5464 | 97.241502% |
| C | 5619 | 6 | 0.106781% |
| D | 5619 | 480 | 8.542445% |
Noise dominated data is calculated using 1-second bins in cleaned event files. If a bin has >2000 counts, and if more than 50% of those come from <1% of pixels, then it is considered to be noise-dominated and hence unusable.
| Quadrant | # 1 sec bins | Bins with >0 counts | Bins with >2000 counts | High rate bins dominated by noise | Noise dominated (total time) | Noise dominated (detector-on time) | Marked lightcurve |
|---|---|---|---|---|---|---|---|
| A | 6932 | 5620 | 0 | 0 | 0.00% | 0.00% | 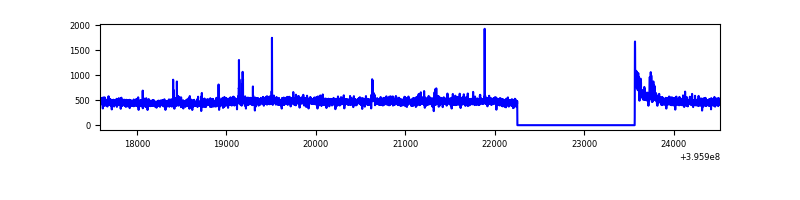 |
| B | 6931 | 5618 | 5383 | 5383 | 77.67% | 95.82% | 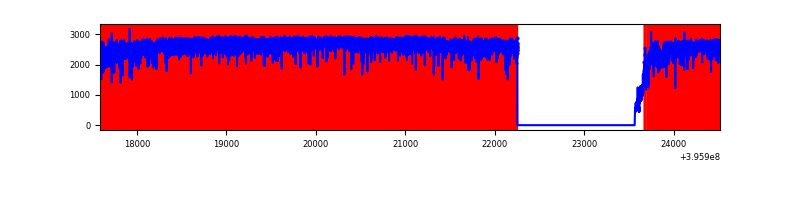 |
| C | 6932 | 5620 | 6 | 6 | 0.09% | 0.11% | 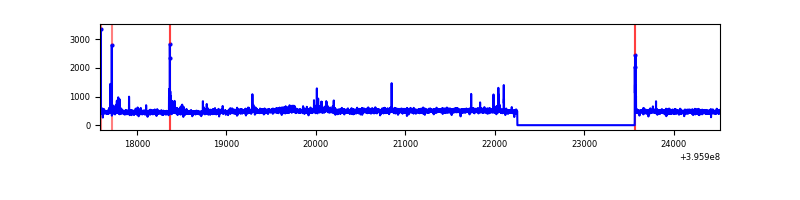 |
| D | 6932 | 5620 | 432 | 432 | 6.23% | 7.69% | 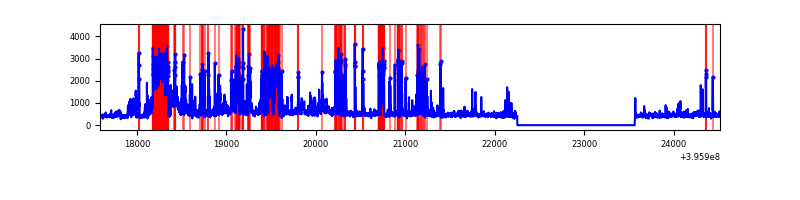 |
Top three noisy pixels from each quadrant. If the there are fewer than three noisy pixels in the level2.evt file, extra rows are filled as -1
| Pixel properties | Quadrant properties | ||||||
|---|---|---|---|---|---|---|---|
| Quadrant | DetID | PixID | Counts | Sigma | Mean | Median | Sigma |
| A | 10 | 83 | 187523 | 1452.18 | 630 | 618 | 128.7 |
| A | 9 | 143 | 20354 | 153.34 | 630 | 618 | 128.7 |
| A | 15 | 223 | 12227 | 90.2 | 630 | 618 | 128.7 |
| B | 12 | 1 | 13215719 | 286494.19 | 234 | 229 | 46.1 |
| B | 4 | 171 | 119014 | 2575.1 | 234 | 229 | 46.1 |
| B | 0 | 190 | 78785 | 1702.99 | 234 | 229 | 46.1 |
| C | 15 | 214 | 237683 | 1652.6 | 613 | 616 | 143.5 |
| C | 0 | 207 | 43898 | 301.72 | 613 | 616 | 143.5 |
| C | 14 | 254 | 26662 | 181.57 | 613 | 616 | 143.5 |
| D | 1 | 20 | 580656 | 3979.73 | 592 | 574 | 145.8 |
| D | 2 | 120 | 319822 | 2190.24 | 592 | 574 | 145.8 |
| D | 12 | 227 | 259551 | 1776.75 | 592 | 574 | 145.8 |
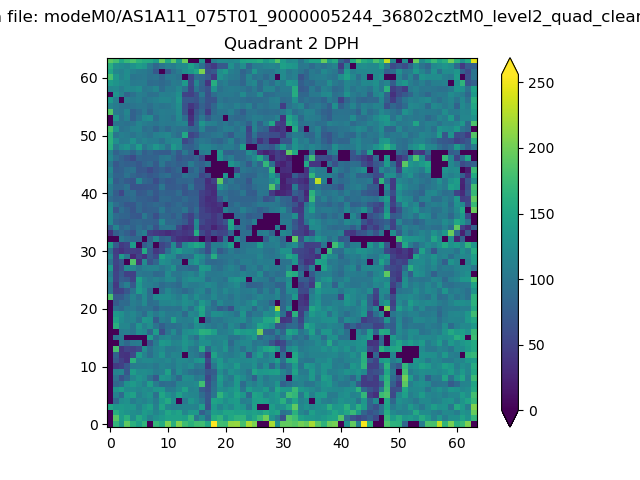
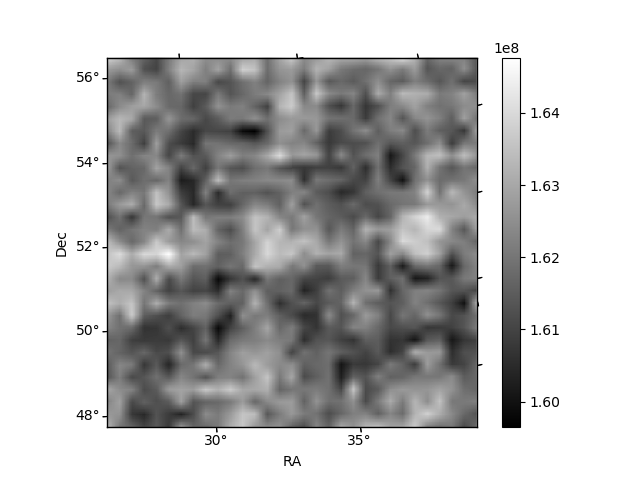
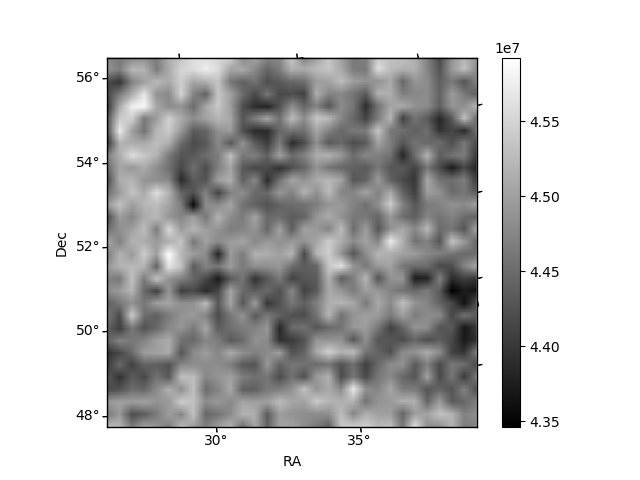
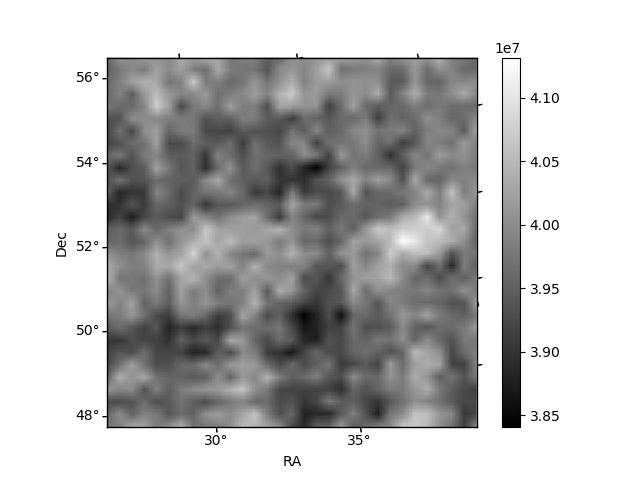
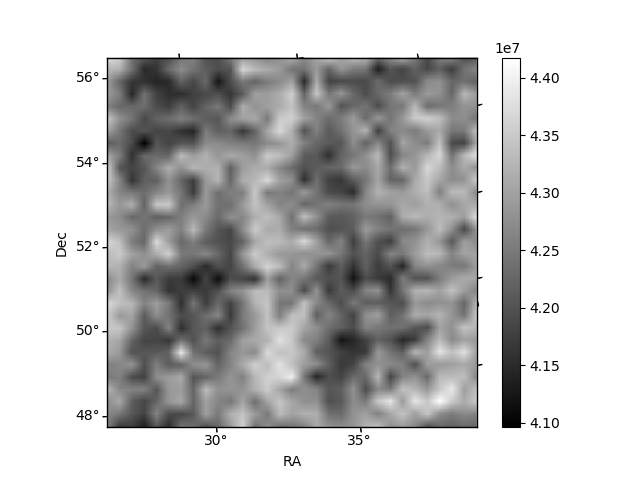
Histogram calculated using DETX and DETY for each event in the final _common_clean file
| Quadrant A | 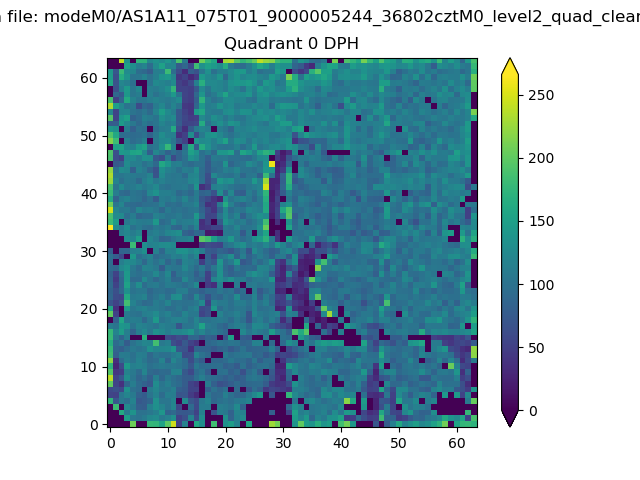 |
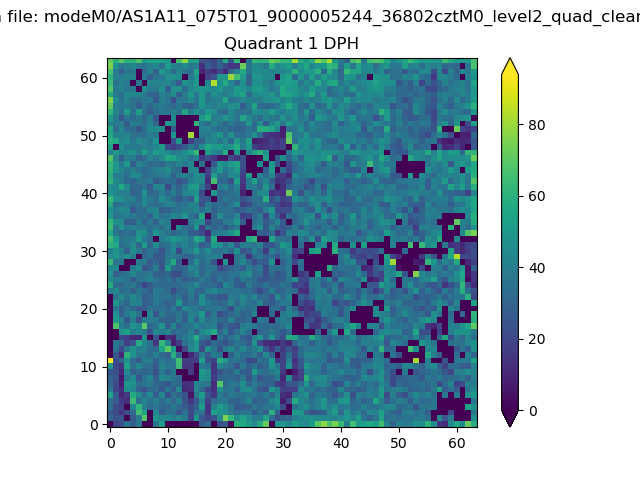 |
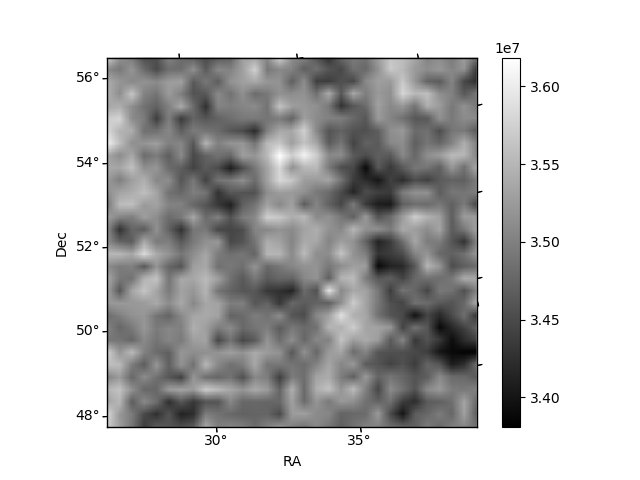
Quadrant B |
|---|---|---|---|
| Quadrant D | 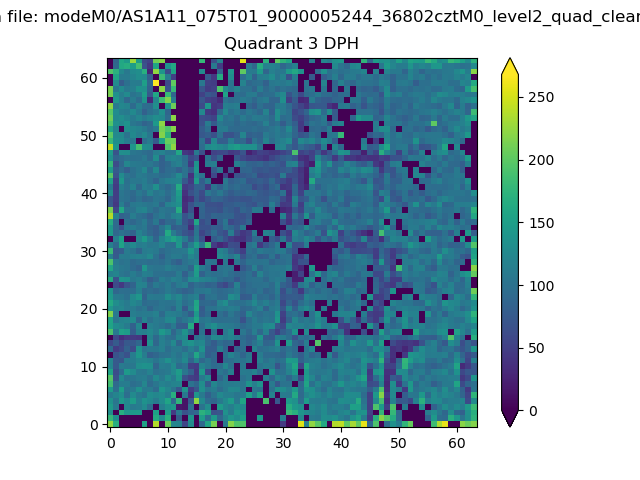 |
 |
Quadrant C |
| Plot type | Count rate plots | Images |
|---|---|---|
| Comparison with Poisson distribution Blue bars denote a histogram of data divided into 1 sec bins. Red curve is a Poisson curve with rate = median count rate of data. |
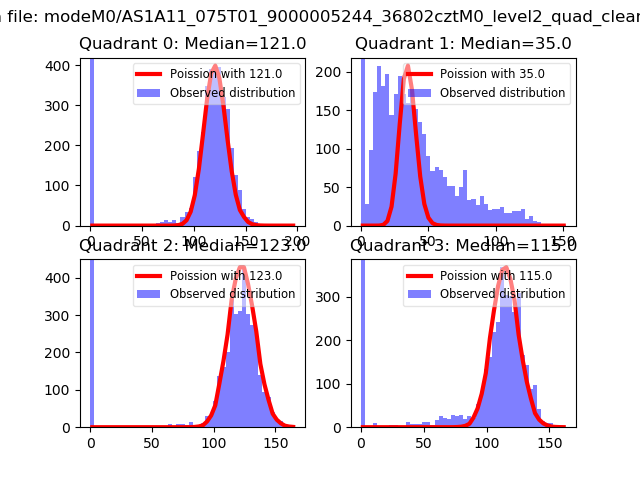 |
 |
| Quadrant-wise count rates Data is divided into 100 sec bins |
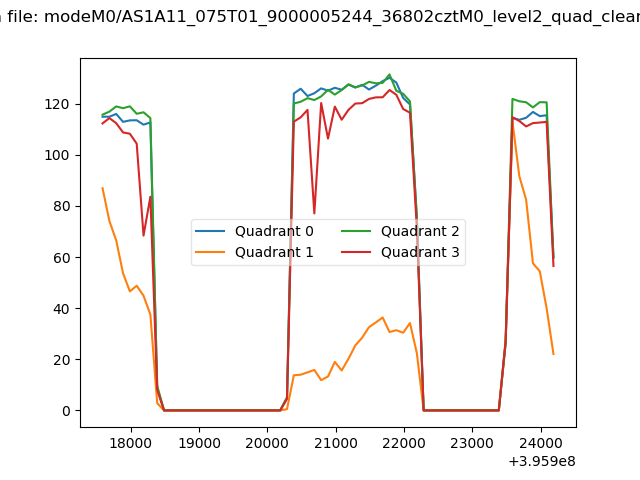 |
|
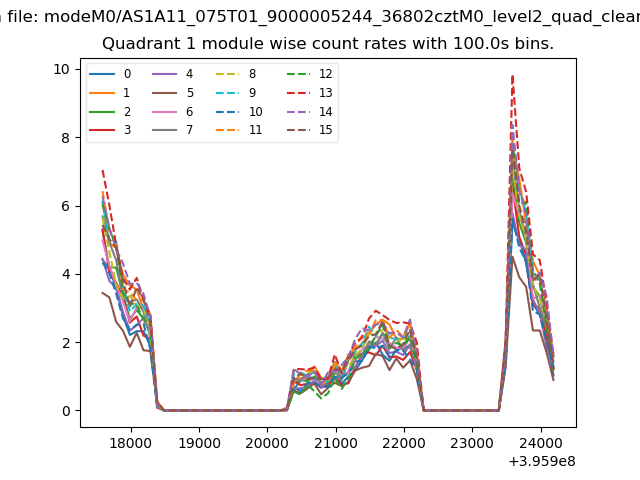
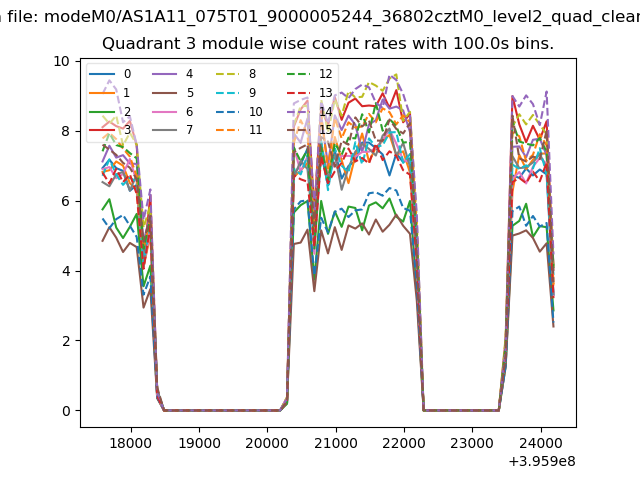
| Module-wise count rates for Quadrant A Data is divided into 100 sec bins |
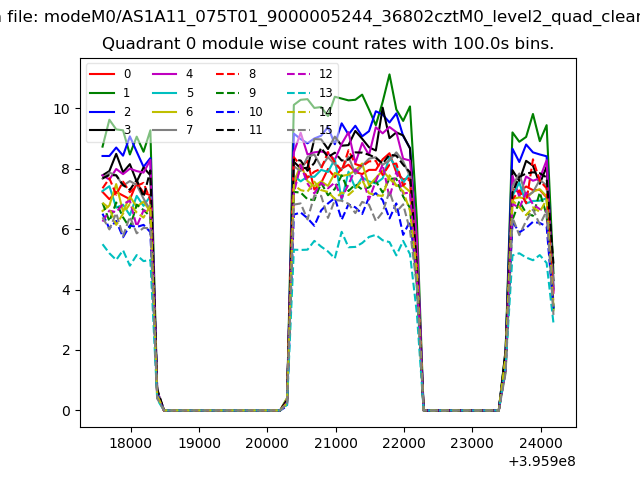 |
 |
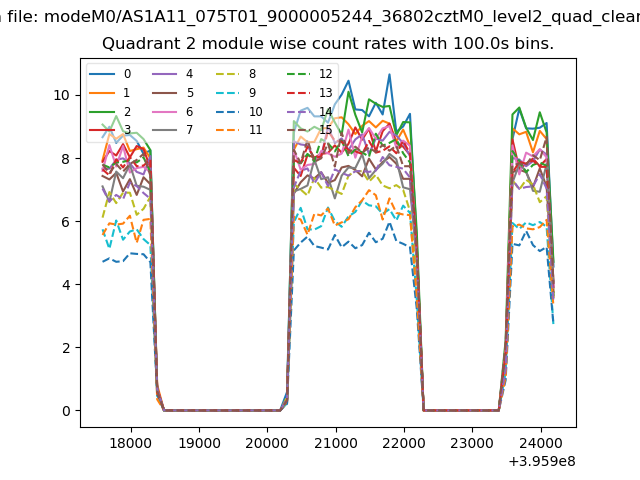
| Module-wise count rates for Quadrant B Data is divided into 100 sec bins |
 |
 |
| Module-wise count rates for Quadrant C Data is divided into 100 sec bins |
 |
 |
| Module-wise count rates for Quadrant D Data is divided into 100 sec bins |
 |
 |
| Parameter | Plot |
|---|---|
| CZT HV Monitor | 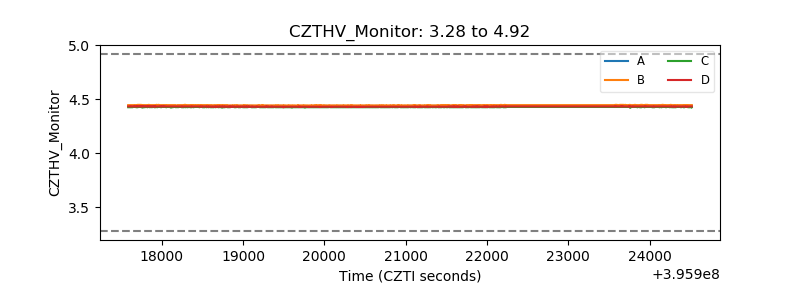 |
| D_VDD | 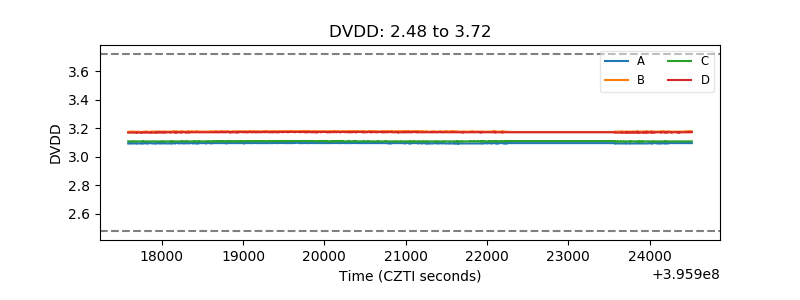 |
| Temperature 1 | 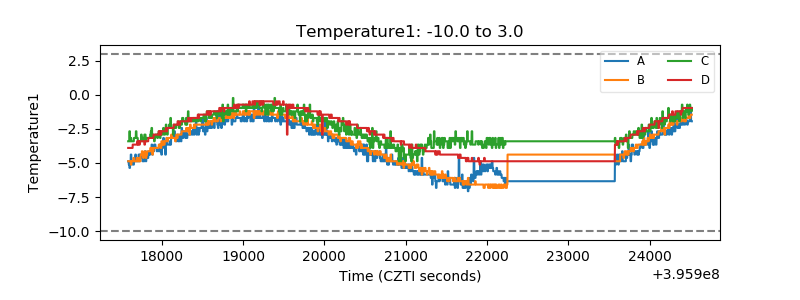 |
| Veto HV Monitor | 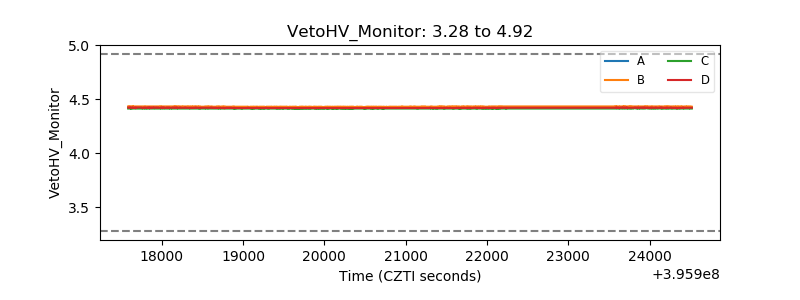 |
| Veto LLD | 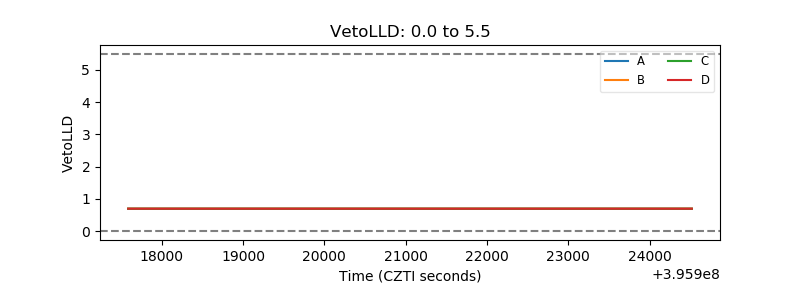 |
| Alpha Counter | 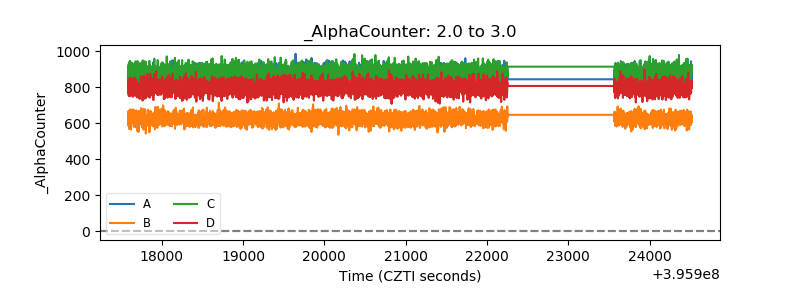 |
| _CPM_Rate | 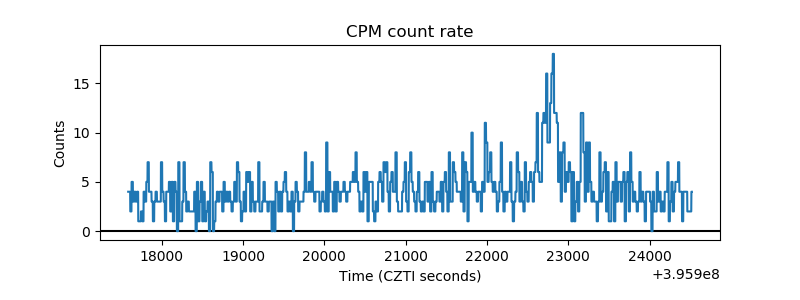 |
| CZT Counter | 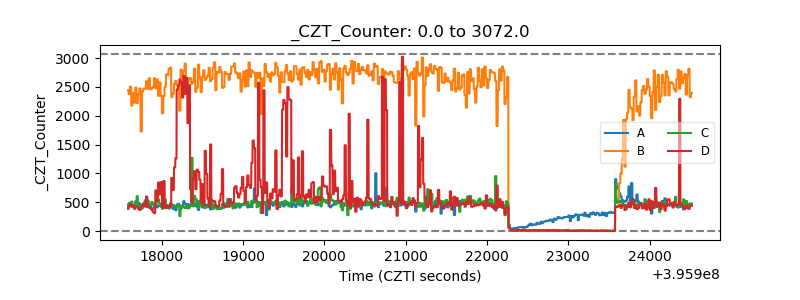 |
| +2.5 Volts monitor |  |
| +5 Volts monitor |  |
| _ROLL_ROT | 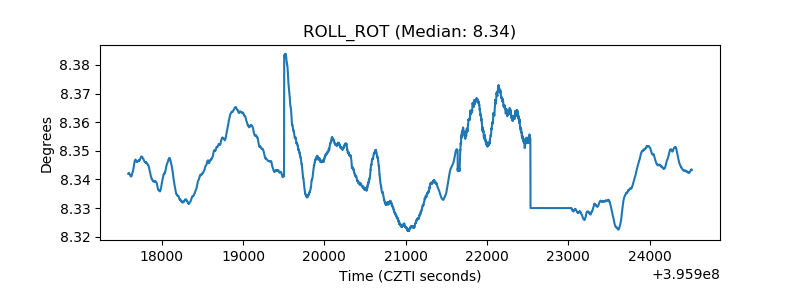 |
| _Roll_DEC | 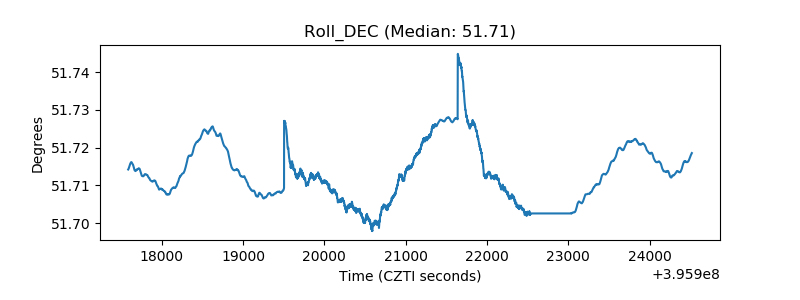 |
| _Roll_RA | 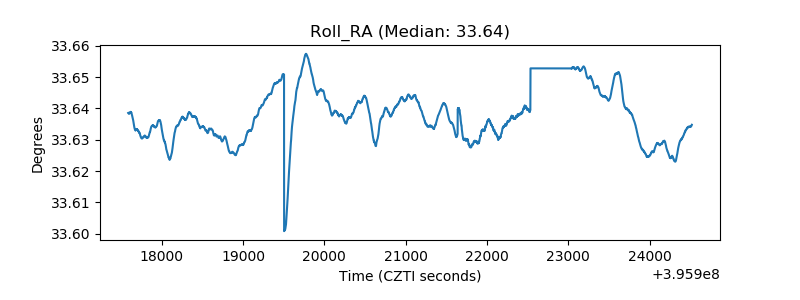 |
| Veto Counter | 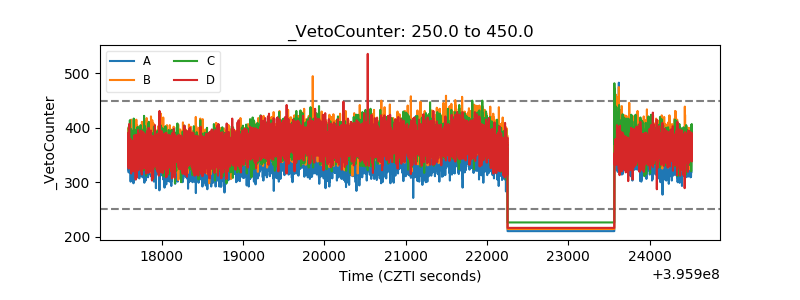 |