| Param | Original file | Final file |
|---|---|---|
| Filename | modeM0/AS1A11_075T01_9000005244_36806cztM0_level2.evt | modeM0/AS1A11_075T01_9000005244_36806cztM0_level2_quad_clean.evt |
| Size (bytes) | 833,783,040 | 54,990,720 |
| Size | 795.2 MB | 52.4 MB |
| Events in quadrant A | 3,154,538 | 397,089 |
| Events in quadrant B | 14,400,992 | 104,774 |
| Events in quadrant C | 2,954,057 | 399,084 |
| Events in quadrant D | 4,366,816 | 373,929 |
| Mode SS | |||
|---|---|---|---|
| Quadrant | BADHDUFLAG | Total packets | Discarded packets |
| A | 0 | 114 | 0 |
| B | 0 | 114 | 0 |
| C | 0 | 114 | 0 |
| D | 0 | 114 | 0 |
| Mode M0 | |||
|---|---|---|---|
| Quadrant | BADHDUFLAG | Total packets | Discarded packets |
| A | 0 | 12784 | 3 |
| B | 0 | 46631 | 2 |
| C | 0 | 12168 | 2 |
| D | 0 | 16802 | 2 |
| Mode M9 | |||
|---|---|---|---|
| Quadrant | BADHDUFLAG | Total packets | Discarded packets |
| A | 0 | 25 | 0 |
| B | 0 | 25 | 0 |
| C | 0 | 25 | 0 |
| D | 0 | 26 | 0 |
| Quadrant | Total seconds | Saturated seconds | Saturation percentage |
|---|---|---|---|
| A | 5547 | 22 | 0.396611% |
| B | 5547 | 5410 | 97.530197% |
| C | 5547 | 49 | 0.883360% |
| D | 5547 | 170 | 3.064720% |
Noise dominated data is calculated using 1-second bins in cleaned event files. If a bin has >2000 counts, and if more than 50% of those come from <1% of pixels, then it is considered to be noise-dominated and hence unusable.
| Quadrant | # 1 sec bins | Bins with >0 counts | Bins with >2000 counts | High rate bins dominated by noise | Noise dominated (total time) | Noise dominated (detector-on time) | Marked lightcurve |
|---|---|---|---|---|---|---|---|
| A | 7160 | 5548 | 3 | 3 | 0.04% | 0.05% | 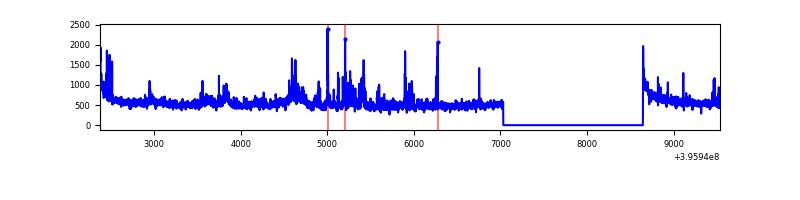 |
| B | 7159 | 5546 | 5313 | 5313 | 74.21% | 95.80% | 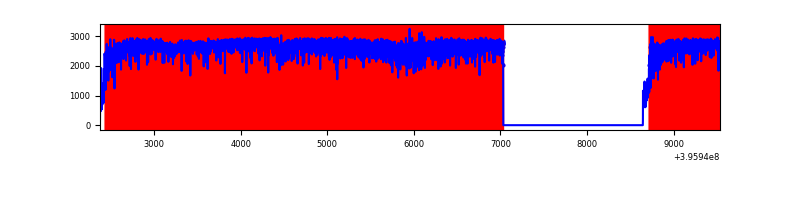 |
| C | 7160 | 5548 | 33 | 33 | 0.46% | 0.59% | 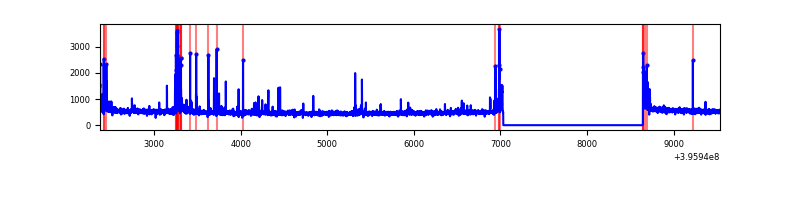 |
| D | 7160 | 5548 | 186 | 186 | 2.60% | 3.35% | 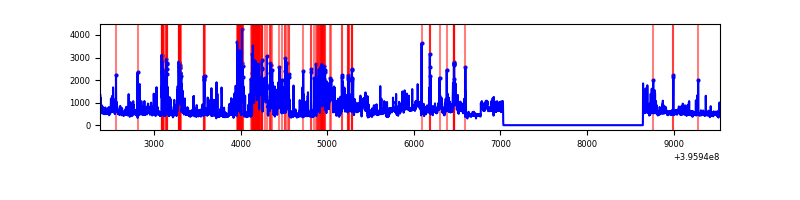 |
Top three noisy pixels from each quadrant. If the there are fewer than three noisy pixels in the level2.evt file, extra rows are filled as -1
| Pixel properties | Quadrant properties | ||||||
|---|---|---|---|---|---|---|---|
| Quadrant | DetID | PixID | Counts | Sigma | Mean | Median | Sigma |
| A | 14 | 235 | 374027 | 2844.77 | 639 | 625 | 131.3 |
| A | 10 | 83 | 252528 | 1919.13 | 639 | 625 | 131.3 |
| A | 9 | 143 | 16453 | 120.59 | 639 | 625 | 131.3 |
| B | 12 | 1 | 13344430 | 321743.52 | 211 | 207 | 41.5 |
| B | 5 | 172 | 77018 | 1852.0 | 211 | 207 | 41.5 |
| B | 4 | 171 | 32551 | 779.85 | 211 | 207 | 41.5 |
| C | 15 | 214 | 238752 | 1624.78 | 622 | 626 | 146.6 |
| C | 14 | 254 | 167471 | 1138.42 | 622 | 626 | 146.6 |
| C | 0 | 10 | 103477 | 701.77 | 622 | 626 | 146.6 |
| D | 12 | 227 | 707853 | 4688.97 | 619 | 602 | 150.8 |
| D | 1 | 20 | 644006 | 4265.67 | 619 | 602 | 150.8 |
| D | 13 | 249 | 191887 | 1268.19 | 619 | 602 | 150.8 |
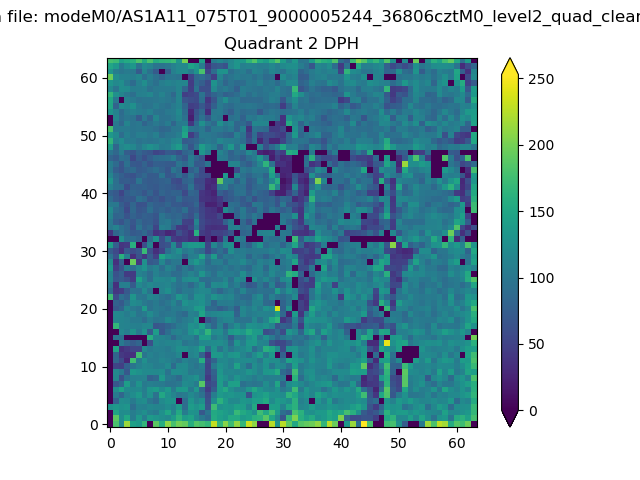
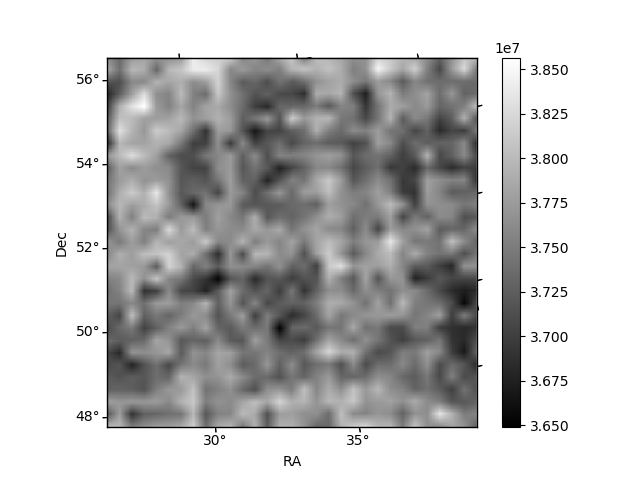
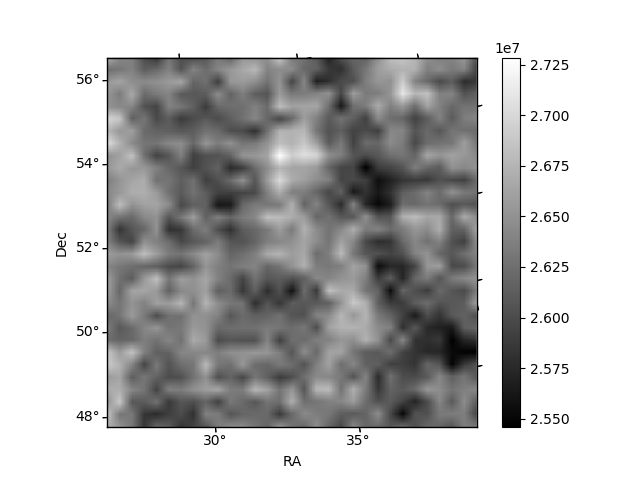
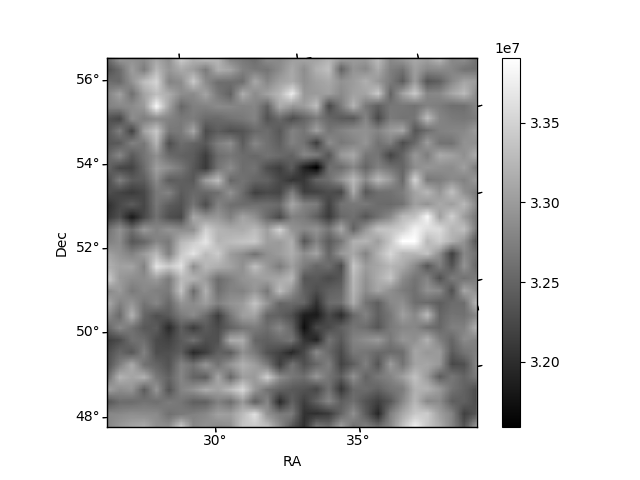
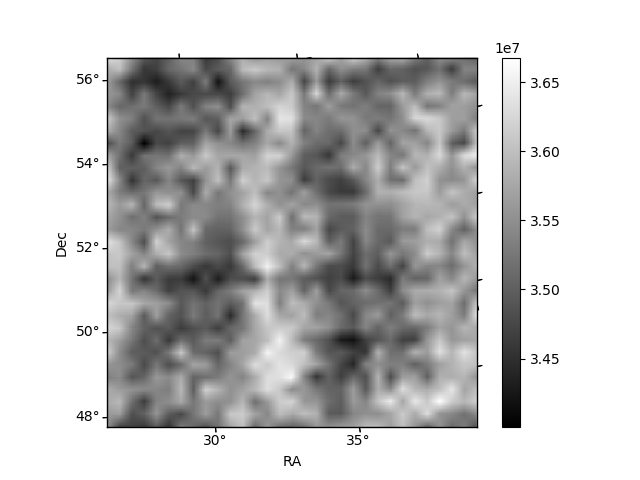
Histogram calculated using DETX and DETY for each event in the final _common_clean file
| Quadrant A | 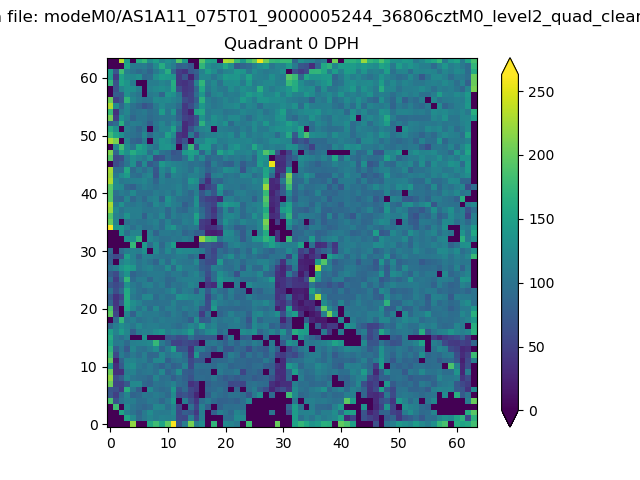 |
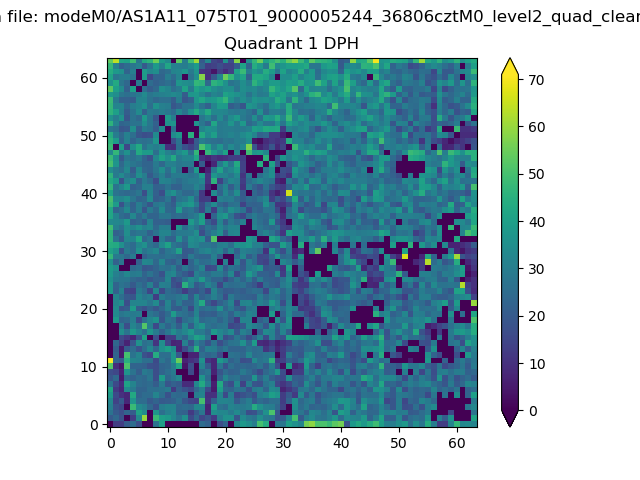 |
Quadrant B |
|---|---|---|---|
| Quadrant D | 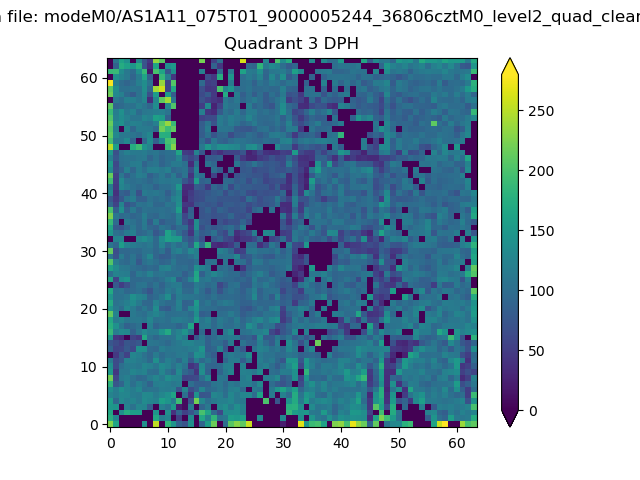 |
 |
Quadrant C |
| Plot type | Count rate plots | Images |
|---|---|---|
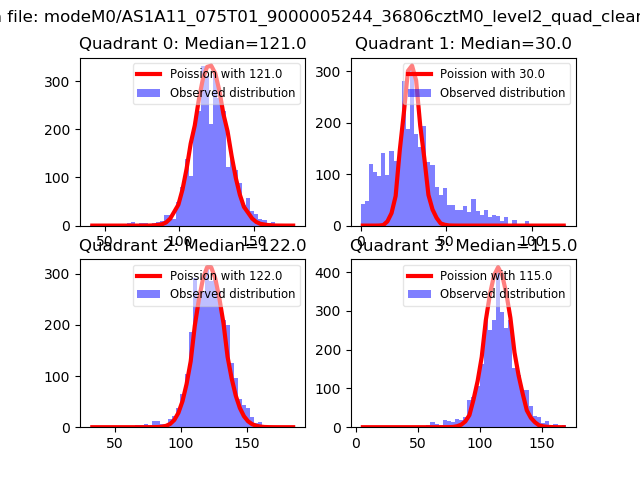
| Comparison with Poisson distribution Blue bars denote a histogram of data divided into 1 sec bins. Red curve is a Poisson curve with rate = median count rate of data. |
 |
 |
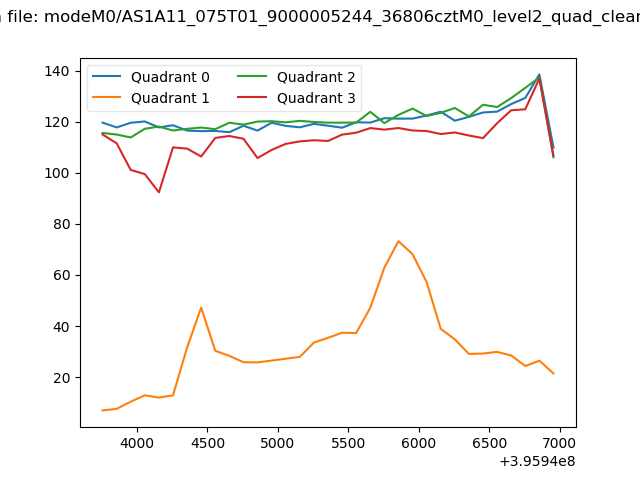
| Quadrant-wise count rates Data is divided into 100 sec bins |
 |
|
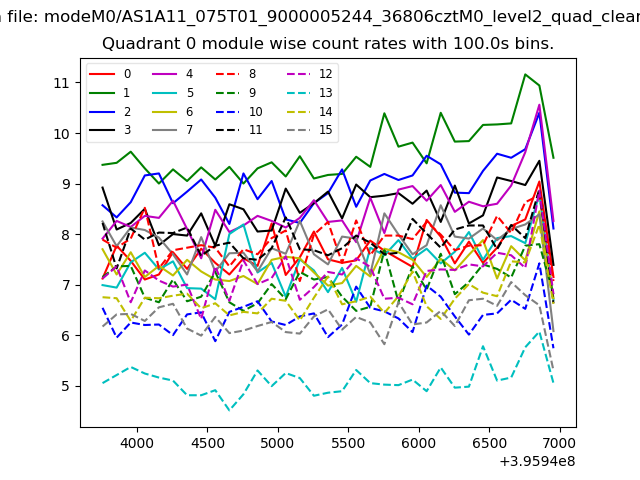
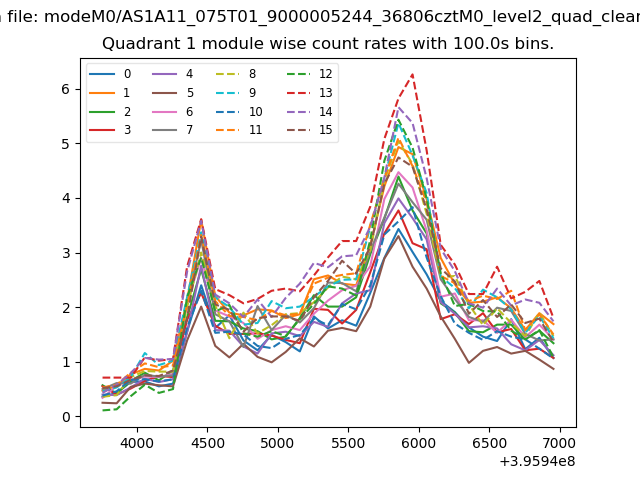
| Module-wise count rates for Quadrant A Data is divided into 100 sec bins |
 |
 |
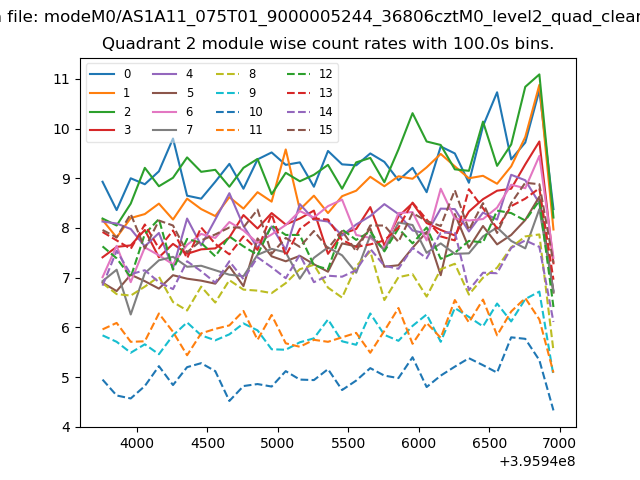
| Module-wise count rates for Quadrant B Data is divided into 100 sec bins |
 |
 |
| Module-wise count rates for Quadrant C Data is divided into 100 sec bins |
 |
 |
| Module-wise count rates for Quadrant D Data is divided into 100 sec bins |
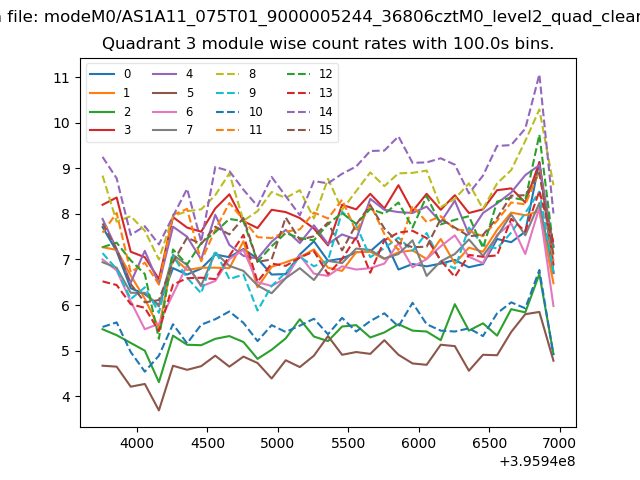 |
 |
| Parameter | Plot |
|---|---|
| CZT HV Monitor | 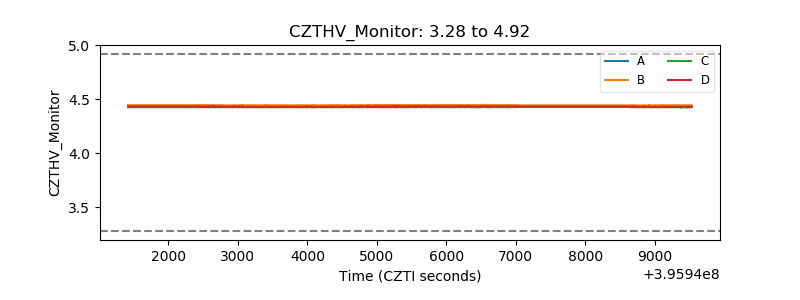 |
| D_VDD | 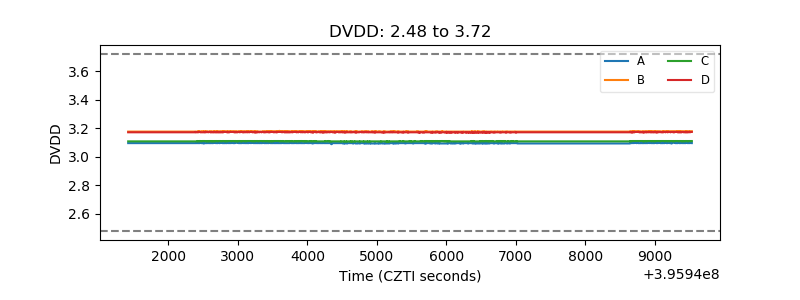 |
| Temperature 1 | 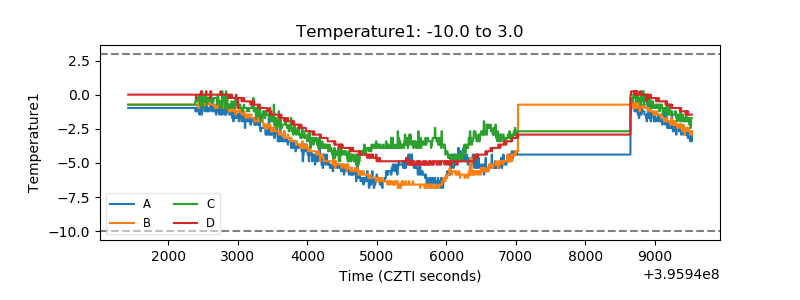 |
| Veto HV Monitor |  |
| Veto LLD | 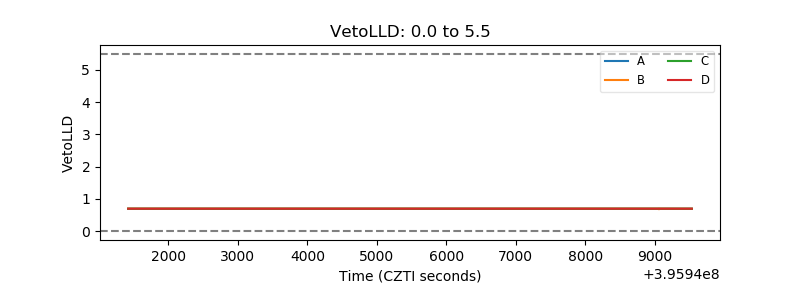 |
| Alpha Counter | 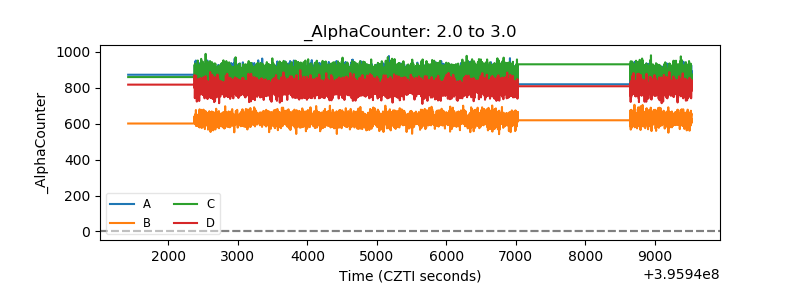 |
| _CPM_Rate | 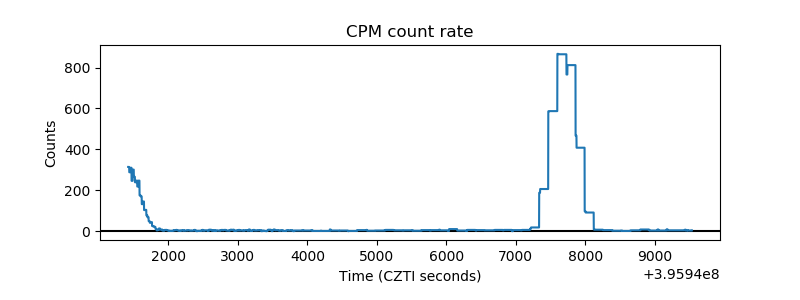 |
| CZT Counter | 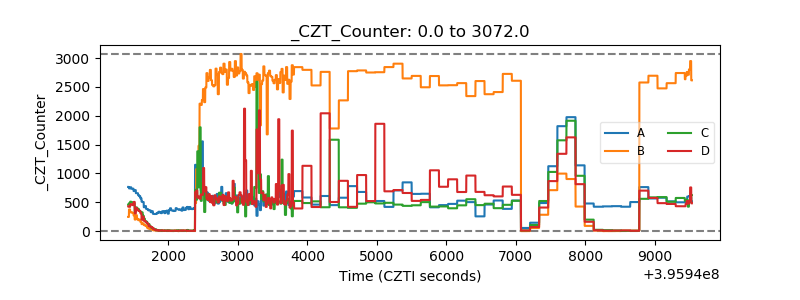 |
| +2.5 Volts monitor | 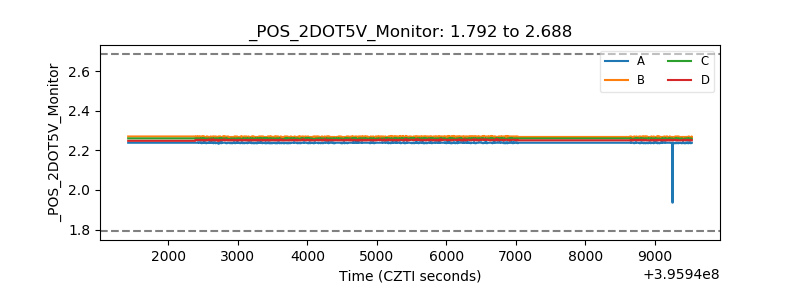 |
| +5 Volts monitor | 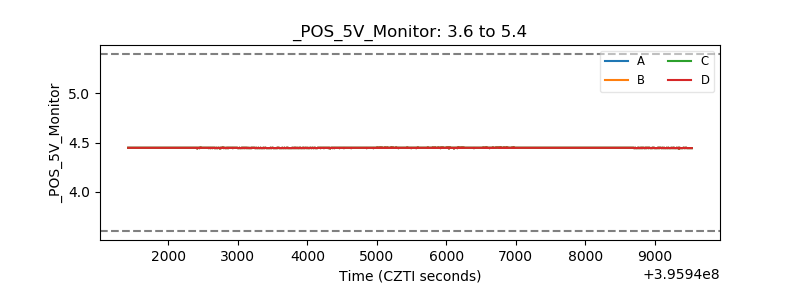 |
| _ROLL_ROT | 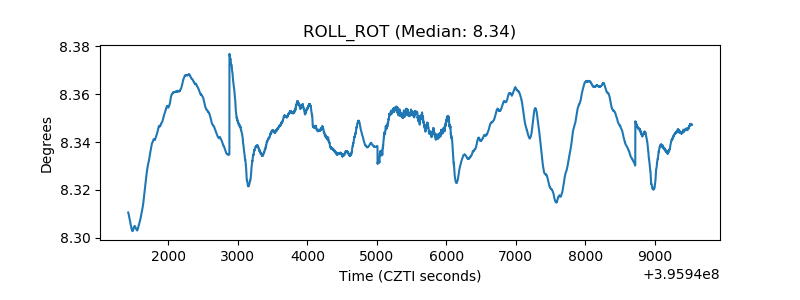 |
| _Roll_DEC | 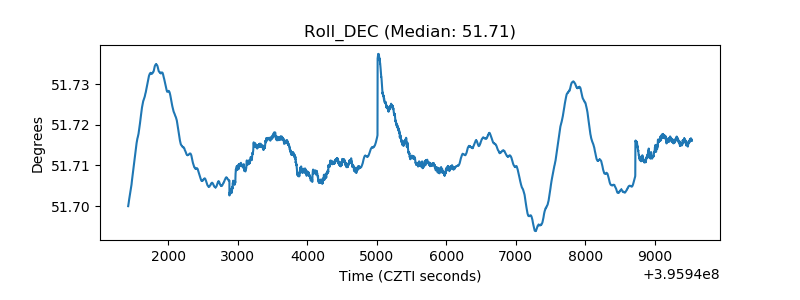 |
| _Roll_RA | 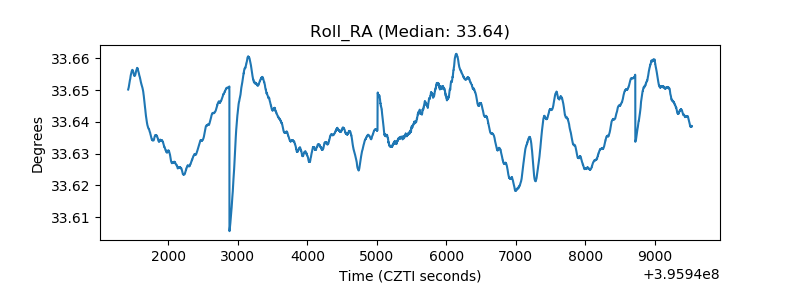 |
| Veto Counter | 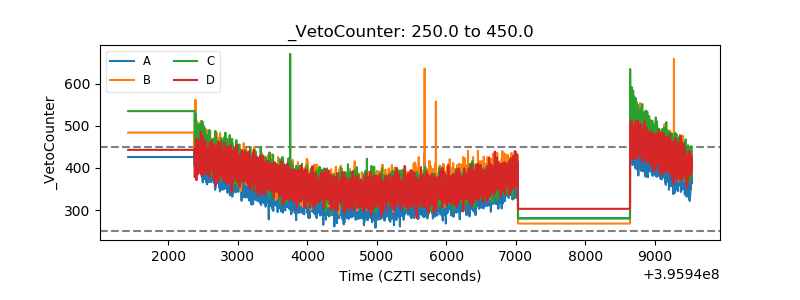 |