| Param | Original file | Final file |
|---|---|---|
| Filename | modeM0/AS1A11_075T01_9000005244_36808cztM0_level2.evt | modeM0/AS1A11_075T01_9000005244_36808cztM0_level2_quad_clean.evt |
| Size (bytes) | 767,600,640 | 62,513,280 |
| Size | 732.0 MB | 59.6 MB |
| Events in quadrant A | 2,742,632 | 471,833 |
| Events in quadrant B | 13,682,074 | 126,191 |
| Events in quadrant C | 2,949,979 | 472,492 |
| Events in quadrant D | 3,513,072 | 448,652 |
| Mode SS | |||
|---|---|---|---|
| Quadrant | BADHDUFLAG | Total packets | Discarded packets |
| A | 0 | 108 | 0 |
| B | 0 | 108 | 0 |
| C | 0 | 108 | 0 |
| D | 0 | 108 | 0 |
| Mode M0 | |||
|---|---|---|---|
| Quadrant | BADHDUFLAG | Total packets | Discarded packets |
| A | 0 | 11697 | 3 |
| B | 0 | 44277 | 2 |
| C | 0 | 12042 | 2 |
| D | 0 | 14190 | 2 |
| Mode M9 | |||
|---|---|---|---|
| Quadrant | BADHDUFLAG | Total packets | Discarded packets |
| A | 0 | 22 | 0 |
| B | 0 | 22 | 0 |
| C | 0 | 22 | 0 |
| D | 0 | 23 | 0 |
| Quadrant | Total seconds | Saturated seconds | Saturation percentage |
|---|---|---|---|
| A | 5310 | 29 | 0.546139% |
| B | 5310 | 5133 | 96.666667% |
| C | 5310 | 82 | 1.544256% |
| D | 5310 | 173 | 3.258004% |
Noise dominated data is calculated using 1-second bins in cleaned event files. If a bin has >2000 counts, and if more than 50% of those come from <1% of pixels, then it is considered to be noise-dominated and hence unusable.
| Quadrant | # 1 sec bins | Bins with >0 counts | Bins with >2000 counts | High rate bins dominated by noise | Noise dominated (total time) | Noise dominated (detector-on time) | Marked lightcurve |
|---|---|---|---|---|---|---|---|
| A | 7073 | 5311 | 12 | 12 | 0.17% | 0.23% |  |
| B | 7072 | 5309 | 5042 | 5042 | 71.30% | 94.97% | 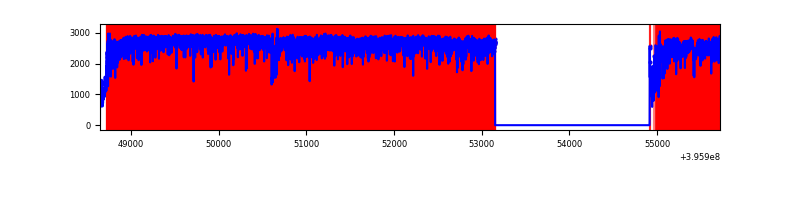 |
| C | 7073 | 5311 | 59 | 59 | 0.83% | 1.11% | 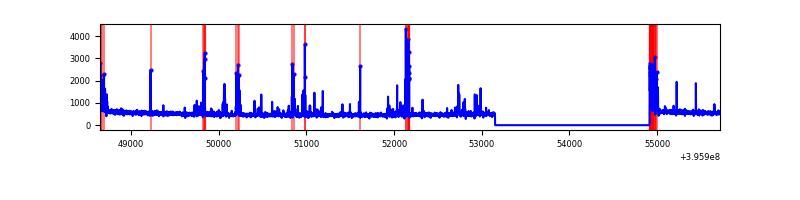 |
| D | 7073 | 5310 | 140 | 140 | 1.98% | 2.64% | 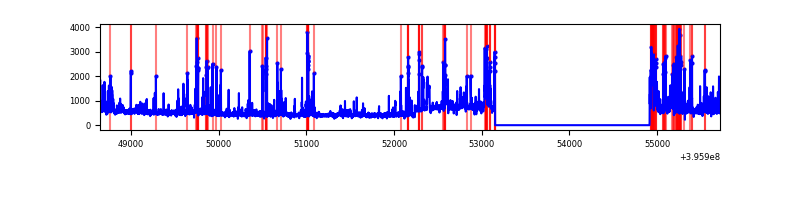 |
Top three noisy pixels from each quadrant. If the there are fewer than three noisy pixels in the level2.evt file, extra rows are filled as -1
| Pixel properties | Quadrant properties | ||||||
|---|---|---|---|---|---|---|---|
| Quadrant | DetID | PixID | Counts | Sigma | Mean | Median | Sigma |
| A | 10 | 83 | 244509 | 1937.96 | 615 | 604 | 125.9 |
| A | 13 | 248 | 53195 | 417.87 | 615 | 604 | 125.9 |
| A | 9 | 143 | 20975 | 161.86 | 615 | 604 | 125.9 |
| B | 12 | 1 | 11655265 | 265678.46 | 225 | 220 | 43.9 |
| B | 5 | 172 | 926969 | 21125.38 | 225 | 220 | 43.9 |
| B | 0 | 190 | 50235 | 1140.1 | 225 | 220 | 43.9 |
| C | 15 | 214 | 227386 | 1614.92 | 601 | 606 | 140.4 |
| C | 14 | 254 | 191366 | 1358.42 | 601 | 606 | 140.4 |
| C | 0 | 10 | 149362 | 1059.31 | 601 | 606 | 140.4 |
| D | 13 | 249 | 499466 | 3403.23 | 597 | 581 | 146.6 |
| D | 1 | 20 | 289400 | 1970.23 | 597 | 581 | 146.6 |
| D | 13 | 171 | 147740 | 1003.87 | 597 | 581 | 146.6 |
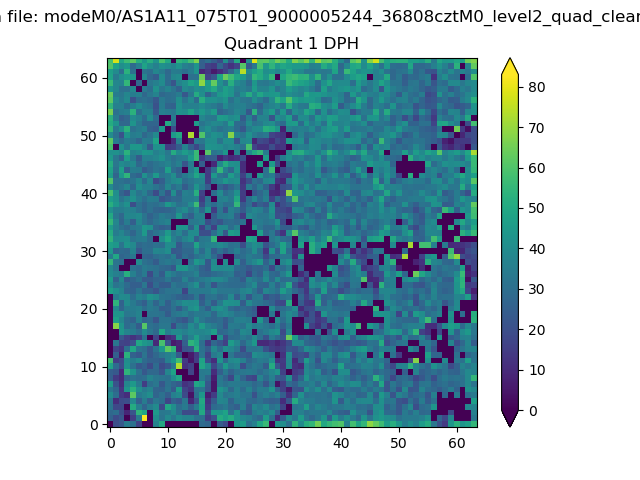
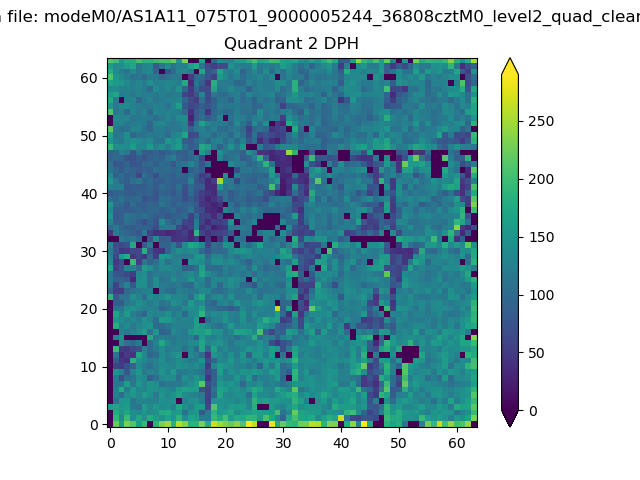
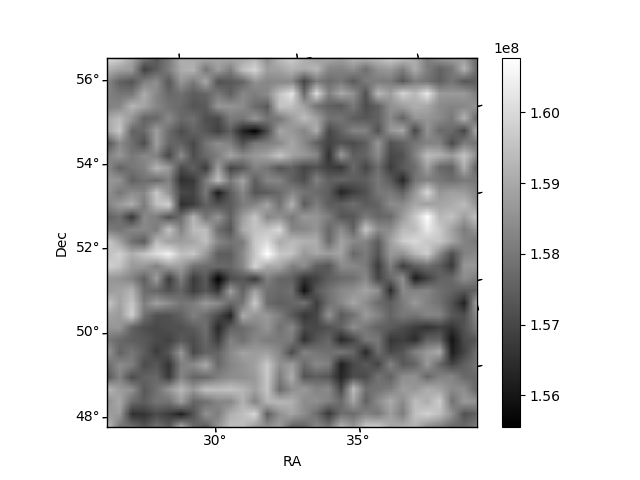
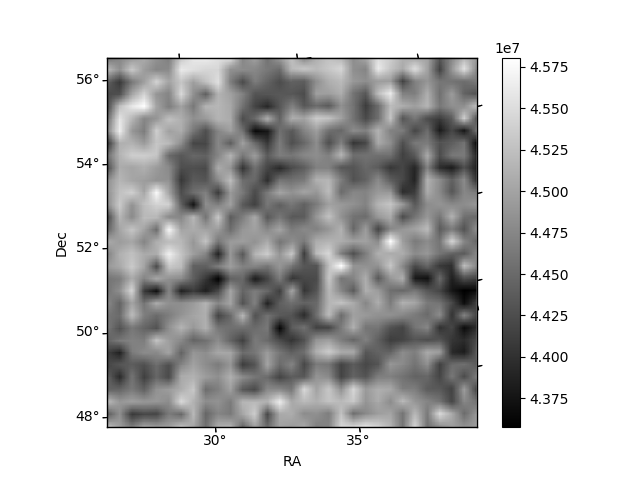
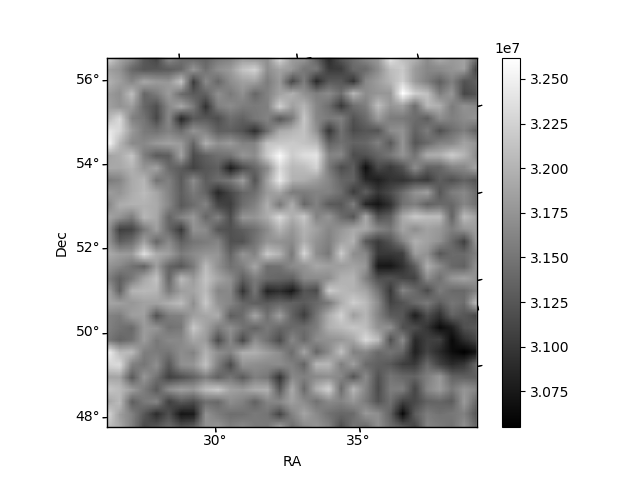
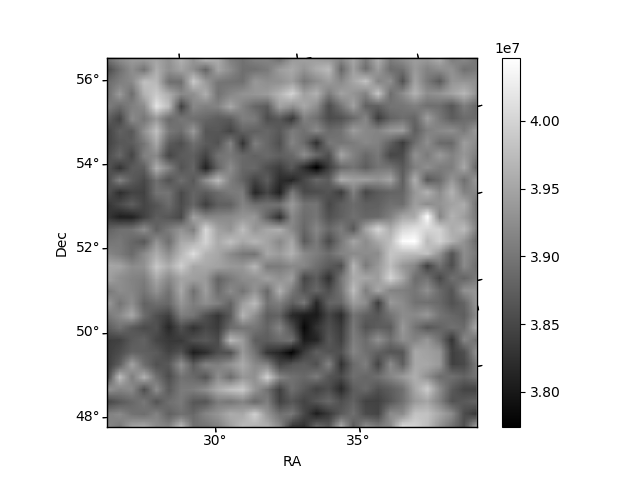
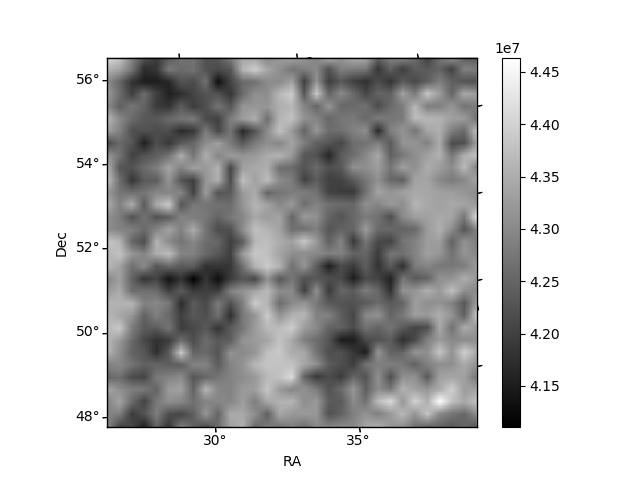
Histogram calculated using DETX and DETY for each event in the final _common_clean file
| Quadrant A | 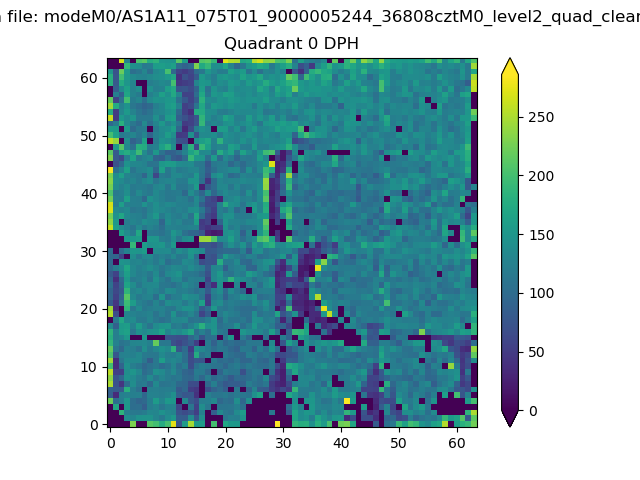 |
 |
Quadrant B |
|---|---|---|---|
| Quadrant D | 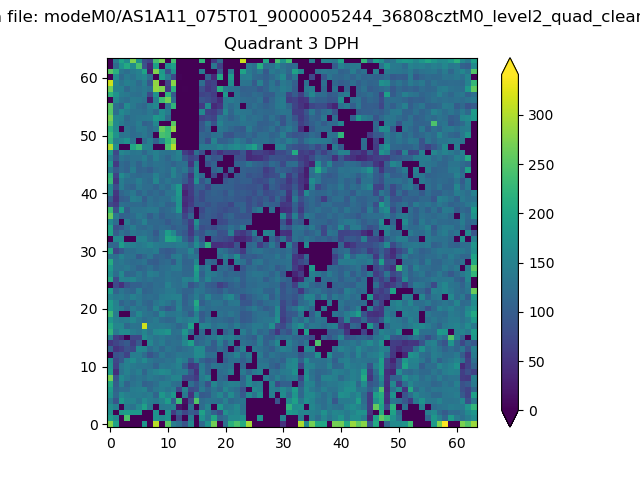 |
 |
Quadrant C |
| Plot type | Count rate plots | Images |
|---|---|---|
| Comparison with Poisson distribution Blue bars denote a histogram of data divided into 1 sec bins. Red curve is a Poisson curve with rate = median count rate of data. |
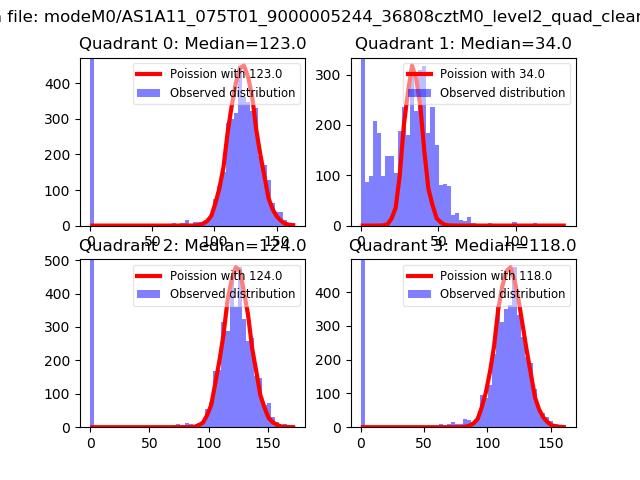 |
 |
| Quadrant-wise count rates Data is divided into 100 sec bins |
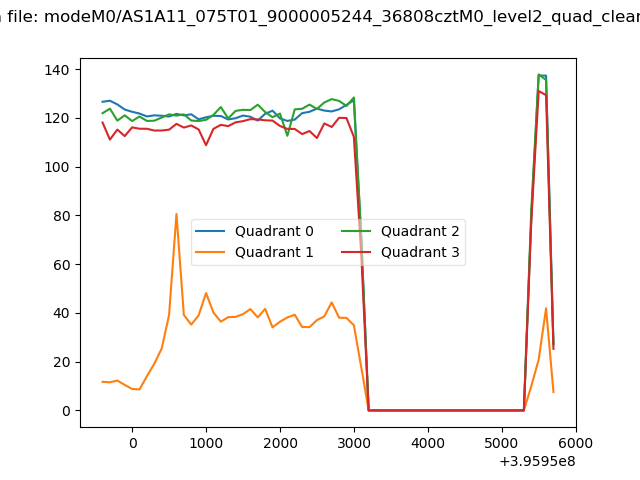 |
|
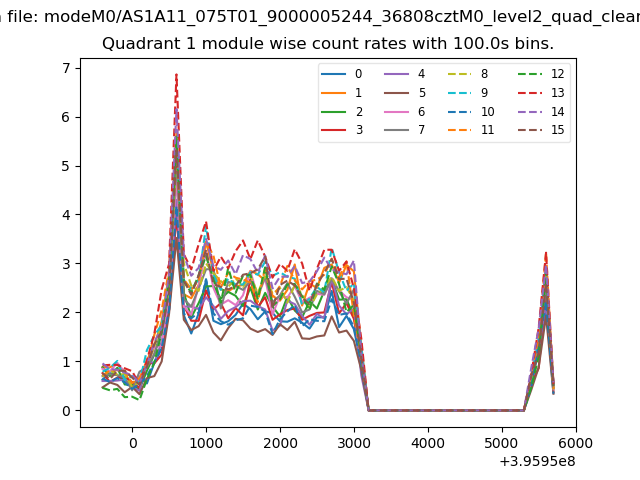
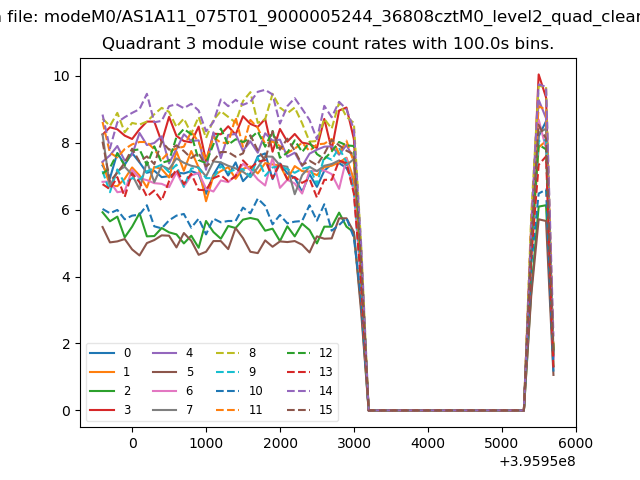
| Module-wise count rates for Quadrant A Data is divided into 100 sec bins |
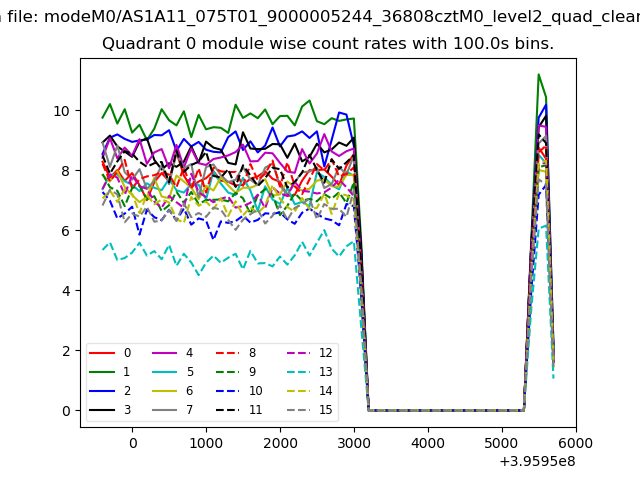 |
 |
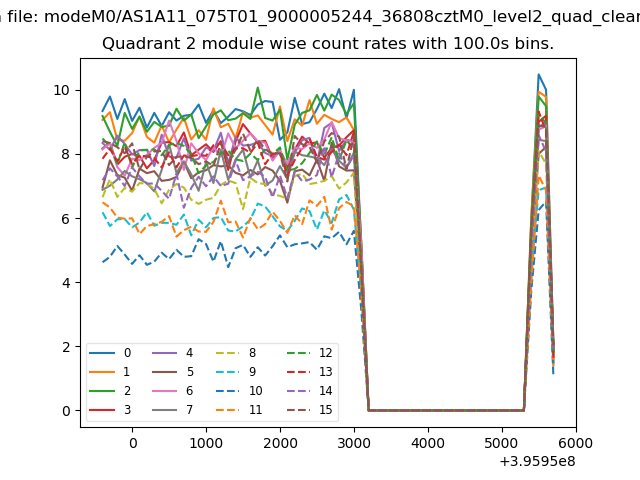
| Module-wise count rates for Quadrant B Data is divided into 100 sec bins |
 |
 |
| Module-wise count rates for Quadrant C Data is divided into 100 sec bins |
 |
 |
| Module-wise count rates for Quadrant D Data is divided into 100 sec bins |
 |
 |
| Parameter | Plot |
|---|---|
| CZT HV Monitor | 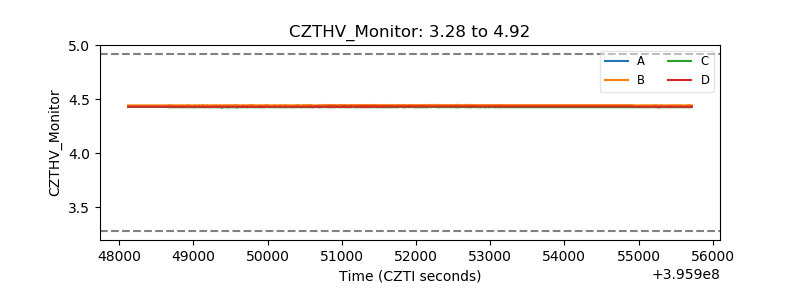 |
| D_VDD | 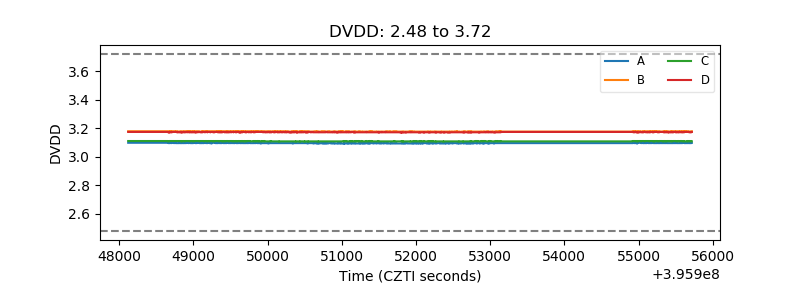 |
| Temperature 1 | 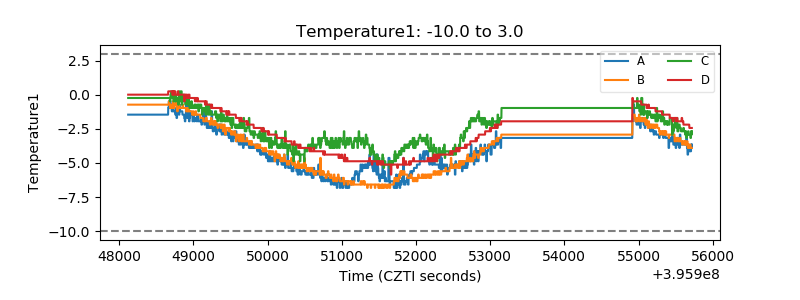 |
| Veto HV Monitor |  |
| Veto LLD | 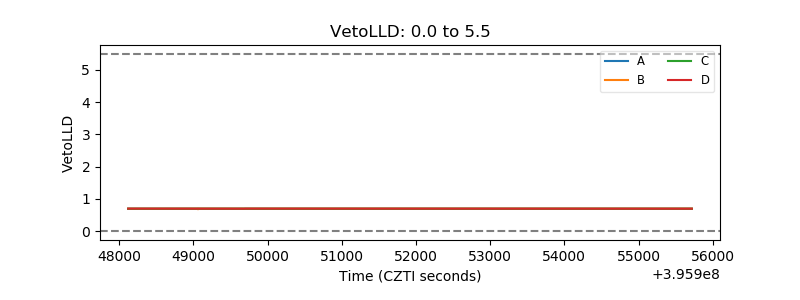 |
| Alpha Counter | 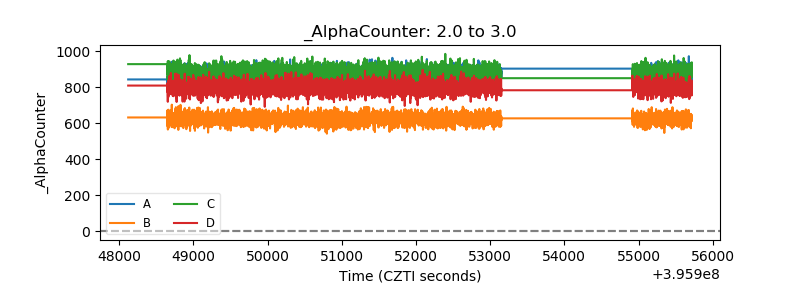 |
| _CPM_Rate | 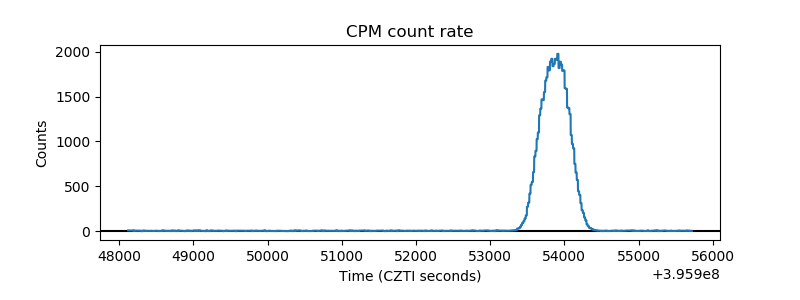 |
| CZT Counter |  |
| +2.5 Volts monitor |  |
| +5 Volts monitor |  |
| _ROLL_ROT | 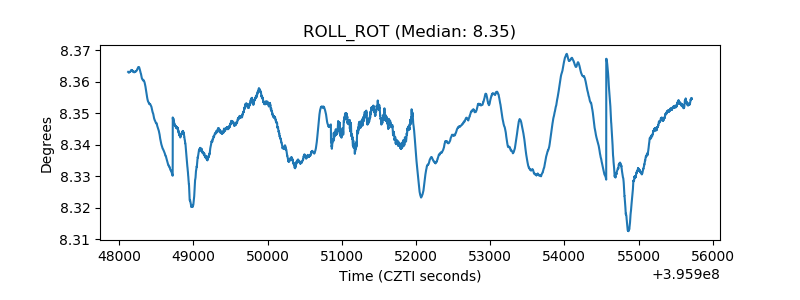 |
| _Roll_DEC |  |
| _Roll_RA | 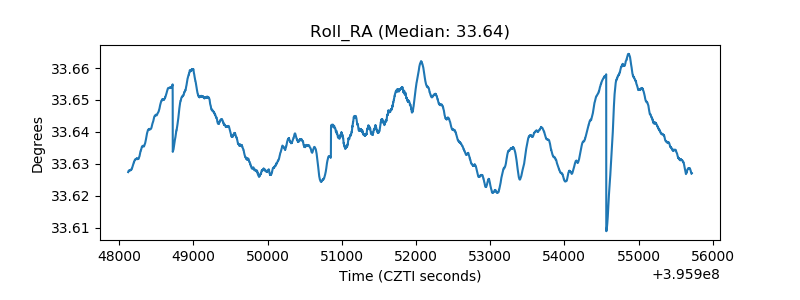 |
| Veto Counter | 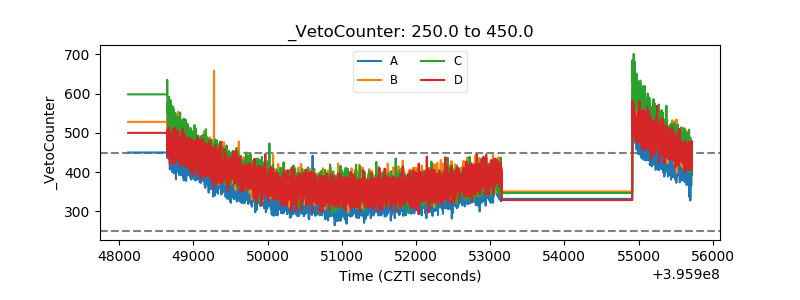 |