| Param | Original file | Final file |
|---|---|---|
| Filename | modeM0/AS1A11_075T01_9000005244_36809cztM0_level2.evt | modeM0/AS1A11_075T01_9000005244_36809cztM0_level2_quad_clean.evt |
| Size (bytes) | 816,661,440 | 73,607,040 |
| Size | 778.8 MB | 70.2 MB |
| Events in quadrant A | 2,913,449 | 582,715 |
| Events in quadrant B | 13,160,454 | 181,413 |
| Events in quadrant C | 2,891,534 | 595,666 |
| Events in quadrant D | 5,421,101 | 507,226 |
| Mode SS | |||
|---|---|---|---|
| Quadrant | BADHDUFLAG | Total packets | Discarded packets |
| A | 0 | 106 | 0 |
| B | 0 | 106 | 0 |
| C | 0 | 106 | 0 |
| D | 0 | 106 | 0 |
| Mode M0 | |||
|---|---|---|---|
| Quadrant | BADHDUFLAG | Total packets | Discarded packets |
| A | 0 | 12054 | 3 |
| B | 0 | 42572 | 2 |
| C | 0 | 11741 | 2 |
| D | 0 | 19783 | 2 |
| Mode M9 | |||
|---|---|---|---|
| Quadrant | BADHDUFLAG | Total packets | Discarded packets |
| A | 0 | 33 | 0 |
| B | 0 | 33 | 0 |
| C | 0 | 33 | 0 |
| D | 0 | 34 | 0 |
| Quadrant | Total seconds | Saturated seconds | Saturation percentage |
|---|---|---|---|
| A | 5125 | 34 | 0.663415% |
| B | 5125 | 4922 | 96.039024% |
| C | 5125 | 92 | 1.795122% |
| D | 5125 | 802 | 15.648780% |
Noise dominated data is calculated using 1-second bins in cleaned event files. If a bin has >2000 counts, and if more than 50% of those come from <1% of pixels, then it is considered to be noise-dominated and hence unusable.
| Quadrant | # 1 sec bins | Bins with >0 counts | Bins with >2000 counts | High rate bins dominated by noise | Noise dominated (total time) | Noise dominated (detector-on time) | Marked lightcurve |
|---|---|---|---|---|---|---|---|
| A | 7008 | 5126 | 23 | 23 | 0.33% | 0.45% | 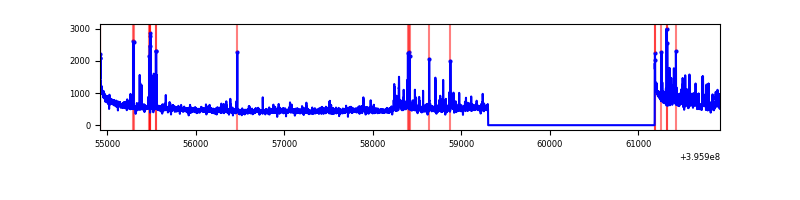 |
| B | 7007 | 5124 | 4818 | 4818 | 68.76% | 94.03% | 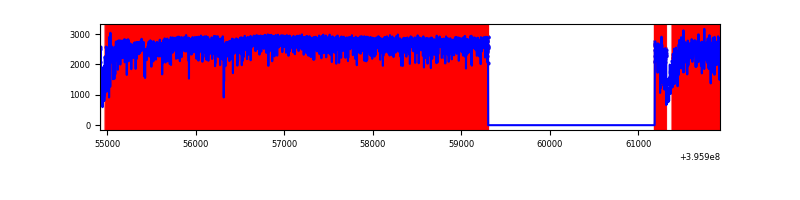 |
| C | 7008 | 5126 | 69 | 69 | 0.98% | 1.35% | 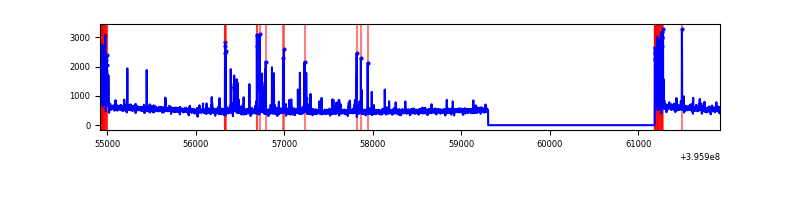 |
| D | 7008 | 5126 | 765 | 765 | 10.92% | 14.92% | 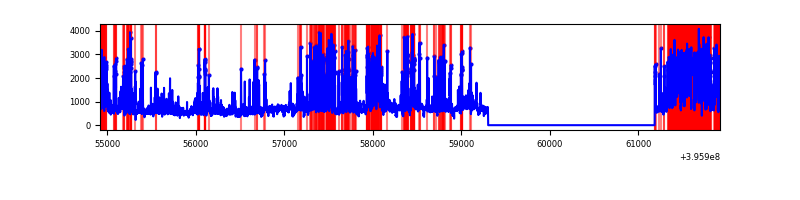 |
Top three noisy pixels from each quadrant. If the there are fewer than three noisy pixels in the level2.evt file, extra rows are filled as -1
| Pixel properties | Quadrant properties | ||||||
|---|---|---|---|---|---|---|---|
| Quadrant | DetID | PixID | Counts | Sigma | Mean | Median | Sigma |
| A | 14 | 235 | 283929 | 2321.39 | 599 | 588 | 122.1 |
| A | 10 | 83 | 231688 | 1893.38 | 599 | 588 | 122.1 |
| A | 13 | 248 | 61998 | 503.13 | 599 | 588 | 122.1 |
| B | 12 | 1 | 10788983 | 227282.09 | 242 | 237 | 47.5 |
| B | 5 | 172 | 1243386 | 26188.91 | 242 | 237 | 47.5 |
| B | 0 | 221 | 43675 | 915.09 | 242 | 237 | 47.5 |
| C | 15 | 214 | 219101 | 1585.02 | 592 | 595 | 137.9 |
| C | 0 | 10 | 188530 | 1363.26 | 592 | 595 | 137.9 |
| C | 14 | 254 | 159631 | 1153.63 | 592 | 595 | 137.9 |
| D | 12 | 3 | 1925211 | 14433.56 | 544 | 529 | 133.3 |
| D | 1 | 20 | 665695 | 4988.21 | 544 | 529 | 133.3 |
| D | 13 | 249 | 355186 | 2659.64 | 544 | 529 | 133.3 |
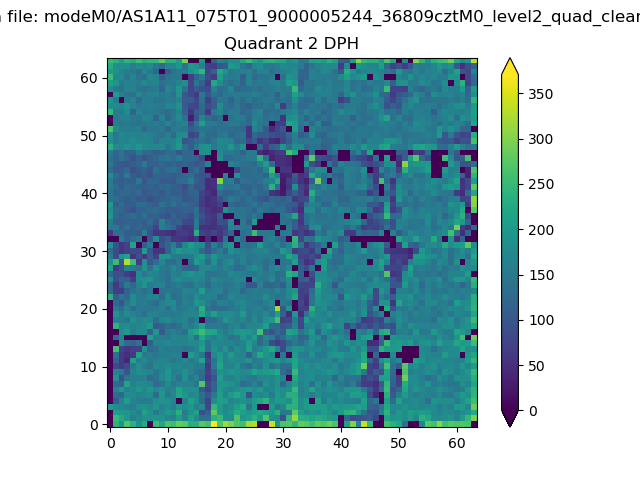
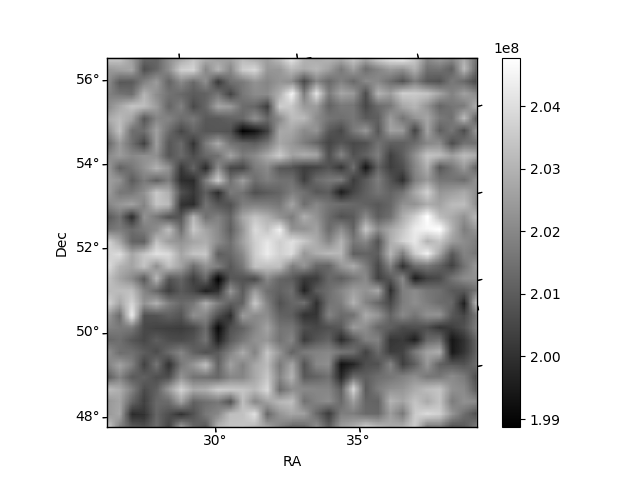
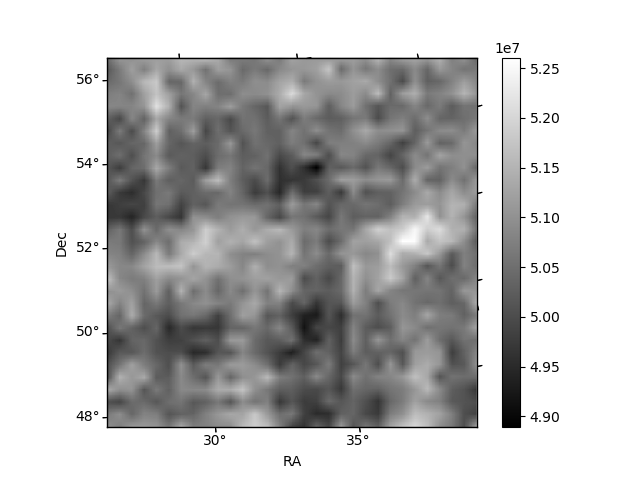
Histogram calculated using DETX and DETY for each event in the final _common_clean file
| Quadrant A | 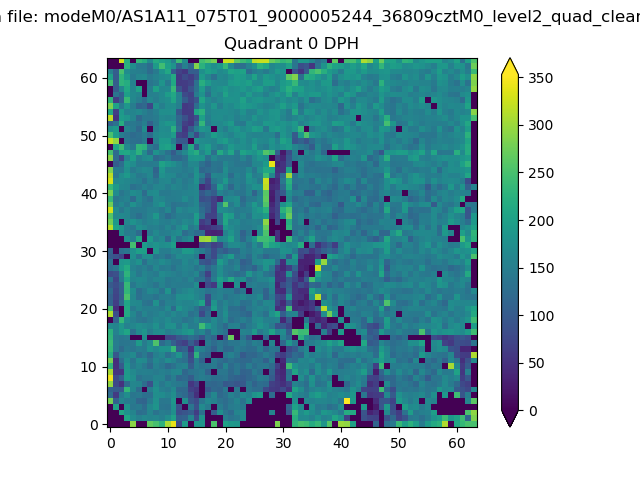 |
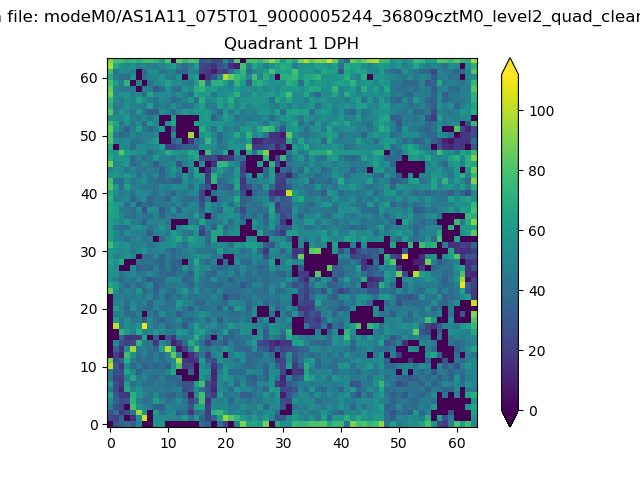 |
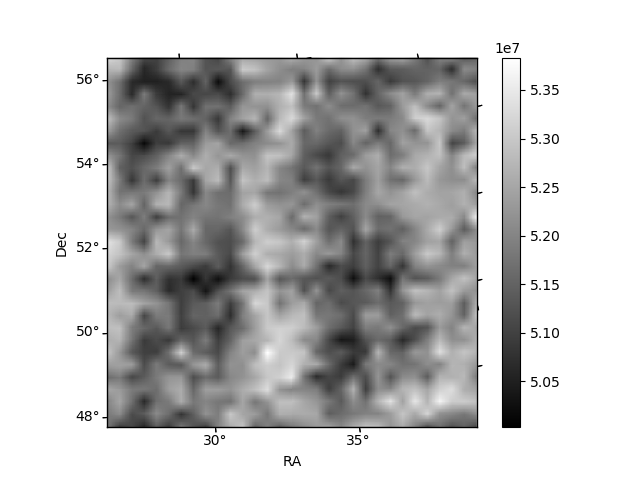
Quadrant B |
|---|---|---|---|
| Quadrant D | 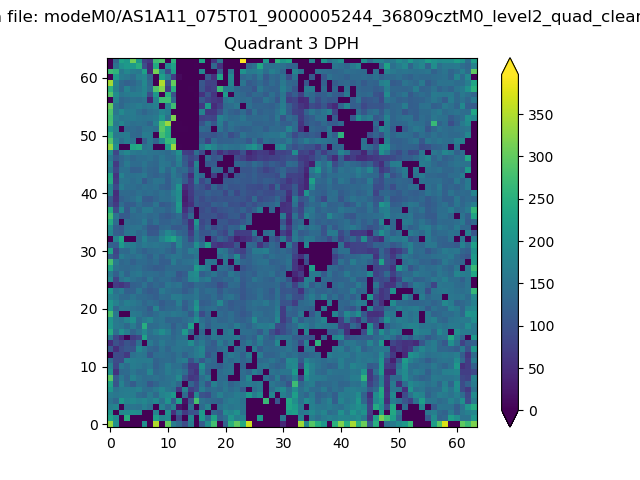 |
 |
Quadrant C |
| Plot type | Count rate plots | Images |
|---|---|---|
| Comparison with Poisson distribution Blue bars denote a histogram of data divided into 1 sec bins. Red curve is a Poisson curve with rate = median count rate of data. |
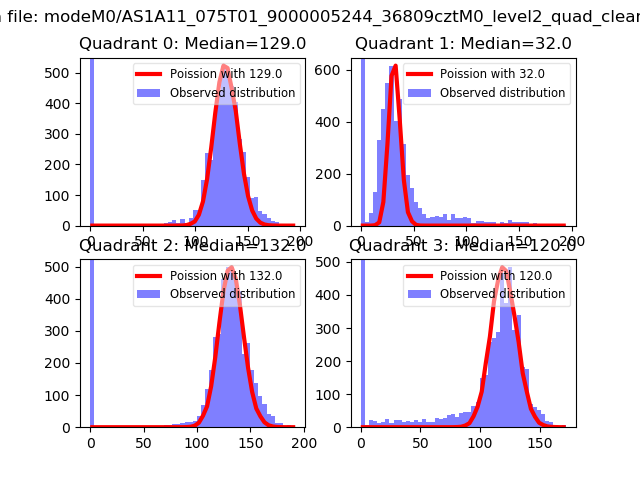 |
 |
| Quadrant-wise count rates Data is divided into 100 sec bins |
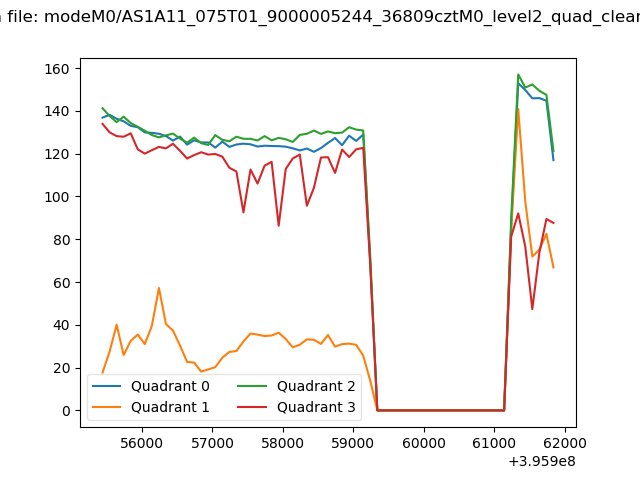 |
|
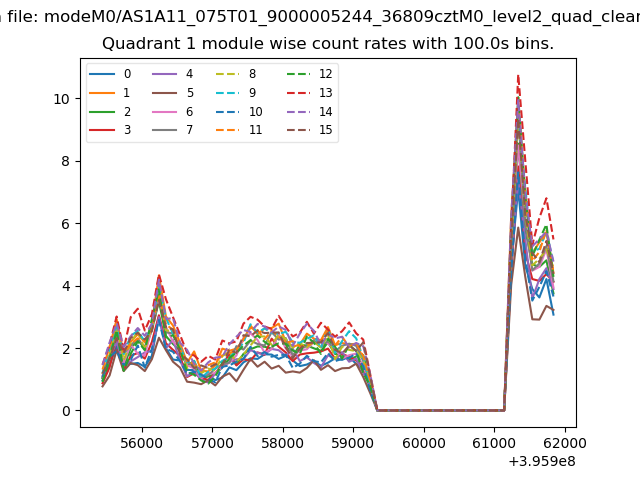
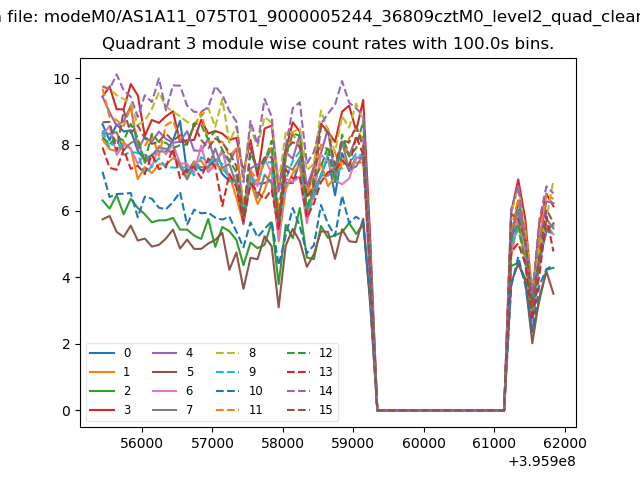
| Module-wise count rates for Quadrant A Data is divided into 100 sec bins |
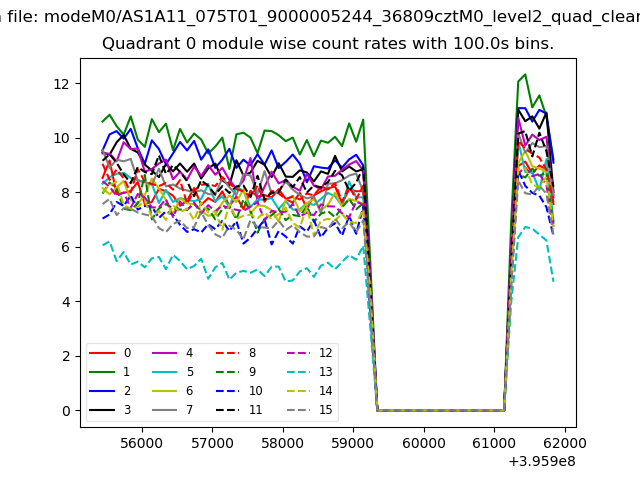 |
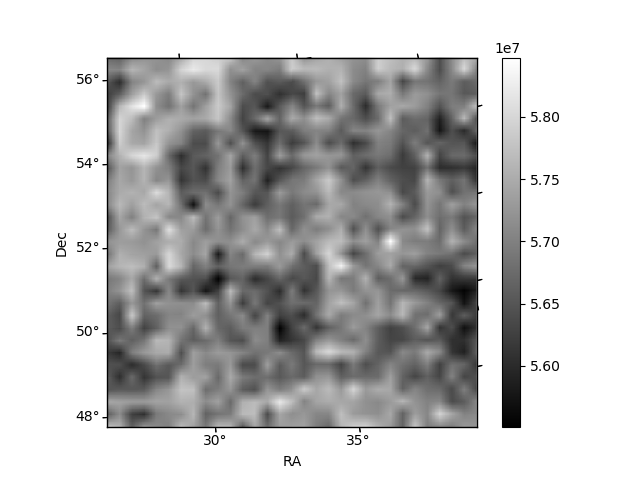 |
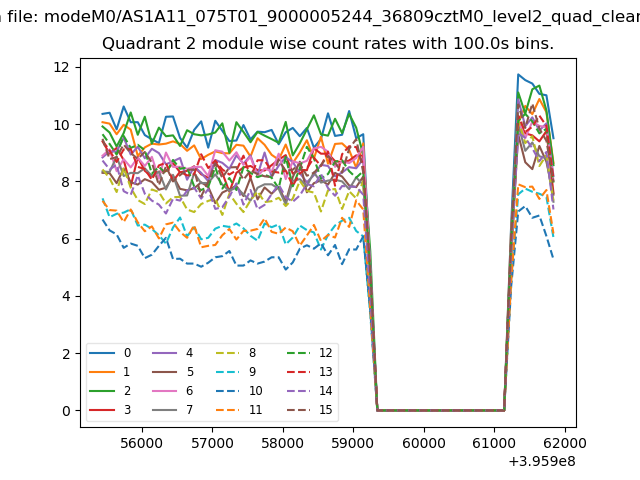
| Module-wise count rates for Quadrant B Data is divided into 100 sec bins |
 |
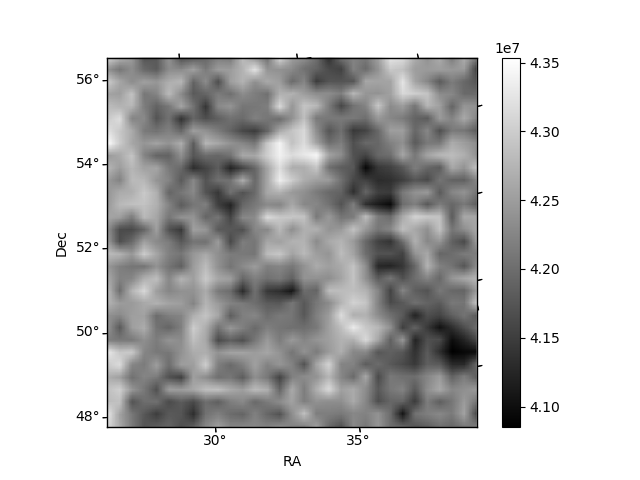 |
| Module-wise count rates for Quadrant C Data is divided into 100 sec bins |
 |
 |
| Module-wise count rates for Quadrant D Data is divided into 100 sec bins |
 |
 |
| Parameter | Plot |
|---|---|
| CZT HV Monitor | 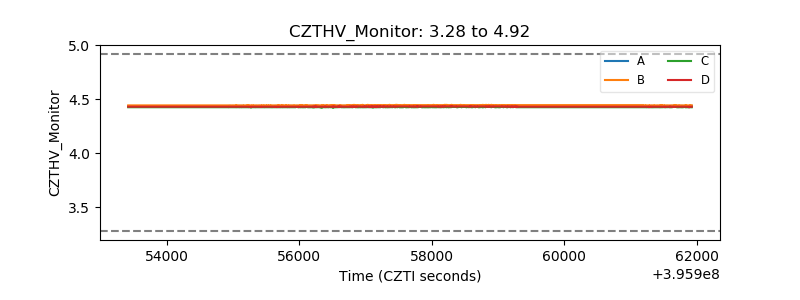 |
| D_VDD | 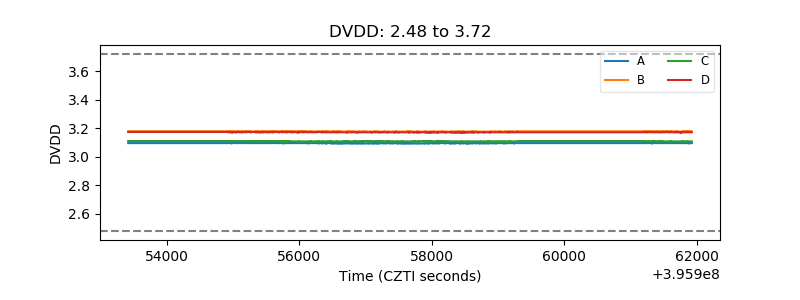 |
| Temperature 1 | 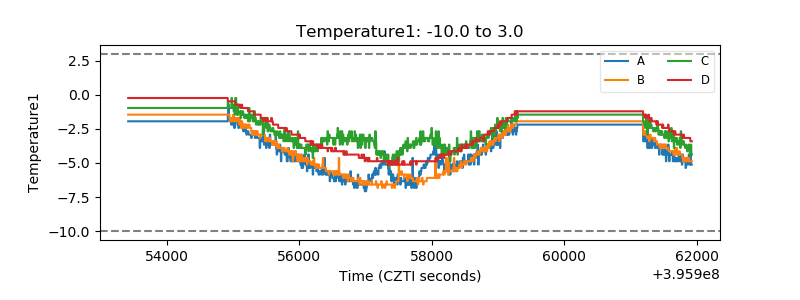 |
| Veto HV Monitor | 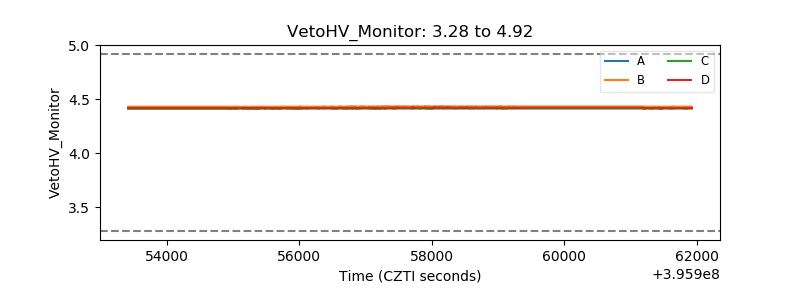 |
| Veto LLD | 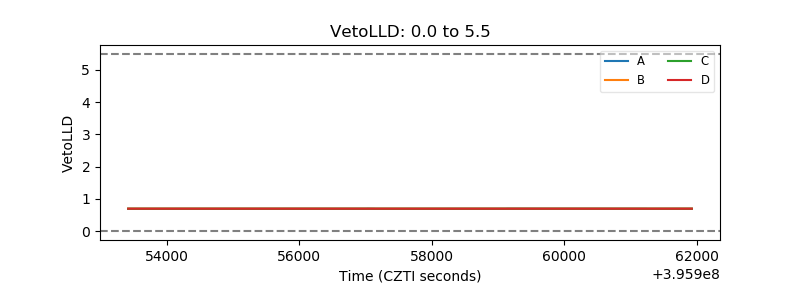 |
| Alpha Counter | 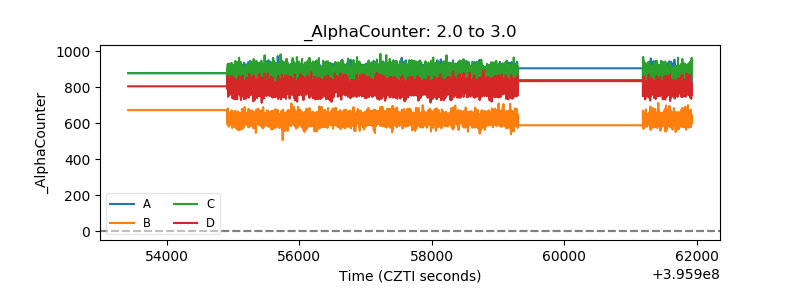 |
| _CPM_Rate | 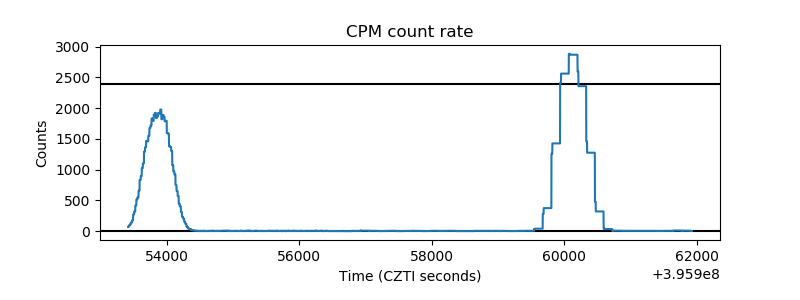 |
| CZT Counter | 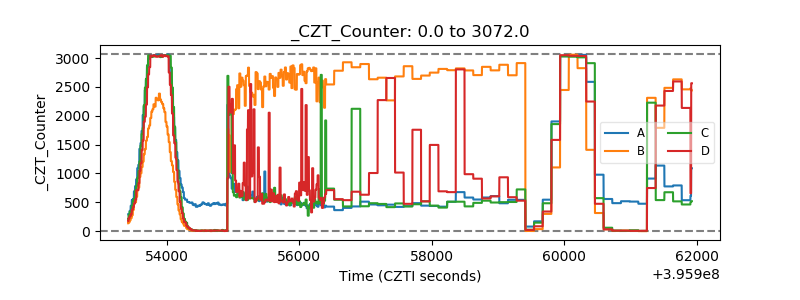 |
| +2.5 Volts monitor |  |
| +5 Volts monitor | 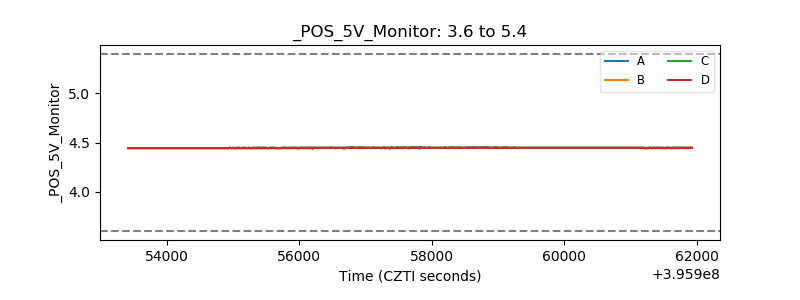 |
| _ROLL_ROT | 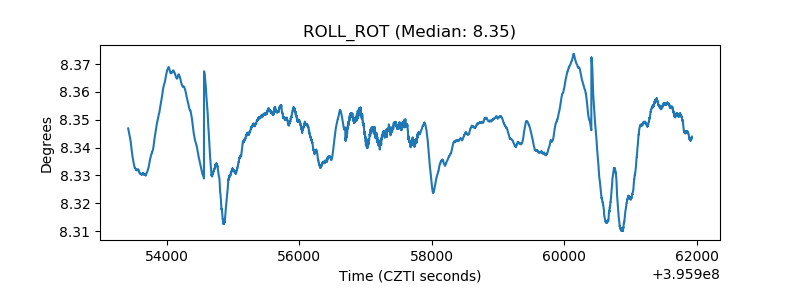 |
| _Roll_DEC | 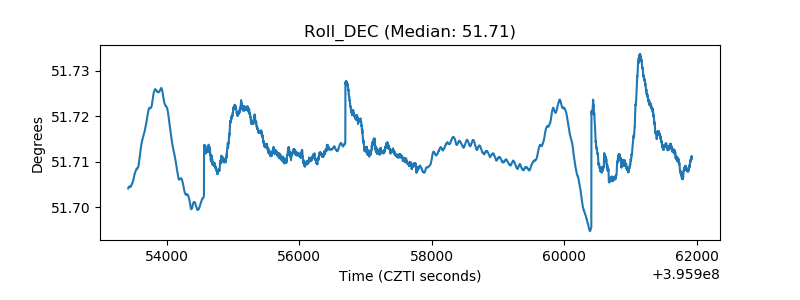 |
| _Roll_RA | 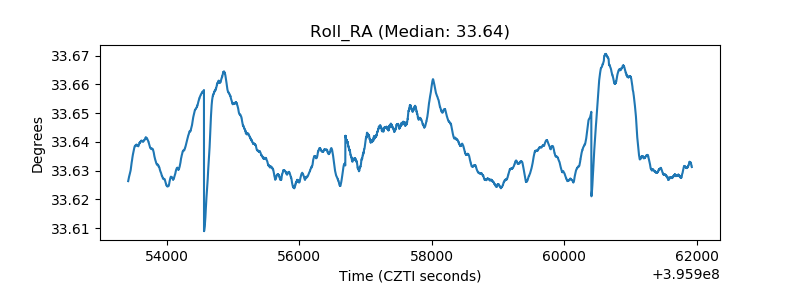 |
| Veto Counter | 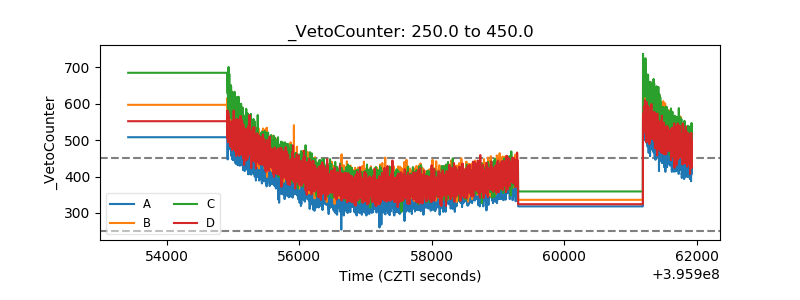 |