| Param | Original file | Final file |
|---|---|---|
| Filename | modeM0/AS1A11_075T01_9000005244_36812cztM0_level2.evt | modeM0/AS1A11_075T01_9000005244_36812cztM0_level2_quad_clean.evt |
| Size (bytes) | 566,674,560 | 76,668,480 |
| Size | 540.4 MB | 73.1 MB |
| Events in quadrant A | 2,425,838 | 509,324 |
| Events in quadrant B | 8,920,912 | 461,008 |
| Events in quadrant C | 2,600,399 | 524,035 |
| Events in quadrant D | 2,881,864 | 481,974 |
| Mode SS | |||
|---|---|---|---|
| Quadrant | BADHDUFLAG | Total packets | Discarded packets |
| A | 0 | 100 | 0 |
| B | 0 | 100 | 0 |
| C | 0 | 100 | 0 |
| D | 0 | 100 | 0 |
| Mode M0 | |||
|---|---|---|---|
| Quadrant | BADHDUFLAG | Total packets | Discarded packets |
| A | 0 | 10391 | 3 |
| B | 0 | 29872 | 2 |
| C | 0 | 10663 | 2 |
| D | 0 | 12002 | 2 |
| Mode M9 | |||
|---|---|---|---|
| Quadrant | BADHDUFLAG | Total packets | Discarded packets |
| A | 0 | 28 | 0 |
| B | 0 | 28 | 0 |
| C | 0 | 28 | 0 |
| D | 0 | 29 | 0 |
| Quadrant | Total seconds | Saturated seconds | Saturation percentage |
|---|---|---|---|
| A | 4913 | 7 | 0.142479% |
| B | 4913 | 2009 | 40.891512% |
| C | 4913 | 31 | 0.630979% |
| D | 4913 | 211 | 4.294728% |
Noise dominated data is calculated using 1-second bins in cleaned event files. If a bin has >2000 counts, and if more than 50% of those come from <1% of pixels, then it is considered to be noise-dominated and hence unusable.
| Quadrant | # 1 sec bins | Bins with >0 counts | Bins with >2000 counts | High rate bins dominated by noise | Noise dominated (total time) | Noise dominated (detector-on time) | Marked lightcurve |
|---|---|---|---|---|---|---|---|
| A | 7067 | 4914 | 2 | 2 | 0.03% | 0.04% | 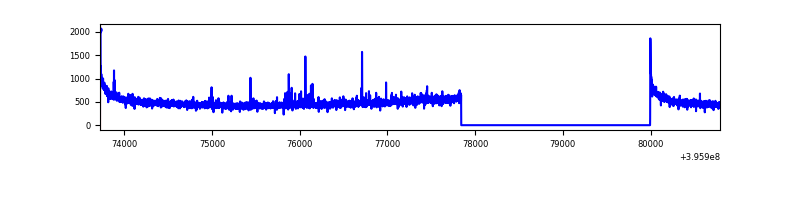 |
| B | 7067 | 4913 | 1985 | 1985 | 28.09% | 40.40% | 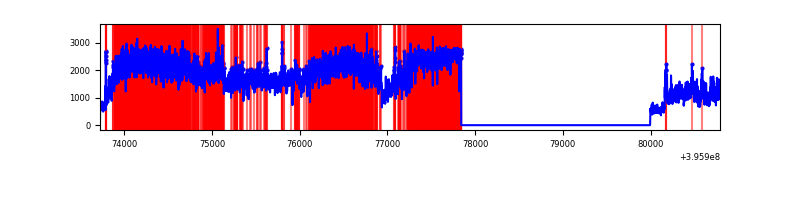 |
| C | 7067 | 4914 | 24 | 24 | 0.34% | 0.49% | 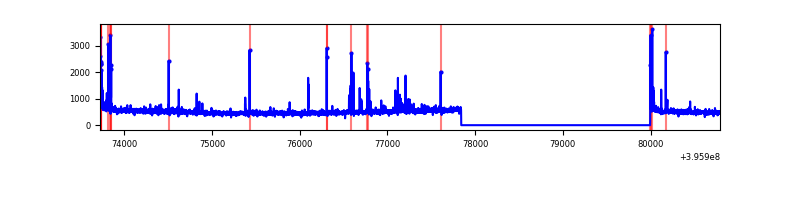 |
| D | 7067 | 4914 | 209 | 209 | 2.96% | 4.25% | 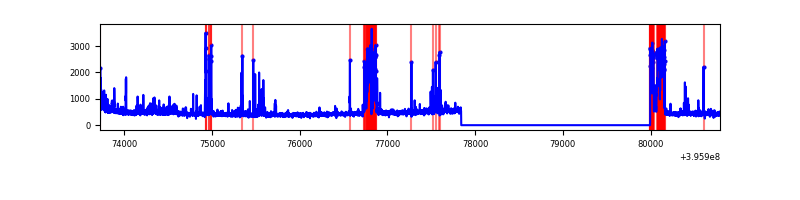 |
Top three noisy pixels from each quadrant. If the there are fewer than three noisy pixels in the level2.evt file, extra rows are filled as -1
| Pixel properties | Quadrant properties | ||||||
|---|---|---|---|---|---|---|---|
| Quadrant | DetID | PixID | Counts | Sigma | Mean | Median | Sigma |
| A | 10 | 83 | 203880 | 1821.63 | 560 | 551 | 111.6 |
| A | 9 | 143 | 22856 | 199.83 | 560 | 551 | 111.6 |
| A | 14 | 235 | 12973 | 111.29 | 560 | 551 | 111.6 |
| B | 12 | 1 | 6655714 | 71085.63 | 494 | 483 | 93.6 |
| B | 5 | 172 | 70026 | 742.8 | 494 | 483 | 93.6 |
| B | 5 | 255 | 52515 | 555.76 | 494 | 483 | 93.6 |
| C | 15 | 214 | 211177 | 1652.52 | 552 | 557 | 127.5 |
| C | 14 | 254 | 108674 | 848.28 | 552 | 557 | 127.5 |
| C | 0 | 10 | 86329 | 672.96 | 552 | 557 | 127.5 |
| D | 13 | 249 | 555047 | 4258.36 | 534 | 520 | 130.2 |
| D | 2 | 250 | 73530 | 560.66 | 534 | 520 | 130.2 |
| D | 13 | 171 | 63931 | 486.95 | 534 | 520 | 130.2 |
Histogram calculated using DETX and DETY for each event in the final _common_clean file
| Quadrant A | 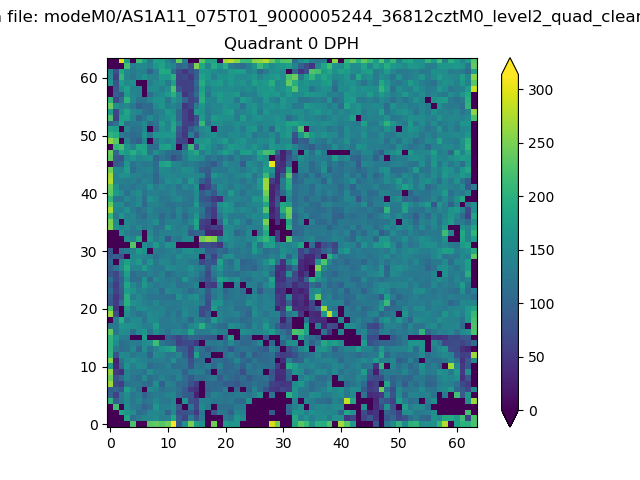 |
 |
Quadrant B |
|---|---|---|---|
| Quadrant D | 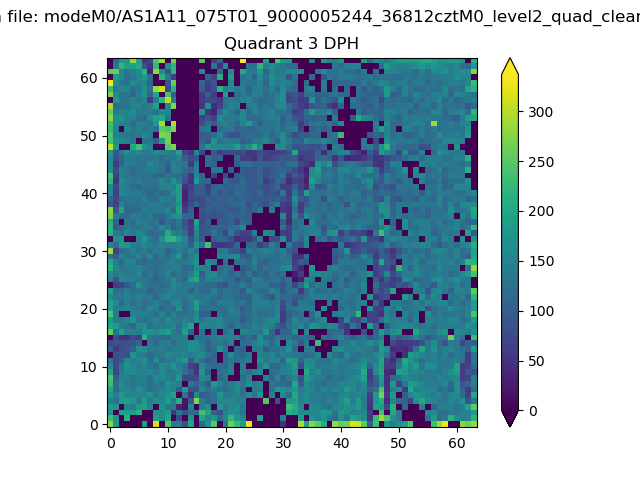 |
 |
Quadrant C |
| Plot type | Count rate plots | Images |
|---|---|---|
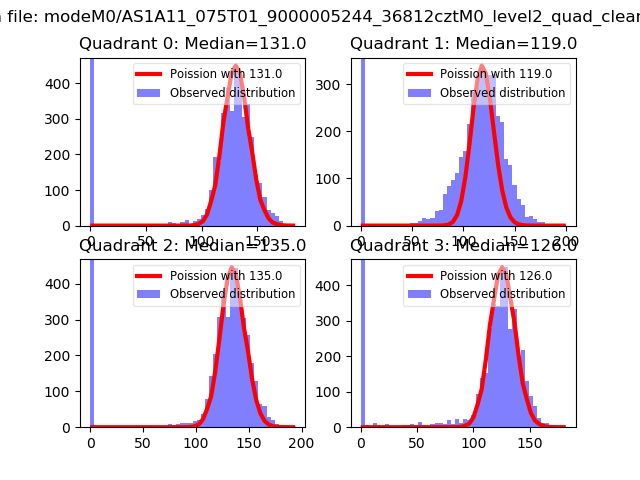
| Comparison with Poisson distribution Blue bars denote a histogram of data divided into 1 sec bins. Red curve is a Poisson curve with rate = median count rate of data. |
 |
 |
| Quadrant-wise count rates Data is divided into 100 sec bins |
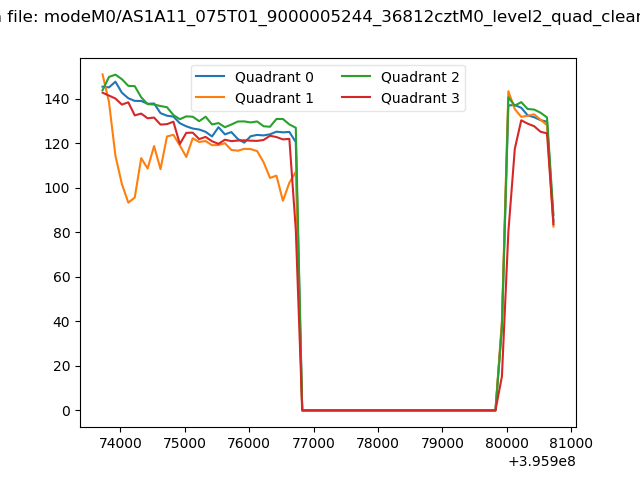 |
|
| Module-wise count rates for Quadrant A Data is divided into 100 sec bins |
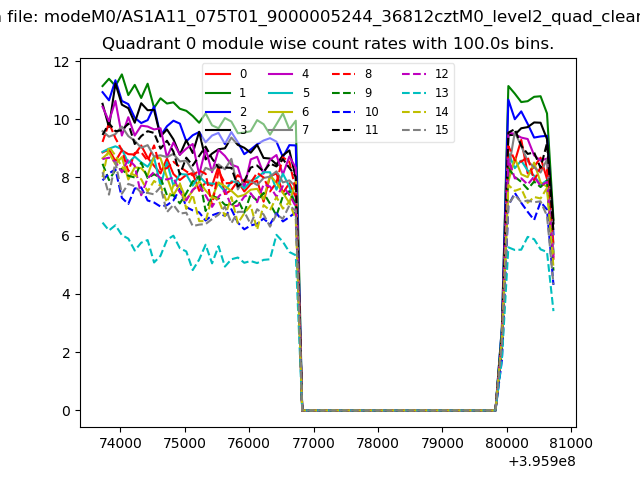 |
 |
| Module-wise count rates for Quadrant B Data is divided into 100 sec bins |
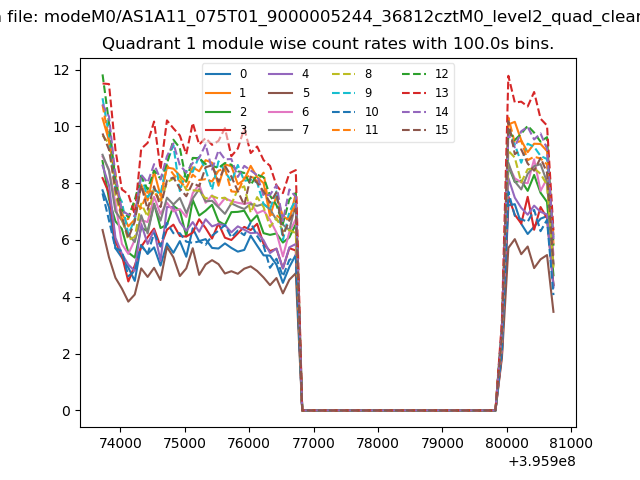 |
 |
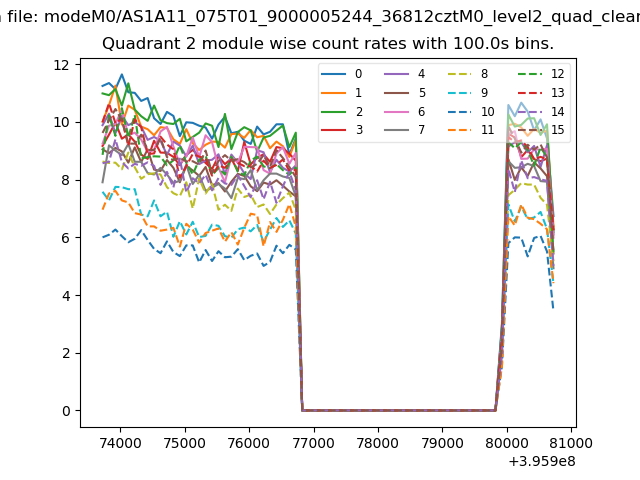
| Module-wise count rates for Quadrant C Data is divided into 100 sec bins |
 |
 |
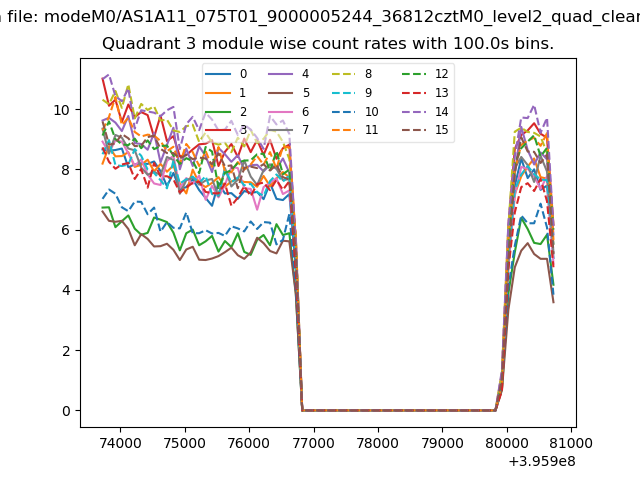
| Module-wise count rates for Quadrant D Data is divided into 100 sec bins |
 |
 |
| Parameter | Plot |
|---|---|
| CZT HV Monitor | 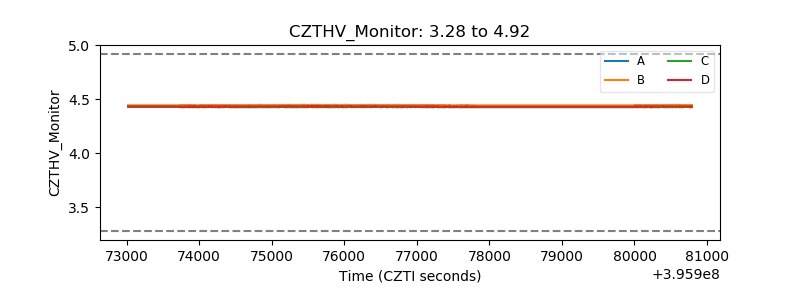 |
| D_VDD | 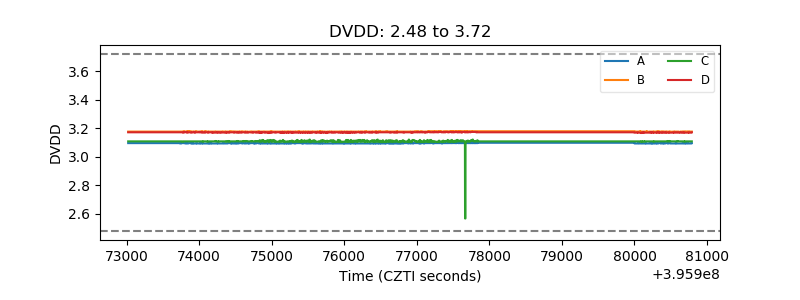 |
| Temperature 1 |  |
| Veto HV Monitor | 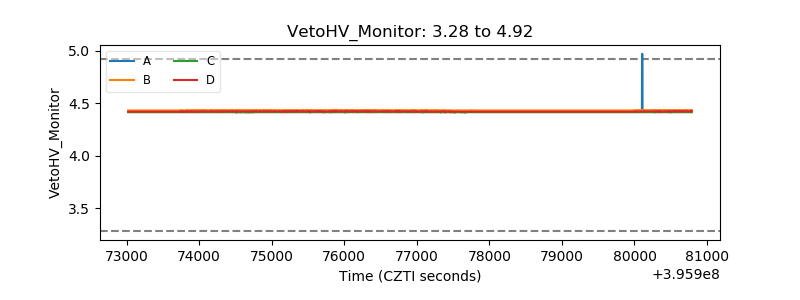 |
| Veto LLD |  |
| Alpha Counter | 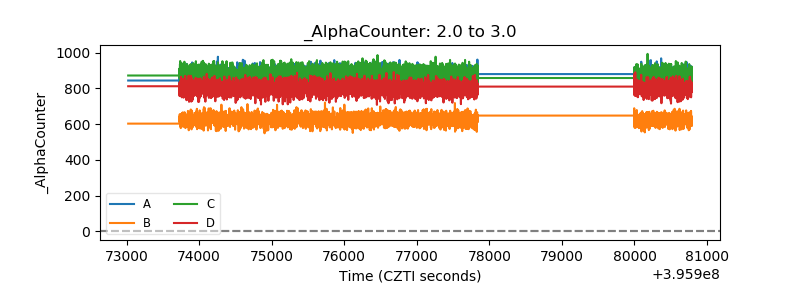 |
| _CPM_Rate | 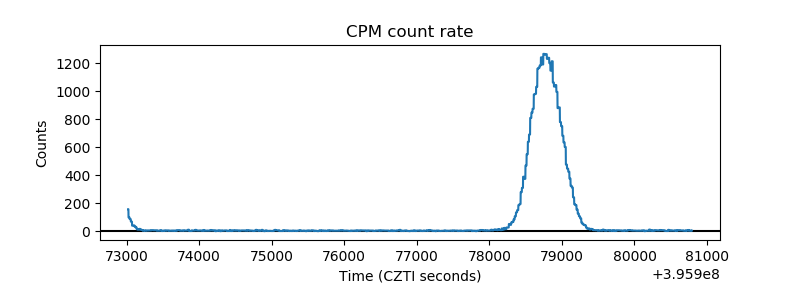 |
| CZT Counter | 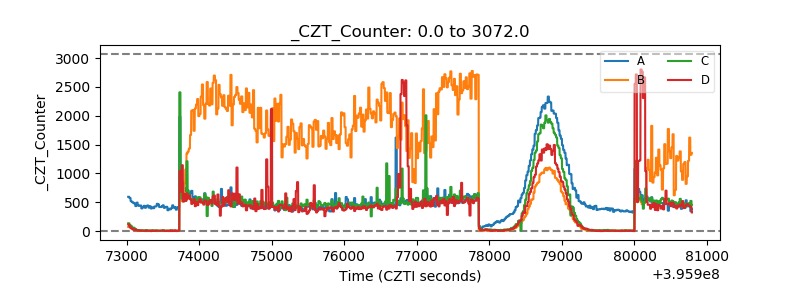 |
| +2.5 Volts monitor |  |
| +5 Volts monitor | 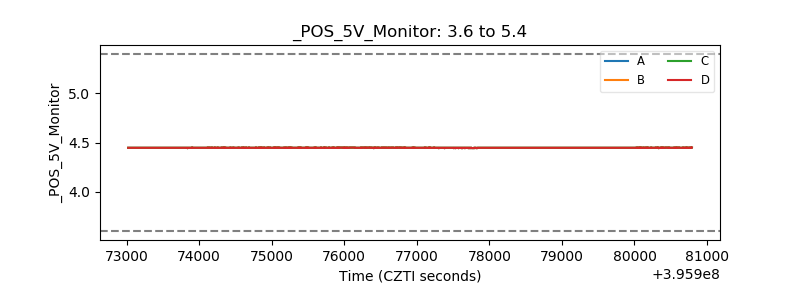 |
| _ROLL_ROT | 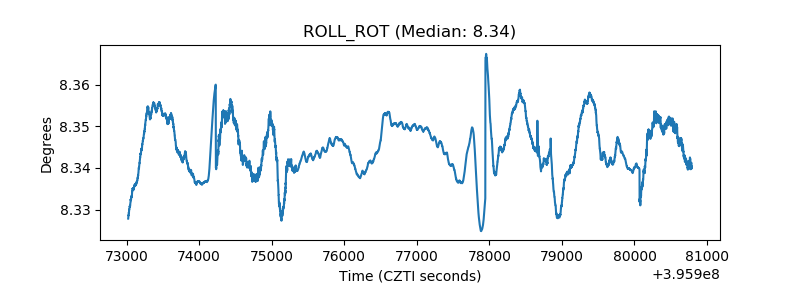 |
| _Roll_DEC | 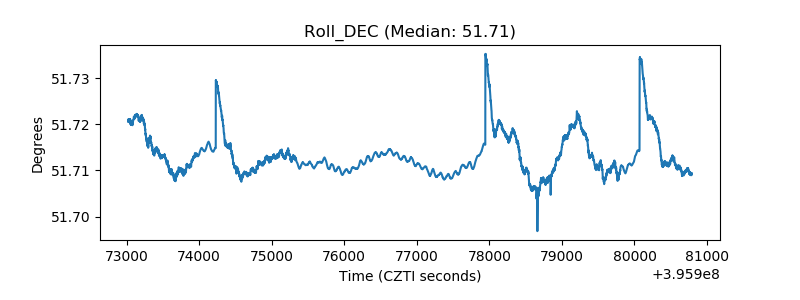 |
| _Roll_RA | 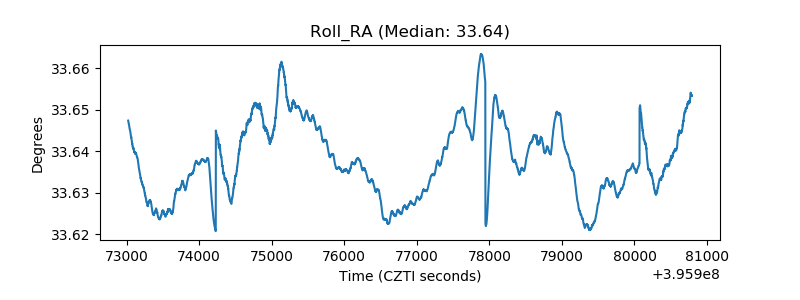 |
| Veto Counter | 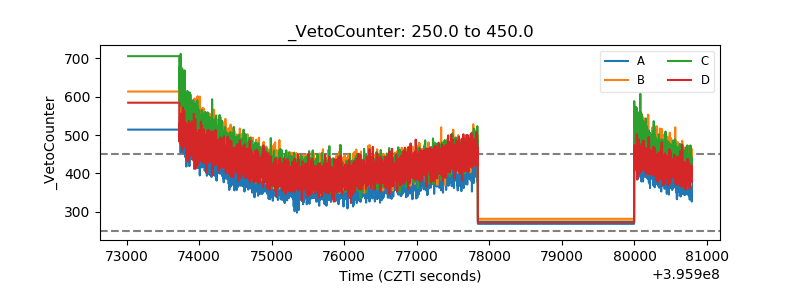 |