| Param | Original file | Final file |
|---|---|---|
| Filename | modeM0/AS1A11_075T01_9000005244_36813cztM0_level2.evt | modeM0/AS1A11_075T01_9000005244_36813cztM0_level2_quad_clean.evt |
| Size (bytes) | 65,799,360 | 17,133,120 |
| Size | 62.8 MB | 16.3 MB |
| Events in quadrant A | 429,710 | 111,710 |
| Events in quadrant B | 593,854 | 114,759 |
| Events in quadrant C | 437,029 | 112,922 |
| Events in quadrant D | 466,547 | 107,554 |
| Mode SS | |||
|---|---|---|---|
| Quadrant | BADHDUFLAG | Total packets | Discarded packets |
| A | 0 | 20 | 0 |
| B | 0 | 20 | 2 |
| C | 0 | 20 | 2 |
| D | 0 | 20 | 0 |
| Mode M0 | |||
|---|---|---|---|
| Quadrant | BADHDUFLAG | Total packets | Discarded packets |
| A | 0 | 2081 | 198 |
| B | 0 | 2530 | 141 |
| C | 0 | 2146 | 256 |
| D | 0 | 2277 | 202 |
| Quadrant | Total seconds | Saturated seconds | Saturation percentage |
|---|---|---|---|
| A | 915 | 2 | 0.218579% |
| B | 924 | 3 | 0.324675% |
| C | 907 | 2 | 0.220507% |
| D | 913 | 21 | 2.300110% |
Noise dominated data is calculated using 1-second bins in cleaned event files. If a bin has >2000 counts, and if more than 50% of those come from <1% of pixels, then it is considered to be noise-dominated and hence unusable.
| Quadrant | # 1 sec bins | Bins with >0 counts | Bins with >2000 counts | High rate bins dominated by noise | Noise dominated (total time) | Noise dominated (detector-on time) | Marked lightcurve |
|---|---|---|---|---|---|---|---|
| A | 982 | 941 | 0 | 0 | 0.00% | 0.00% | 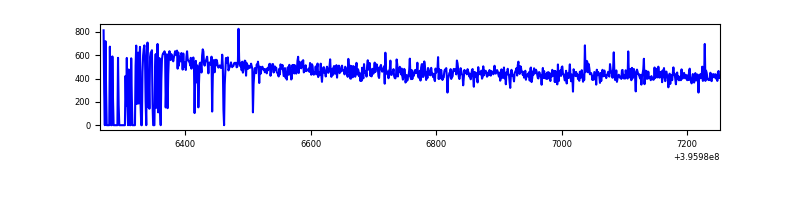 |
| B | 979 | 946 | 3 | 3 | 0.31% | 0.32% | 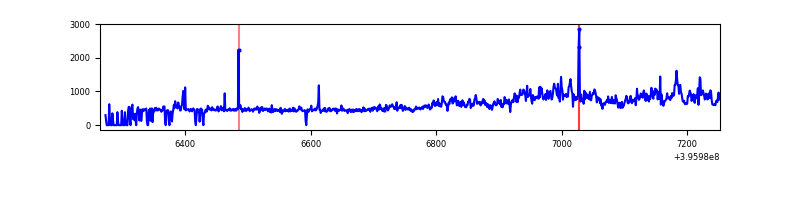 |
| C | 974 | 929 | 1 | 1 | 0.10% | 0.11% | 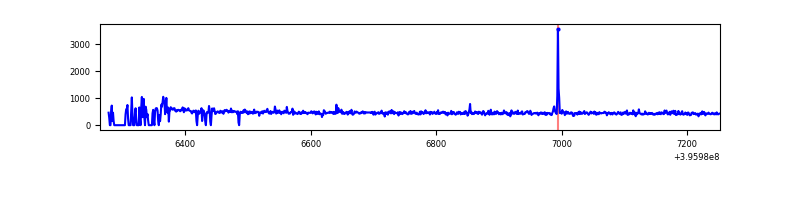 |
| D | 988 | 938 | 17 | 17 | 1.72% | 1.81% | 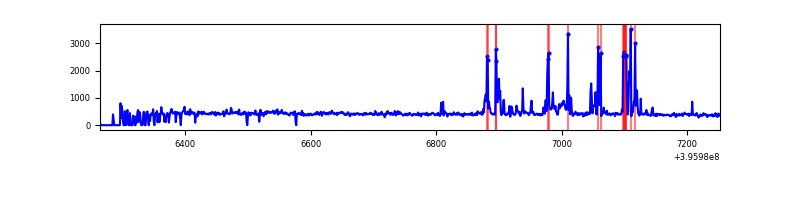 |
Top three noisy pixels from each quadrant. If the there are fewer than three noisy pixels in the level2.evt file, extra rows are filled as -1
| Pixel properties | Quadrant properties | ||||||
|---|---|---|---|---|---|---|---|
| Quadrant | DetID | PixID | Counts | Sigma | Mean | Median | Sigma |
| A | 10 | 83 | 49189 | 2262.32 | 96 | 94 | 21.7 |
| A | 14 | 235 | 4038 | 181.74 | 96 | 94 | 21.7 |
| A | 13 | 6 | 1649 | 71.66 | 96 | 94 | 21.7 |
| B | 12 | 1 | 169975 | 8060.07 | 98 | 96 | 21.1 |
| B | 0 | 190 | 8677 | 407.13 | 98 | 96 | 21.1 |
| B | 5 | 200 | 7458 | 349.3 | 98 | 96 | 21.1 |
| C | 15 | 214 | 41235 | 1736.44 | 94 | 94 | 23.7 |
| C | 14 | 254 | 17567 | 737.48 | 94 | 94 | 23.7 |
| C | 3 | 233 | 7272 | 302.96 | 94 | 94 | 23.7 |
| D | 13 | 249 | 74616 | 3078.21 | 92 | 89 | 24.2 |
| D | 2 | 153 | 21687 | 892.07 | 92 | 89 | 24.2 |
| D | 2 | 152 | 6818 | 277.93 | 92 | 89 | 24.2 |
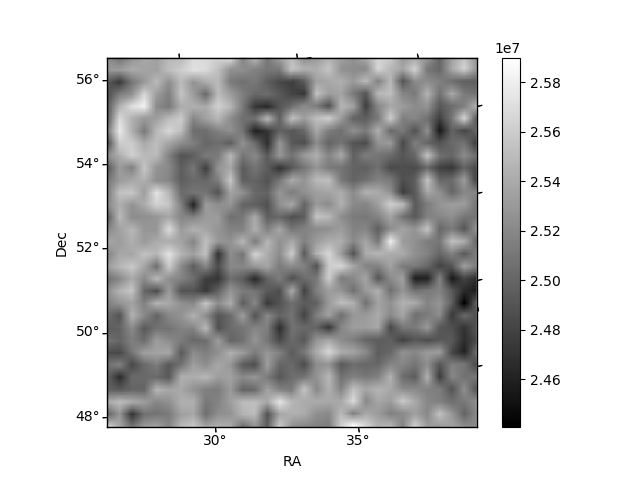
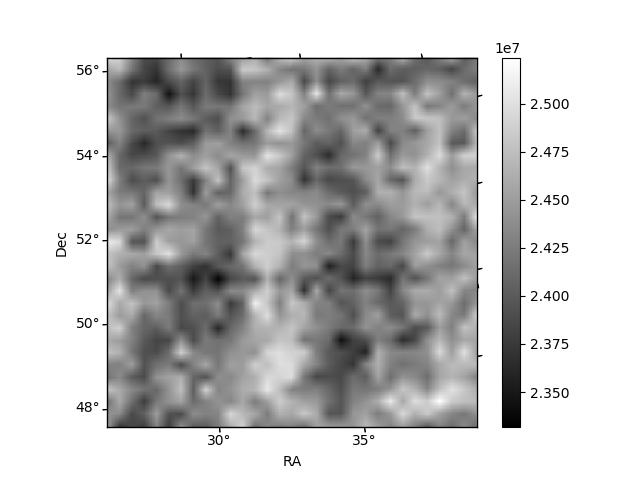
Histogram calculated using DETX and DETY for each event in the final _common_clean file
| Quadrant A | 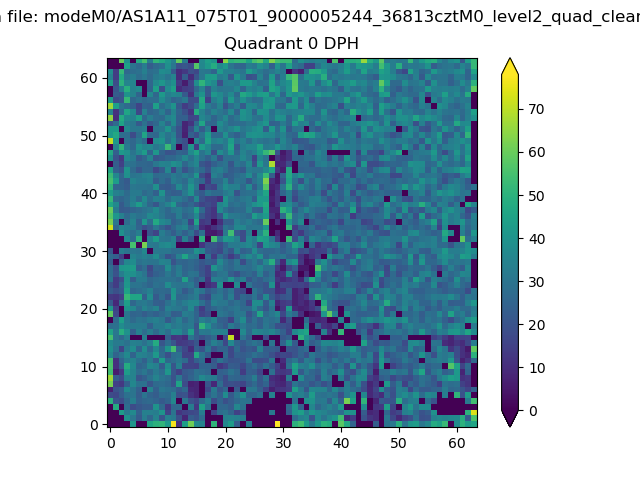 |
 |
Quadrant B |
|---|---|---|---|
| Quadrant D | 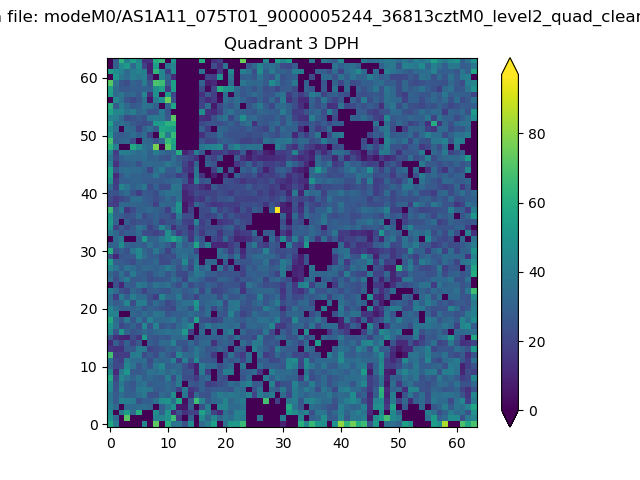 |
 |
Quadrant C |
| Plot type | Count rate plots | Images |
|---|---|---|
| Comparison with Poisson distribution Blue bars denote a histogram of data divided into 1 sec bins. Red curve is a Poisson curve with rate = median count rate of data. |
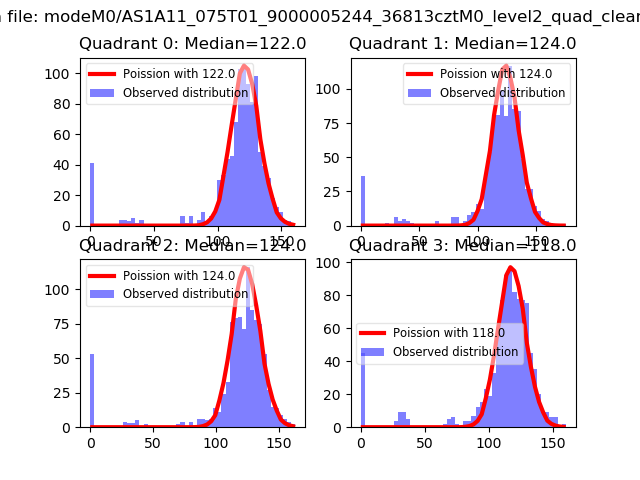 |
 |
| Quadrant-wise count rates Data is divided into 100 sec bins |
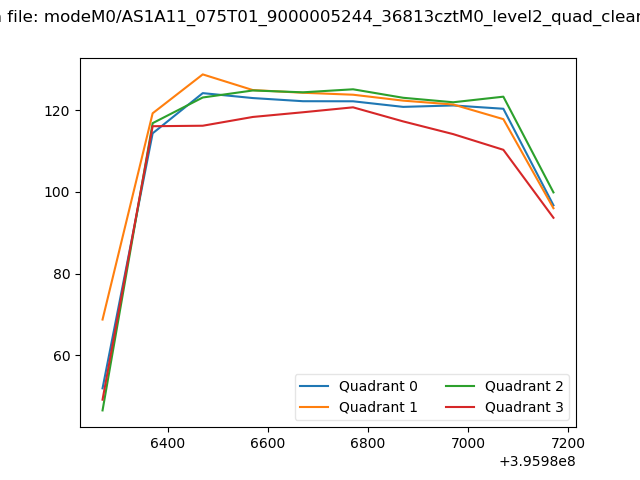 |
|
| Module-wise count rates for Quadrant A Data is divided into 100 sec bins |
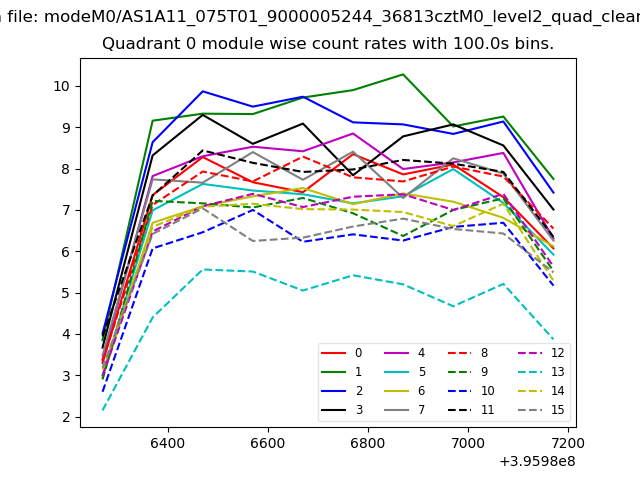 |
 |
| Module-wise count rates for Quadrant B Data is divided into 100 sec bins |
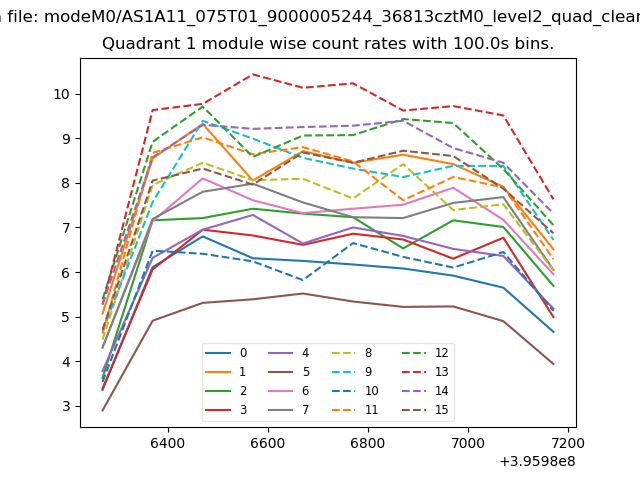 |
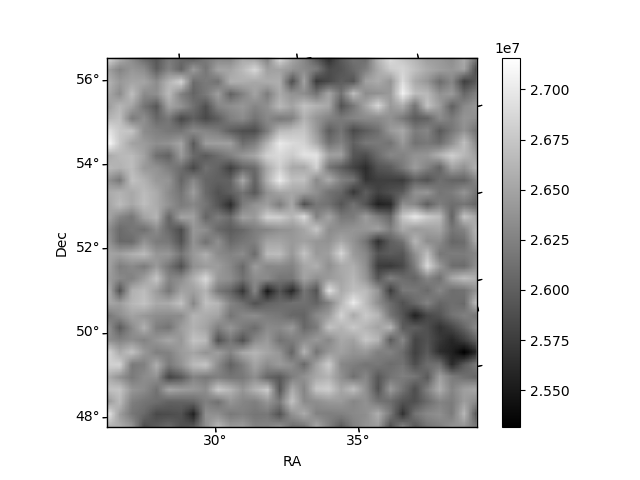 |
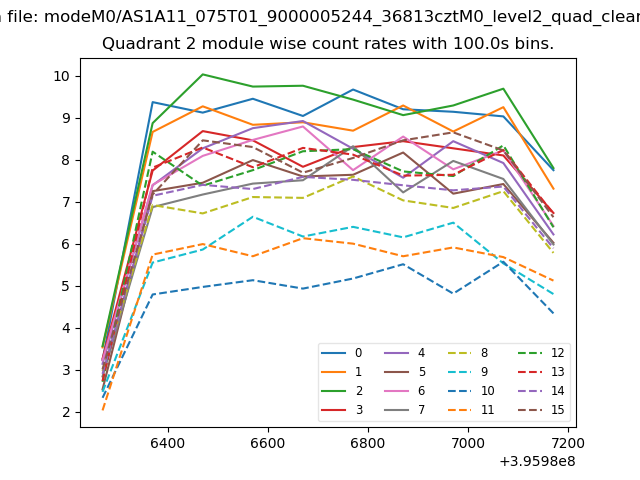
| Module-wise count rates for Quadrant C Data is divided into 100 sec bins |
 |
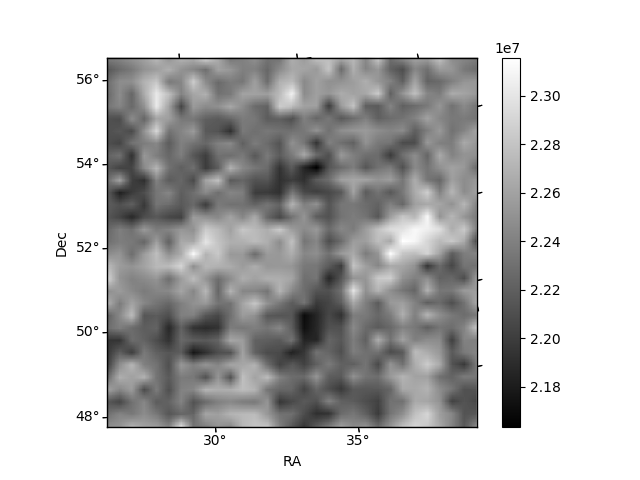 |
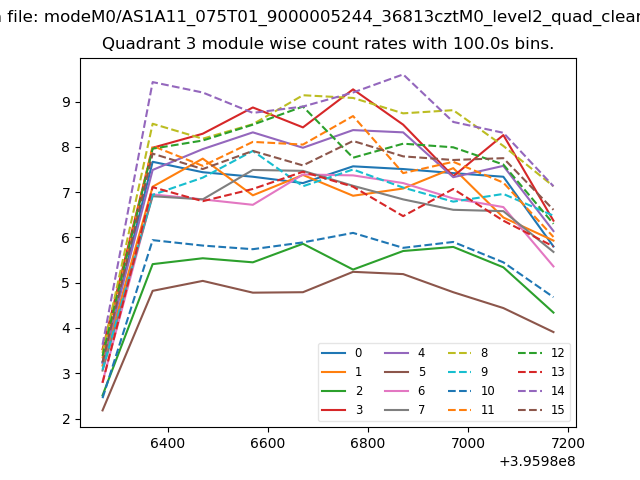
| Module-wise count rates for Quadrant D Data is divided into 100 sec bins |
 |
 |
| Parameter | Plot |
|---|---|
| CZT HV Monitor | 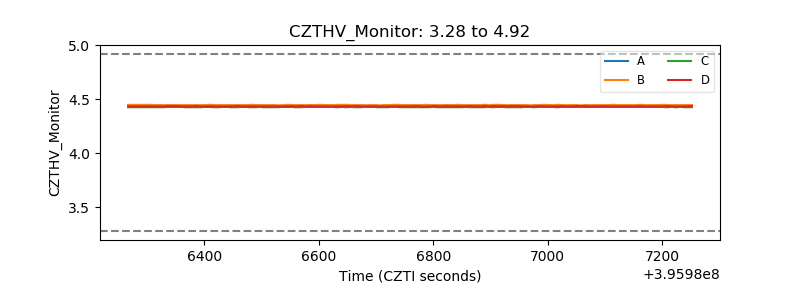 |
| D_VDD | 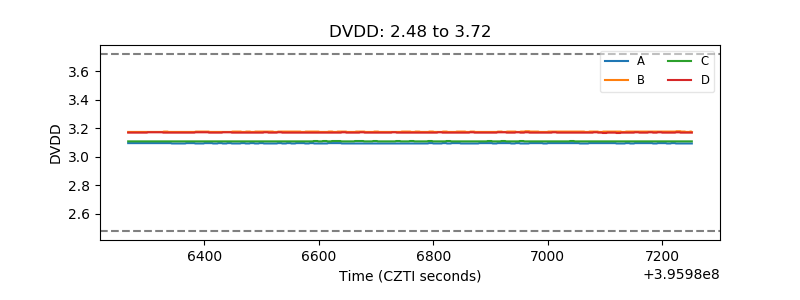 |
| Temperature 1 |  |
| Veto HV Monitor | 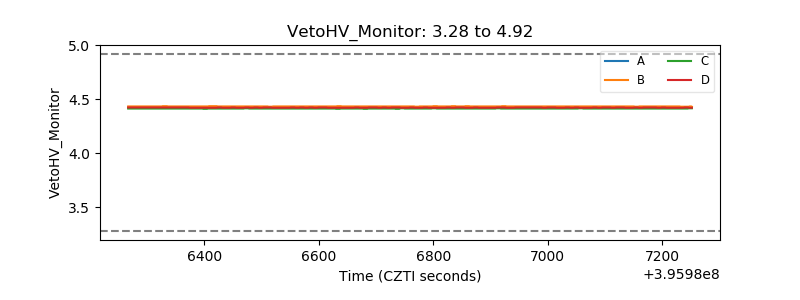 |
| Veto LLD | 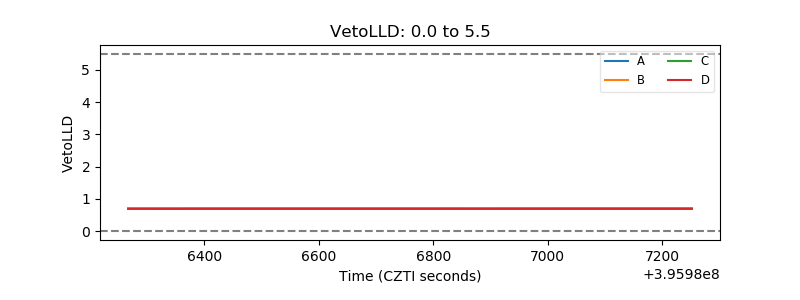 |
| Alpha Counter | 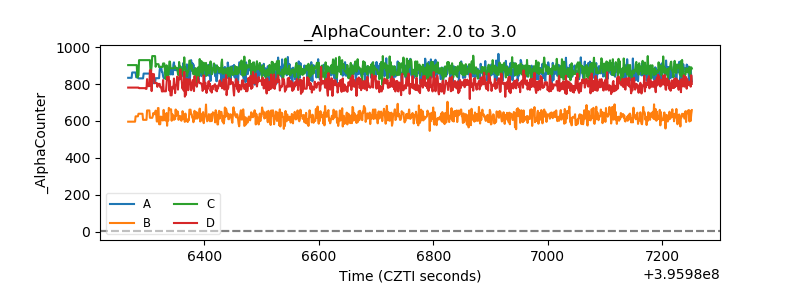 |
| _CPM_Rate | 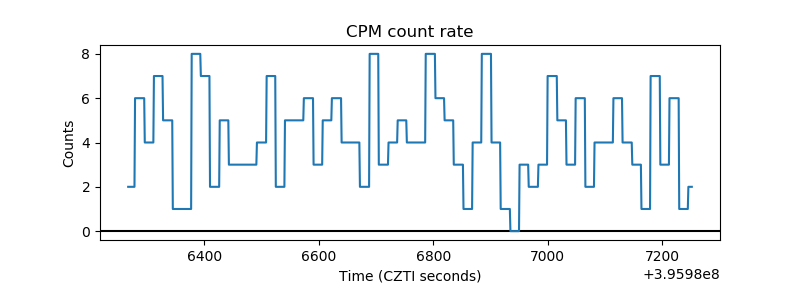 |
| CZT Counter | 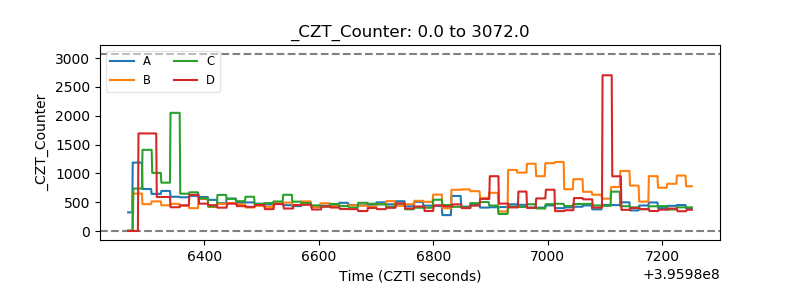 |
| +2.5 Volts monitor |  |
| +5 Volts monitor | 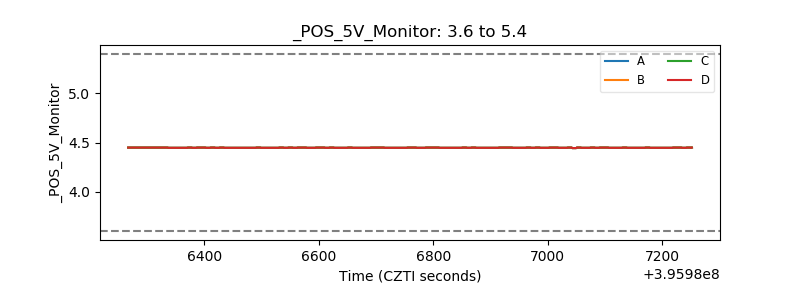 |
| _ROLL_ROT | 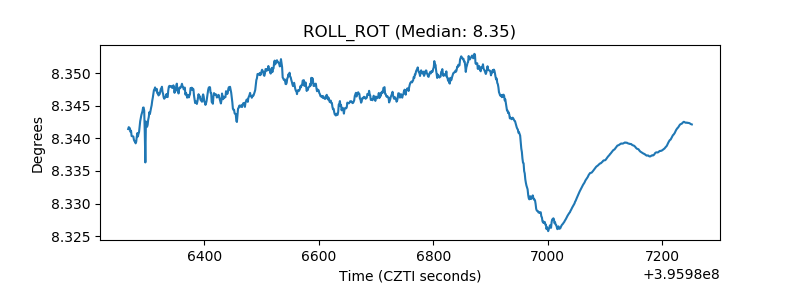 |
| _Roll_DEC | 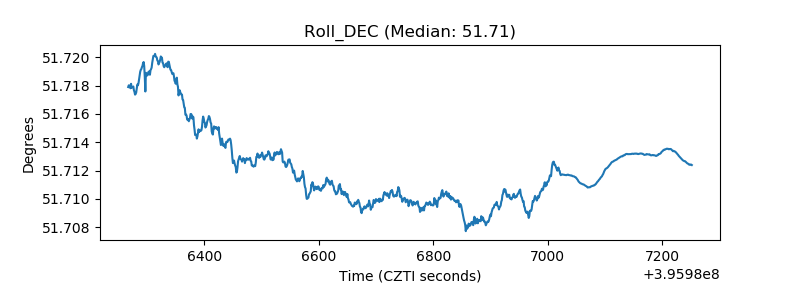 |
| _Roll_RA |  |
| Veto Counter | 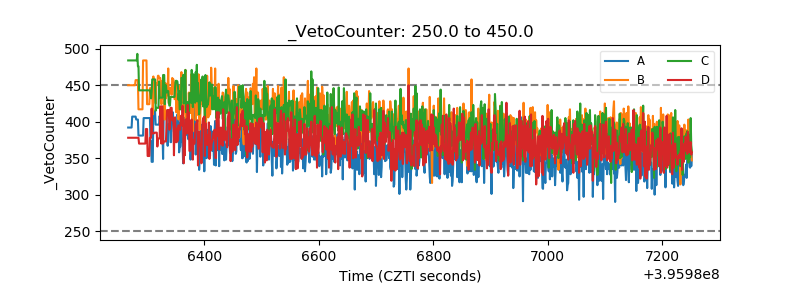 |