| Param | Original file | Final file |
|---|---|---|
| Filename | modeM0/AS1A11_075T01_9000005244_36817cztM0_level2.evt | modeM0/AS1A11_075T01_9000005244_36817cztM0_level2_quad_clean.evt |
| Size (bytes) | 775,267,200 | 62,651,520 |
| Size | 739.4 MB | 59.7 MB |
| Events in quadrant A | 2,904,780 | 427,316 |
| Events in quadrant B | 14,010,802 | 205,747 |
| Events in quadrant C | 3,033,768 | 433,522 |
| Events in quadrant D | 3,126,296 | 412,468 |
| Mode SS | |||
|---|---|---|---|
| Quadrant | BADHDUFLAG | Total packets | Discarded packets |
| A | 0 | 122 | 0 |
| B | 0 | 122 | 0 |
| C | 0 | 122 | 0 |
| D | 0 | 122 | 0 |
| Mode M0 | |||
|---|---|---|---|
| Quadrant | BADHDUFLAG | Total packets | Discarded packets |
| A | 0 | 12341 | 3 |
| B | 0 | 45712 | 2 |
| C | 0 | 12642 | 2 |
| D | 0 | 13437 | 2 |
| Mode M9 | |||
|---|---|---|---|
| Quadrant | BADHDUFLAG | Total packets | Discarded packets |
| A | 0 | 16 | 0 |
| B | 0 | 16 | 0 |
| C | 0 | 16 | 0 |
| D | 0 | 17 | 0 |
| Quadrant | Total seconds | Saturated seconds | Saturation percentage |
|---|---|---|---|
| A | 5957 | 7 | 0.117509% |
| B | 5957 | 4963 | 83.313749% |
| C | 5957 | 27 | 0.453248% |
| D | 5957 | 72 | 1.208662% |
Noise dominated data is calculated using 1-second bins in cleaned event files. If a bin has >2000 counts, and if more than 50% of those come from <1% of pixels, then it is considered to be noise-dominated and hence unusable.
| Quadrant | # 1 sec bins | Bins with >0 counts | Bins with >2000 counts | High rate bins dominated by noise | Noise dominated (total time) | Noise dominated (detector-on time) | Marked lightcurve |
|---|---|---|---|---|---|---|---|
| A | 7240 | 5958 | 3 | 3 | 0.04% | 0.05% | 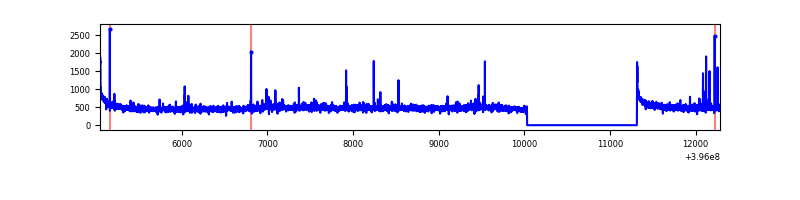 |
| B | 7240 | 5957 | 4833 | 4833 | 66.75% | 81.13% | 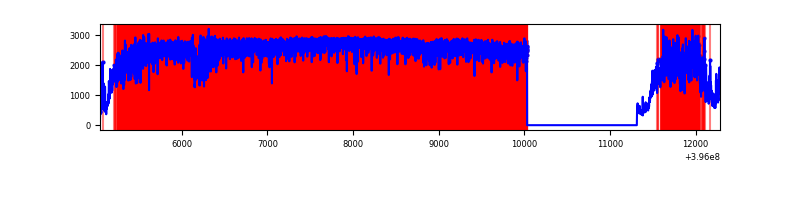 |
| C | 7240 | 5958 | 23 | 23 | 0.32% | 0.39% | 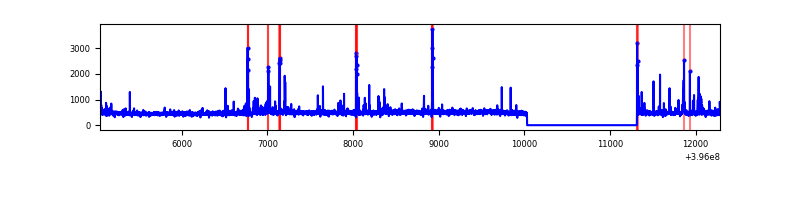 |
| D | 7240 | 5958 | 66 | 66 | 0.91% | 1.11% | 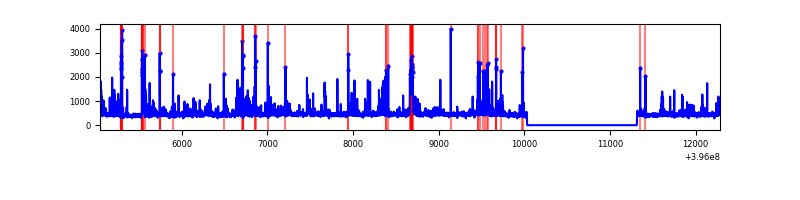 |
Top three noisy pixels from each quadrant. If the there are fewer than three noisy pixels in the level2.evt file, extra rows are filled as -1
| Pixel properties | Quadrant properties | ||||||
|---|---|---|---|---|---|---|---|
| Quadrant | DetID | PixID | Counts | Sigma | Mean | Median | Sigma |
| A | 10 | 83 | 243517 | 1797.68 | 666 | 651 | 135.1 |
| A | 9 | 143 | 41891 | 305.26 | 666 | 651 | 135.1 |
| A | 7 | 16 | 17527 | 124.92 | 666 | 651 | 135.1 |
| B | 12 | 1 | 12239450 | 182482.41 | 346 | 338 | 67.1 |
| B | 5 | 172 | 225582 | 3358.34 | 346 | 338 | 67.1 |
| B | 0 | 190 | 42238 | 624.72 | 346 | 338 | 67.1 |
| C | 15 | 214 | 256605 | 1690.52 | 649 | 653 | 151.4 |
| C | 14 | 254 | 149487 | 983.02 | 649 | 653 | 151.4 |
| C | 0 | 207 | 44432 | 289.15 | 649 | 653 | 151.4 |
| D | 2 | 153 | 206526 | 1303.34 | 646 | 627 | 158.0 |
| D | 12 | 233 | 132109 | 832.28 | 646 | 627 | 158.0 |
| D | 2 | 250 | 88759 | 557.87 | 646 | 627 | 158.0 |
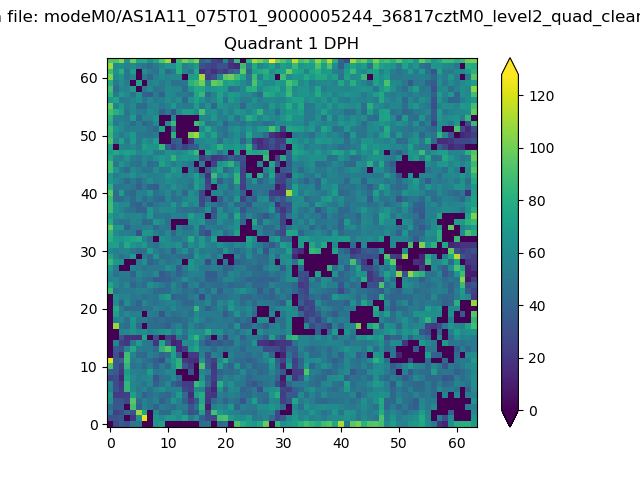
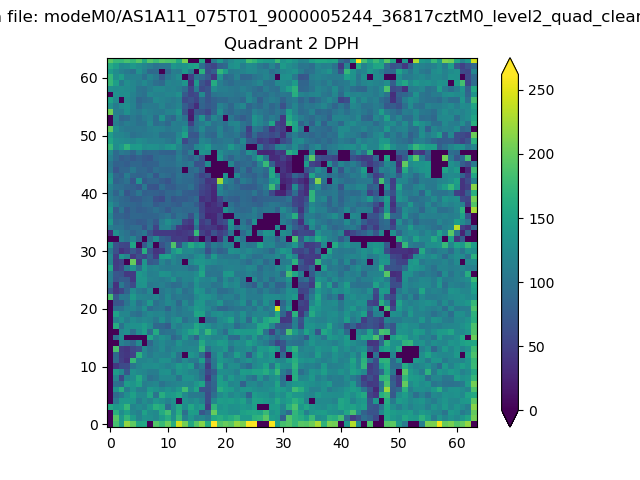
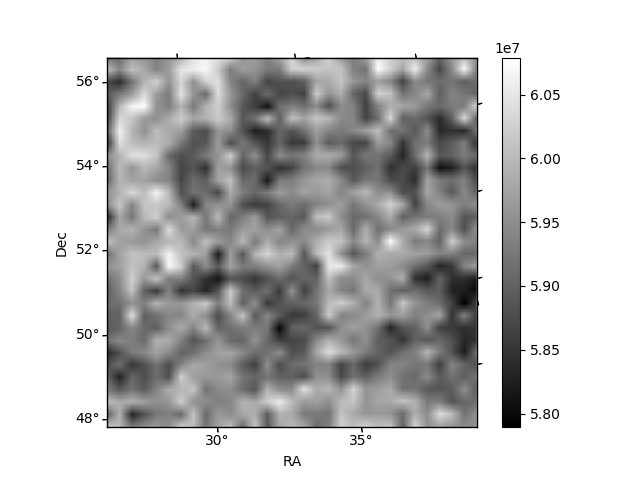
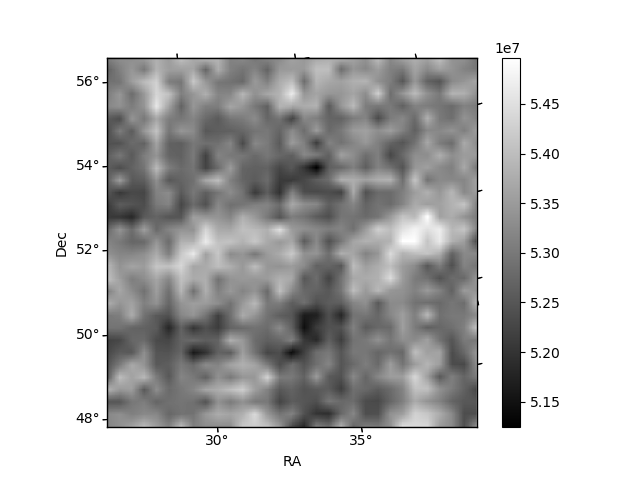
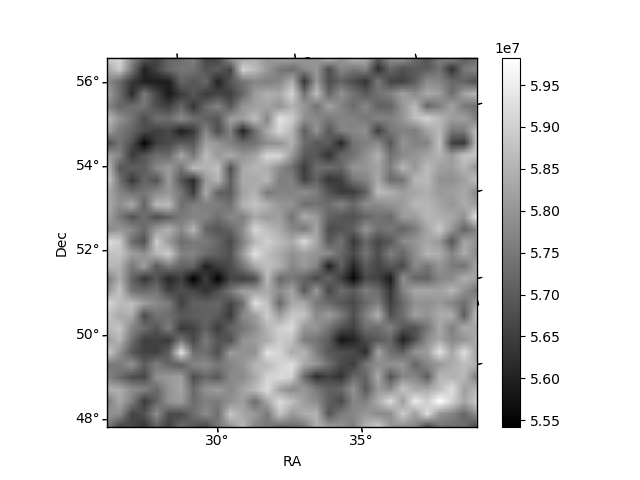
Histogram calculated using DETX and DETY for each event in the final _common_clean file
| Quadrant A |  |
 |
Quadrant B |
|---|---|---|---|
| Quadrant D | 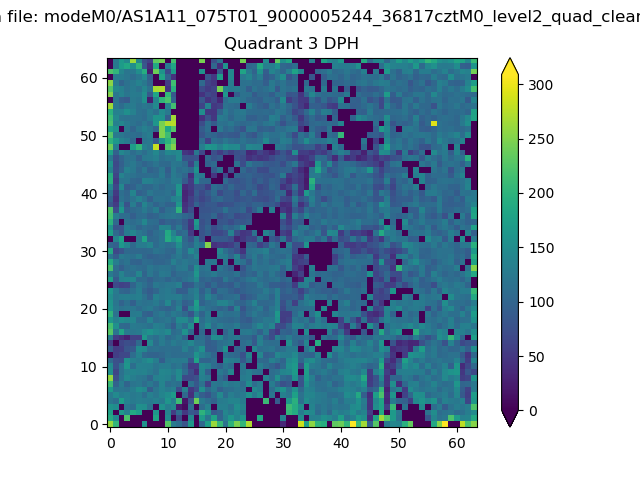 |
 |
Quadrant C |
| Plot type | Count rate plots | Images |
|---|---|---|
| Comparison with Poisson distribution Blue bars denote a histogram of data divided into 1 sec bins. Red curve is a Poisson curve with rate = median count rate of data. |
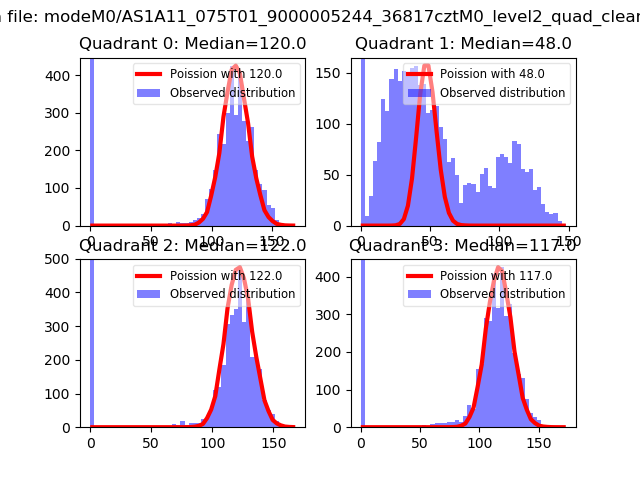 |
 |
| Quadrant-wise count rates Data is divided into 100 sec bins |
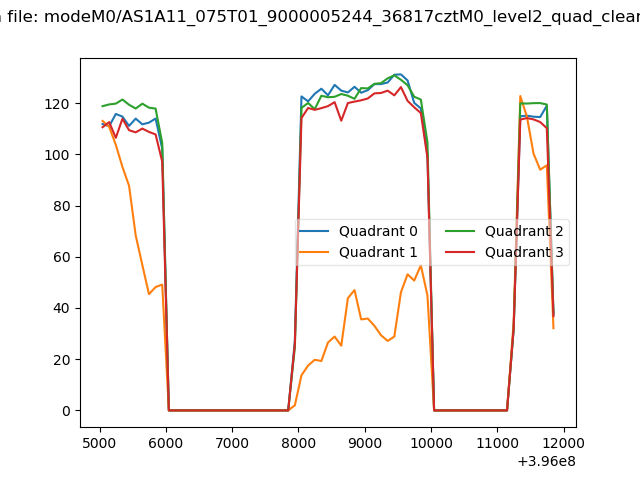 |
|
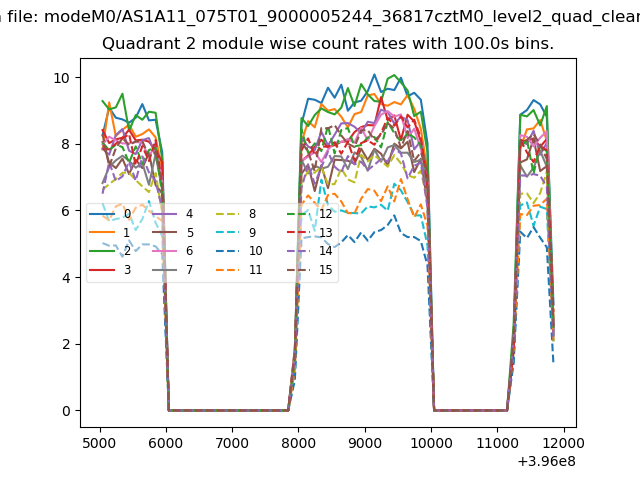
| Module-wise count rates for Quadrant A Data is divided into 100 sec bins |
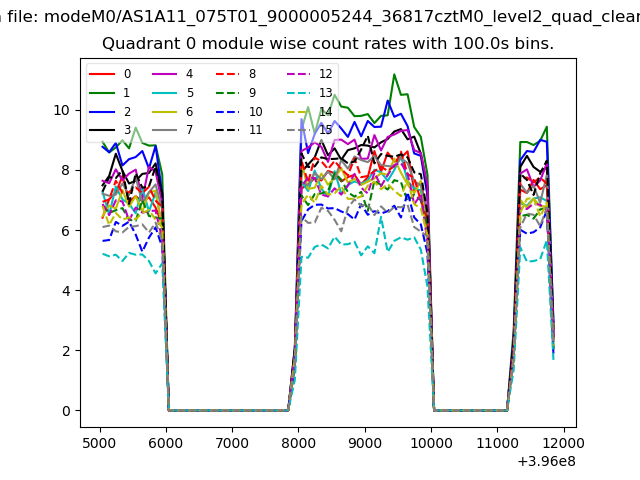 |
 |
| Module-wise count rates for Quadrant B Data is divided into 100 sec bins |
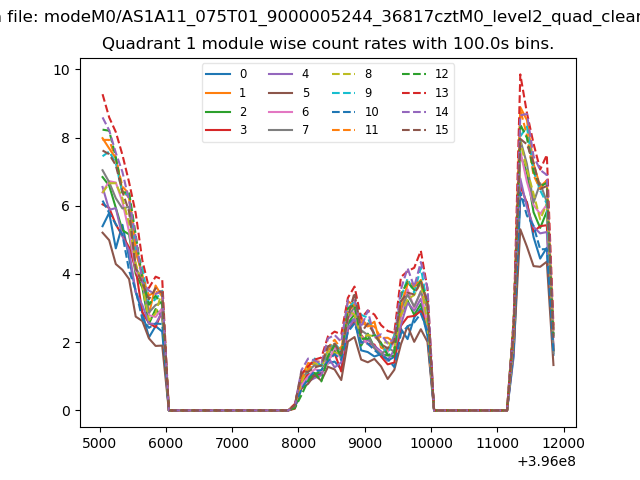 |
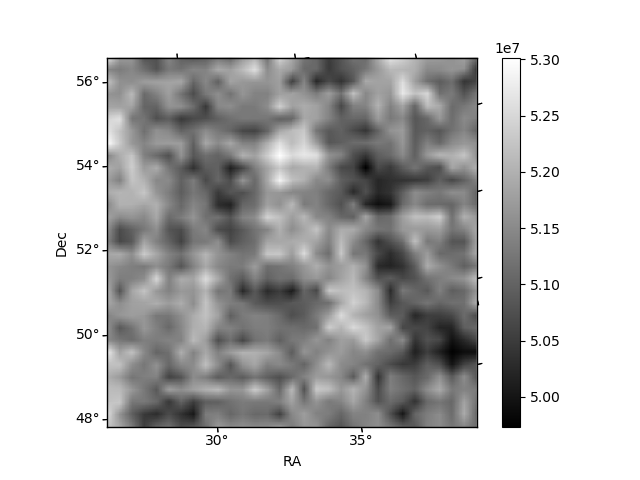 |
| Module-wise count rates for Quadrant C Data is divided into 100 sec bins |
 |
 |
| Module-wise count rates for Quadrant D Data is divided into 100 sec bins |
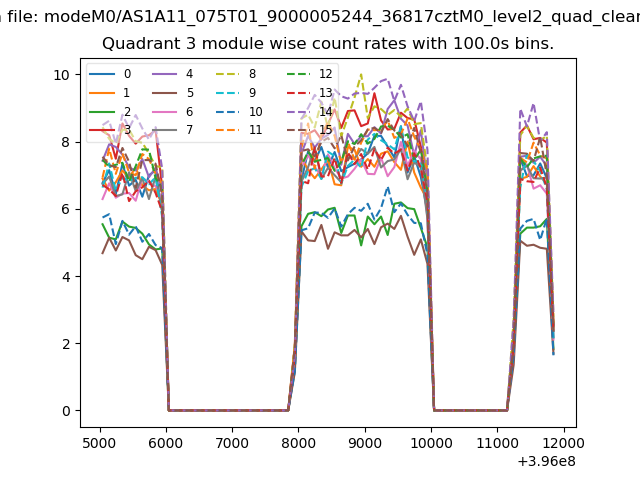 |
 |
| Parameter | Plot |
|---|---|
| CZT HV Monitor | 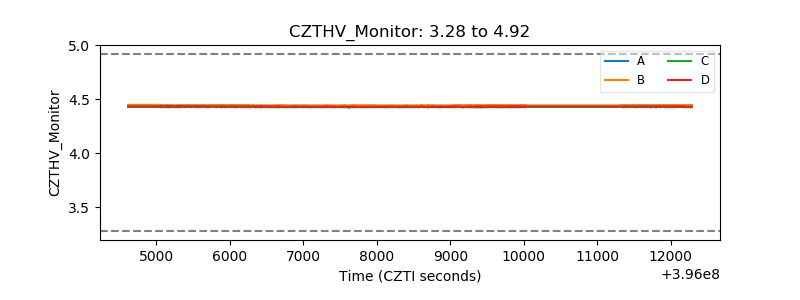 |
| D_VDD | 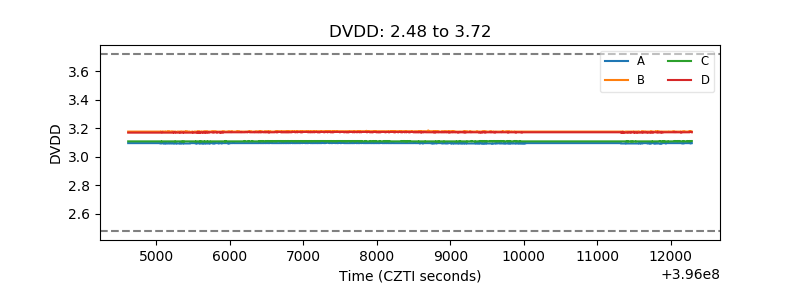 |
| Temperature 1 | 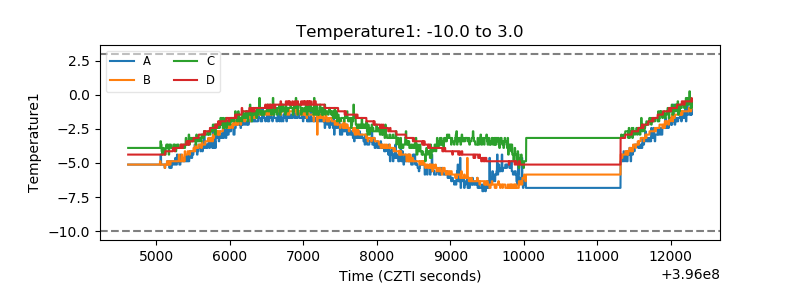 |
| Veto HV Monitor |  |
| Veto LLD | 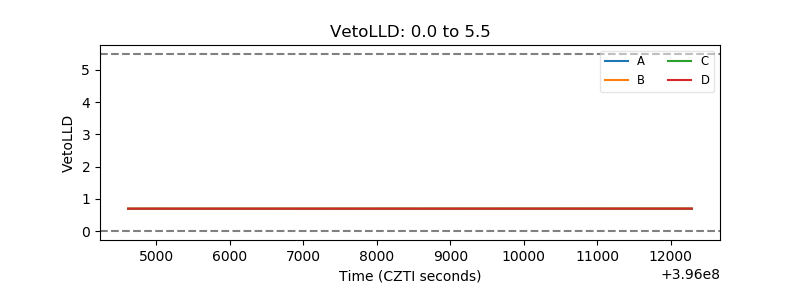 |
| Alpha Counter | 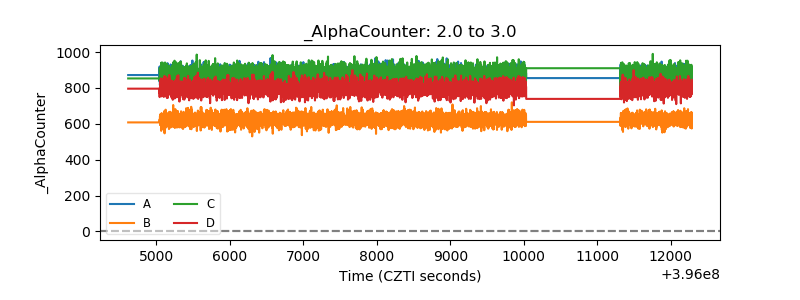 |
| _CPM_Rate | 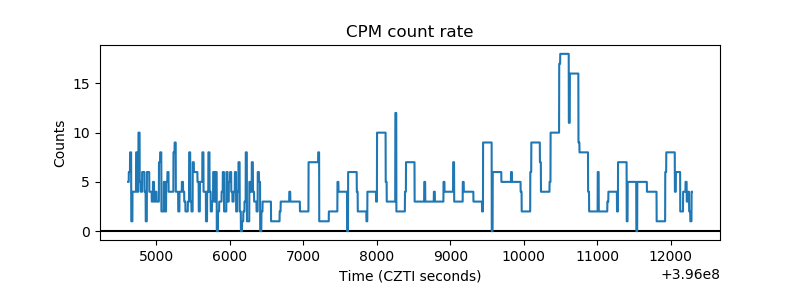 |
| CZT Counter |  |
| +2.5 Volts monitor |  |
| +5 Volts monitor | 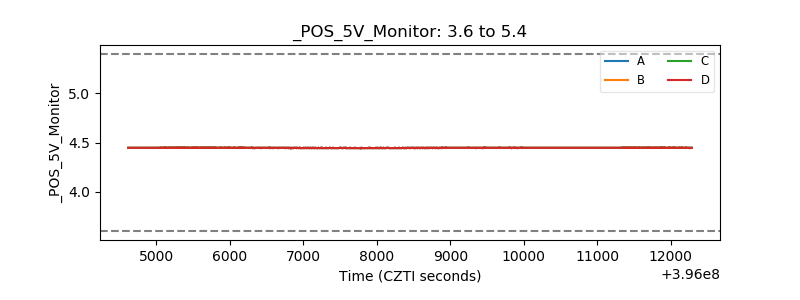 |
| _ROLL_ROT | 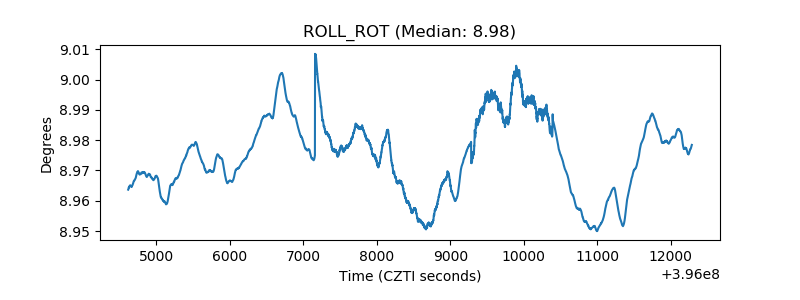 |
| _Roll_DEC | 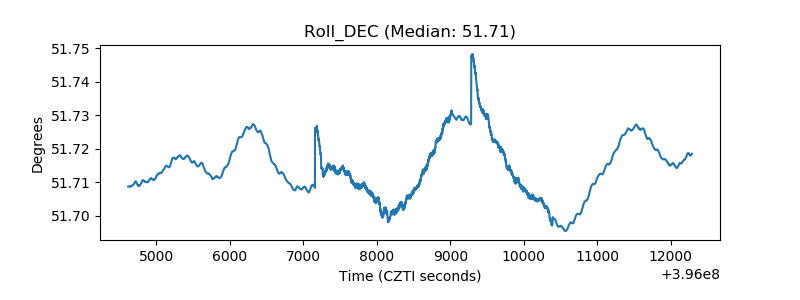 |
| _Roll_RA |  |
| Veto Counter | 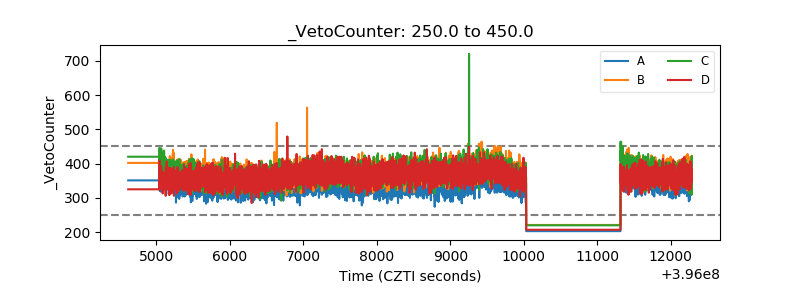 |