| Param | Original file | Final file |
|---|---|---|
| Filename | modeM0/AS1A11_075T01_9000005244_36819cztM0_level2.evt | modeM0/AS1A11_075T01_9000005244_36819cztM0_level2_quad_clean.evt |
| Size (bytes) | 1,357,896,960 | 105,958,080 |
| Size | 1.3 GB | 101.0 MB |
| Events in quadrant A | 5,375,819 | 704,733 |
| Events in quadrant B | 23,235,166 | 374,514 |
| Events in quadrant C | 5,599,606 | 705,156 |
| Events in quadrant D | 6,184,334 | 673,263 |
| Mode SS | |||
|---|---|---|---|
| Quadrant | BADHDUFLAG | Total packets | Discarded packets |
| A | 0 | 222 | 0 |
| B | 0 | 222 | 0 |
| C | 0 | 222 | 0 |
| D | 0 | 222 | 0 |
| Mode M0 | |||
|---|---|---|---|
| Quadrant | BADHDUFLAG | Total packets | Discarded packets |
| A | 0 | 22740 | 4 |
| B | 0 | 76449 | 10 |
| C | 0 | 23102 | 3 |
| D | 0 | 25596 | 3 |
| Mode M9 | |||
|---|---|---|---|
| Quadrant | BADHDUFLAG | Total packets | Discarded packets |
| A | 0 | 28 | 0 |
| B | 0 | 28 | 0 |
| C | 0 | 28 | 0 |
| D | 0 | 29 | 0 |
| Quadrant | Total seconds | Saturated seconds | Saturation percentage |
|---|---|---|---|
| A | 10806 | 20 | 0.185082% |
| B | 10805 | 8042 | 74.428505% |
| C | 10806 | 82 | 0.758838% |
| D | 10806 | 201 | 1.860078% |
Noise dominated data is calculated using 1-second bins in cleaned event files. If a bin has >2000 counts, and if more than 50% of those come from <1% of pixels, then it is considered to be noise-dominated and hence unusable.
| Quadrant | # 1 sec bins | Bins with >0 counts | Bins with >2000 counts | High rate bins dominated by noise | Noise dominated (total time) | Noise dominated (detector-on time) | Marked lightcurve |
|---|---|---|---|---|---|---|---|
| A | 13581 | 10808 | 4 | 4 | 0.03% | 0.04% | 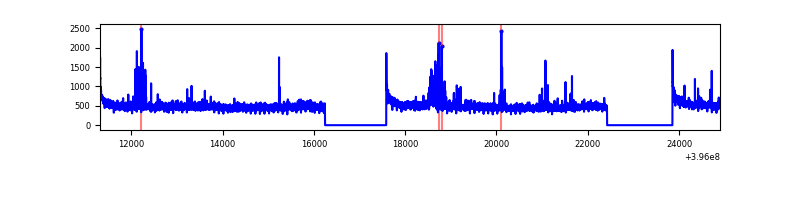 |
| B | 13580 | 10806 | 7531 | 7531 | 55.46% | 69.69% | 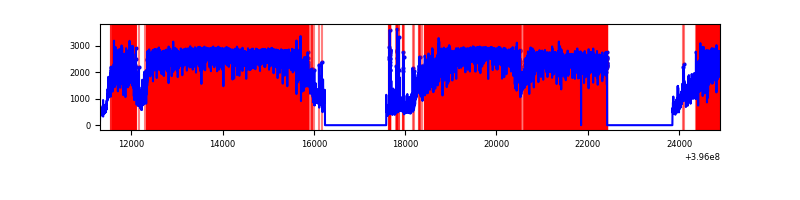 |
| C | 13581 | 10808 | 57 | 57 | 0.42% | 0.53% | 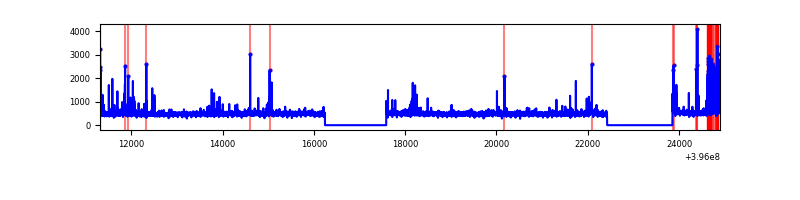 |
| D | 13581 | 10808 | 160 | 160 | 1.18% | 1.48% | 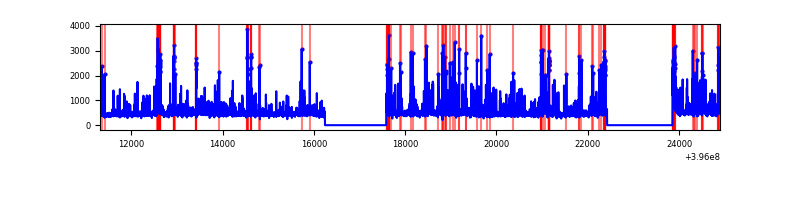 |
Top three noisy pixels from each quadrant. If the there are fewer than three noisy pixels in the level2.evt file, extra rows are filled as -1
| Pixel properties | Quadrant properties | ||||||
|---|---|---|---|---|---|---|---|
| Quadrant | DetID | PixID | Counts | Sigma | Mean | Median | Sigma |
| A | 10 | 83 | 427536 | 1714.67 | 1226 | 1200 | 248.6 |
| A | 9 | 143 | 82343 | 326.35 | 1226 | 1200 | 248.6 |
| A | 7 | 48 | 79021 | 312.99 | 1226 | 1200 | 248.6 |
| B | 12 | 1 | 19270272 | 129069.71 | 781 | 761 | 149.3 |
| B | 5 | 172 | 200701 | 1339.22 | 781 | 761 | 149.3 |
| B | 0 | 189 | 121892 | 811.35 | 781 | 761 | 149.3 |
| C | 15 | 214 | 465019 | 1675.73 | 1191 | 1199 | 276.8 |
| C | 14 | 254 | 346465 | 1247.41 | 1191 | 1199 | 276.8 |
| C | 0 | 207 | 61313 | 217.19 | 1191 | 1199 | 276.8 |
| D | 12 | 233 | 527622 | 1805.16 | 1188 | 1154 | 291.6 |
| D | 13 | 249 | 241080 | 822.66 | 1188 | 1154 | 291.6 |
| D | 2 | 250 | 237781 | 811.35 | 1188 | 1154 | 291.6 |
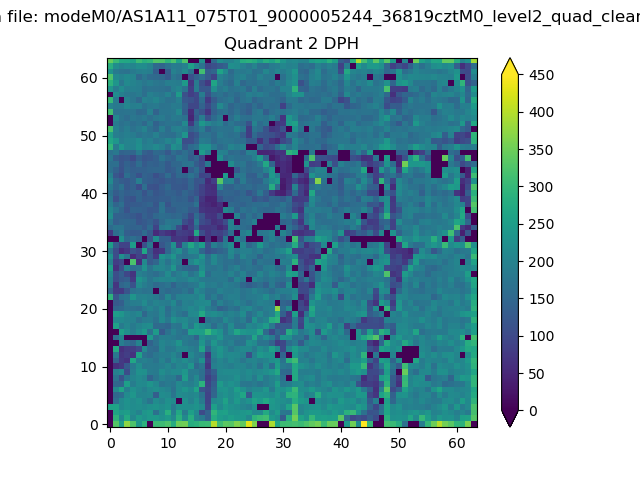
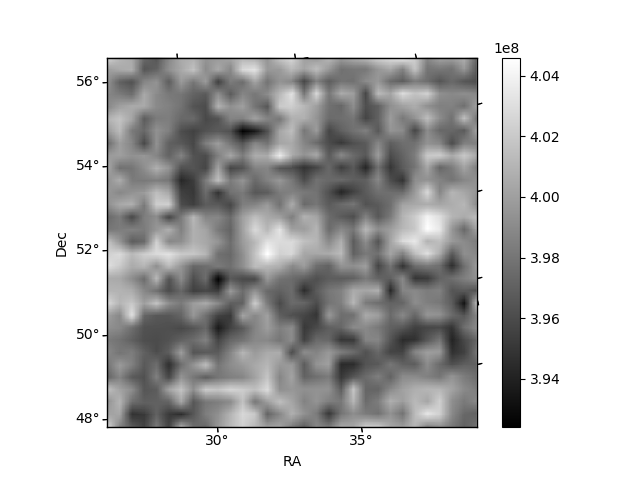
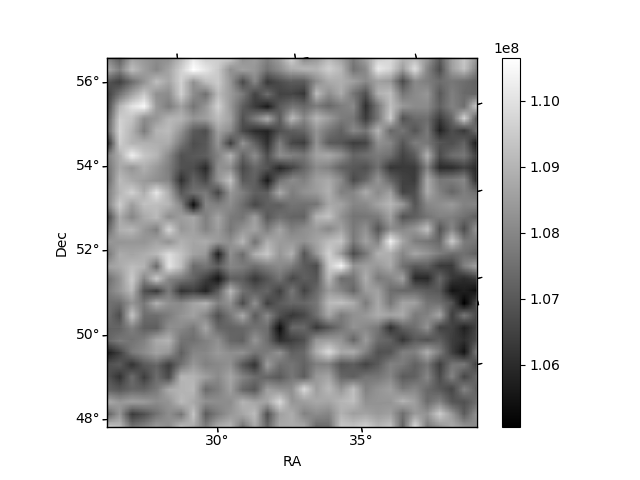
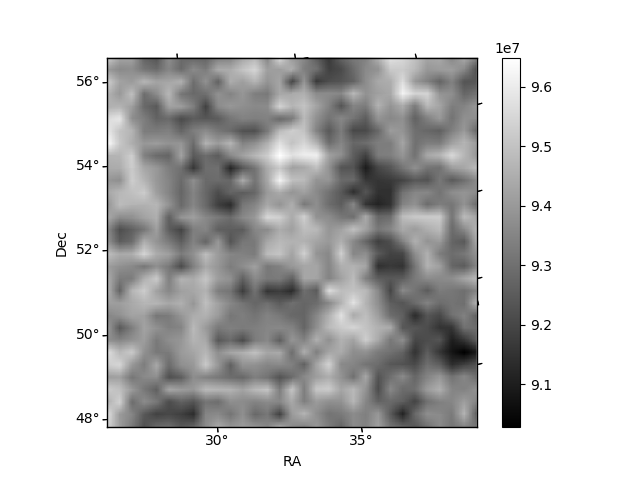
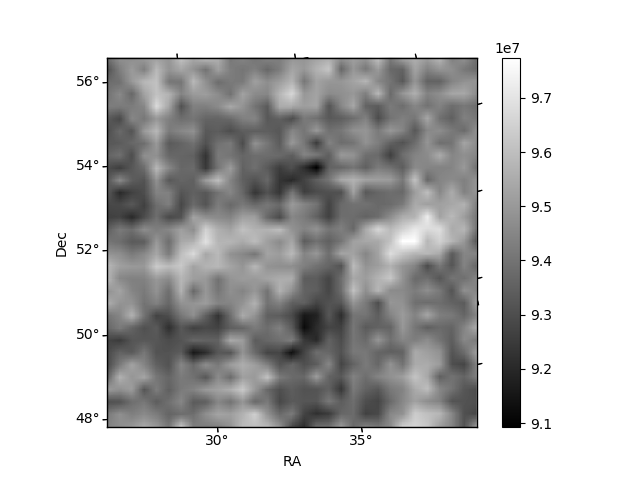
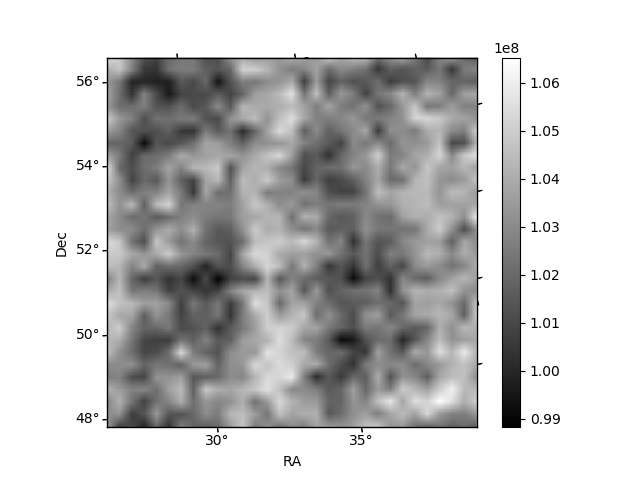
Histogram calculated using DETX and DETY for each event in the final _common_clean file
| Quadrant A | 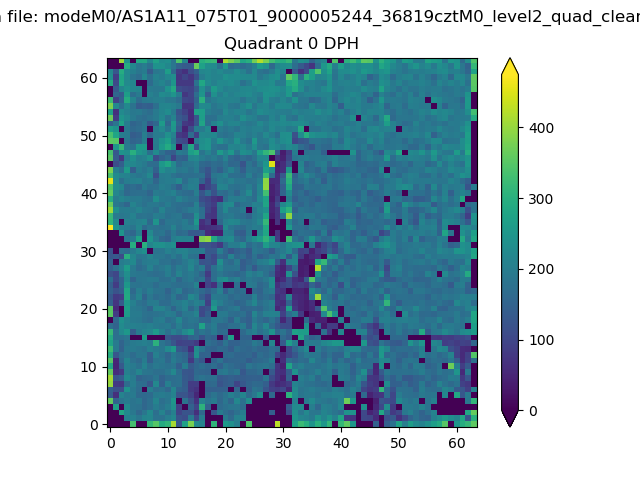 |
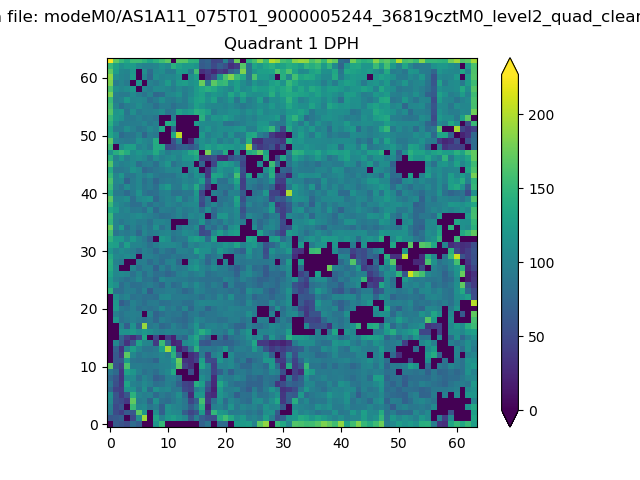 |
Quadrant B |
|---|---|---|---|
| Quadrant D | 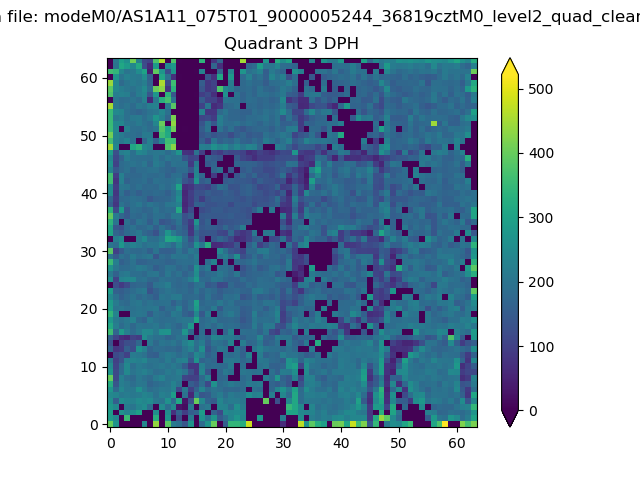 |
 |
Quadrant C |
| Plot type | Count rate plots | Images |
|---|---|---|
| Comparison with Poisson distribution Blue bars denote a histogram of data divided into 1 sec bins. Red curve is a Poisson curve with rate = median count rate of data. |
 |
 |
| Quadrant-wise count rates Data is divided into 100 sec bins |
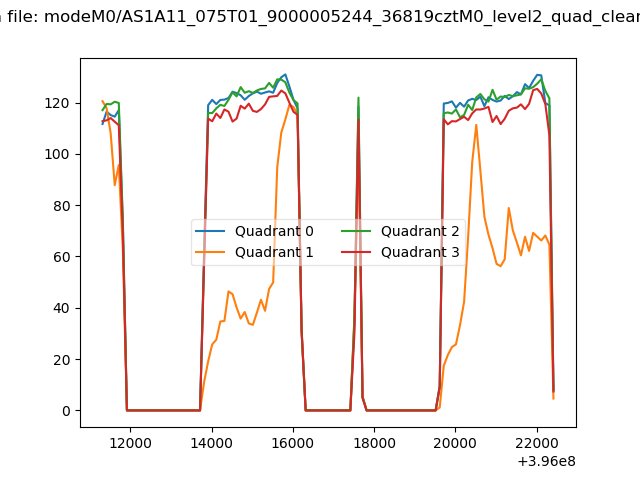 |
|
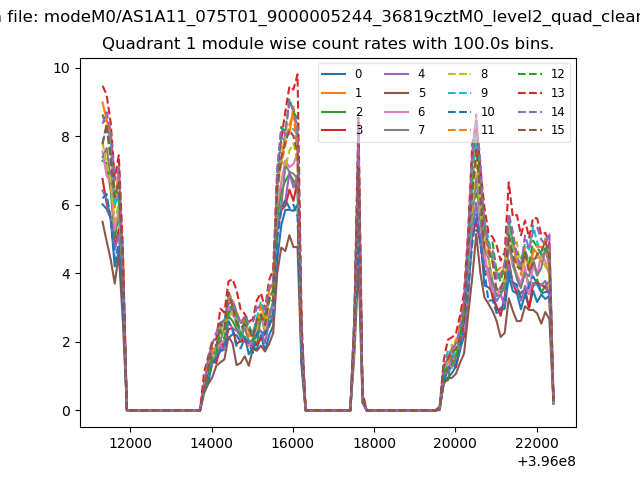
| Module-wise count rates for Quadrant A Data is divided into 100 sec bins |
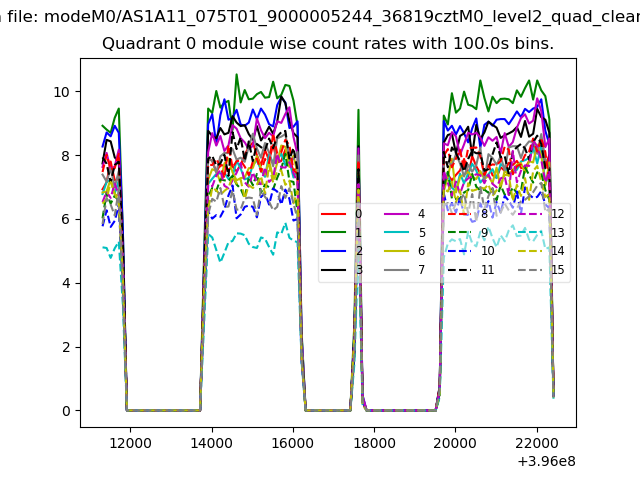 |
 |
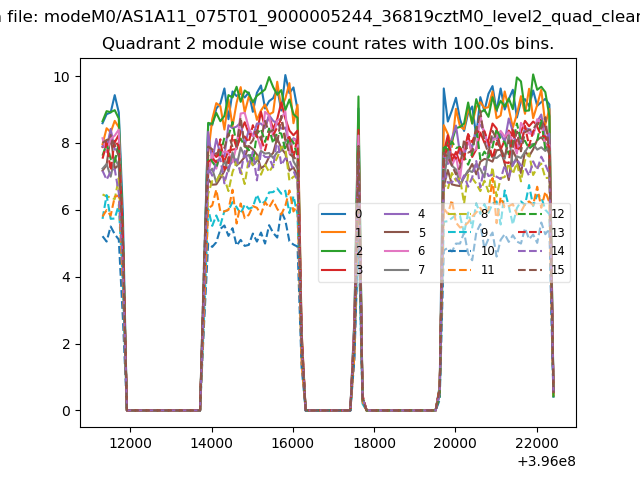
| Module-wise count rates for Quadrant B Data is divided into 100 sec bins |
 |
 |
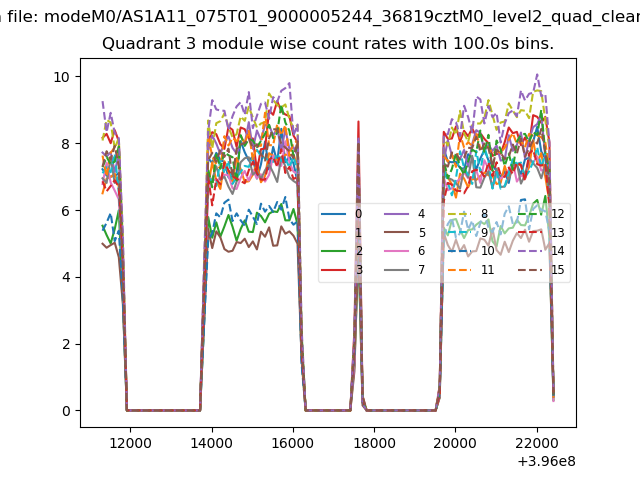
| Module-wise count rates for Quadrant C Data is divided into 100 sec bins |
 |
 |
| Module-wise count rates for Quadrant D Data is divided into 100 sec bins |
 |
 |
| Parameter | Plot |
|---|---|
| CZT HV Monitor | 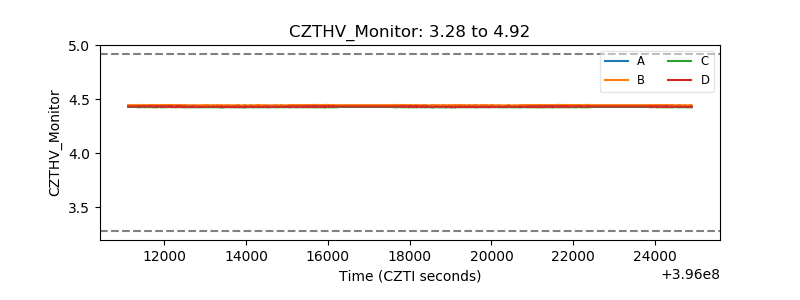 |
| D_VDD |  |
| Temperature 1 | 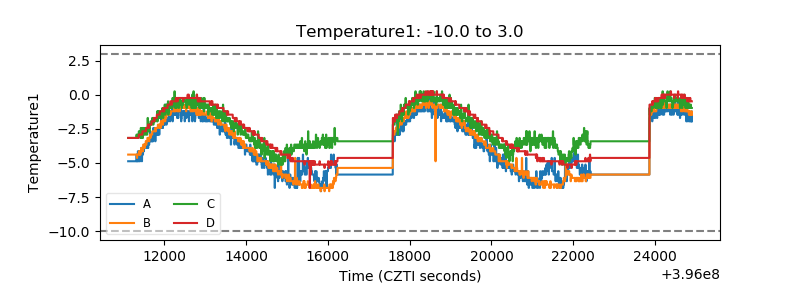 |
| Veto HV Monitor | 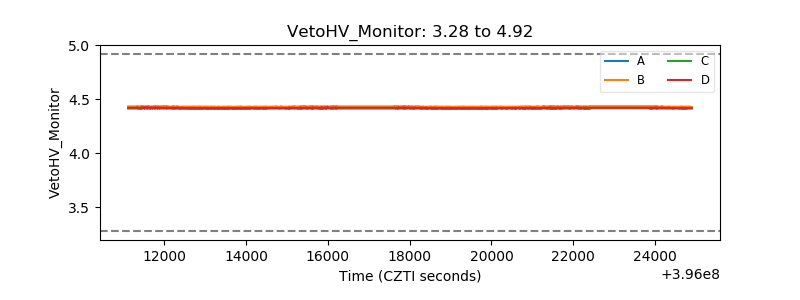 |
| Veto LLD | 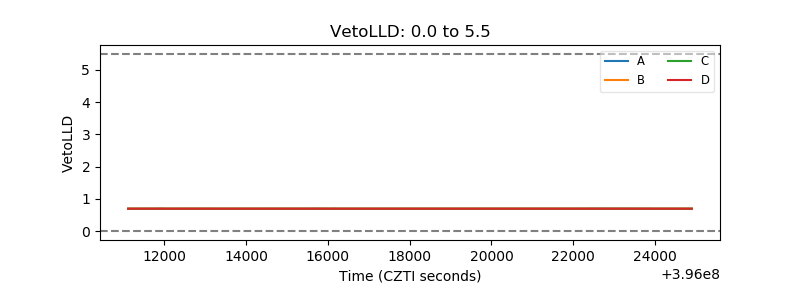 |
| Alpha Counter |  |
| _CPM_Rate |  |
| CZT Counter | 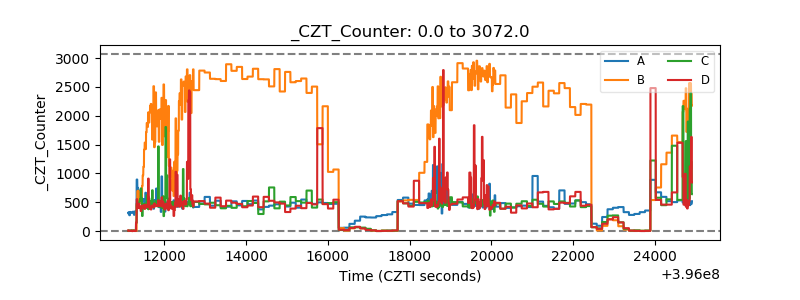 |
| +2.5 Volts monitor |  |
| +5 Volts monitor |  |
| _ROLL_ROT | 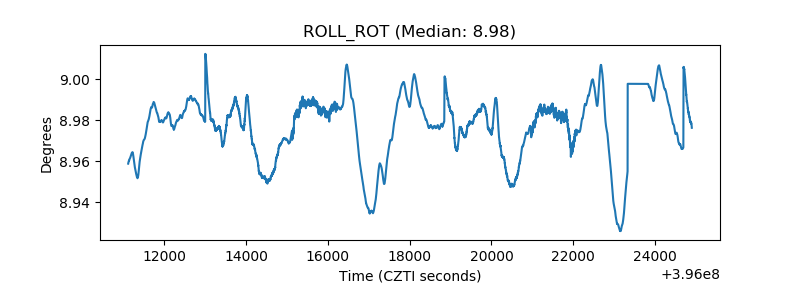 |
| _Roll_DEC | 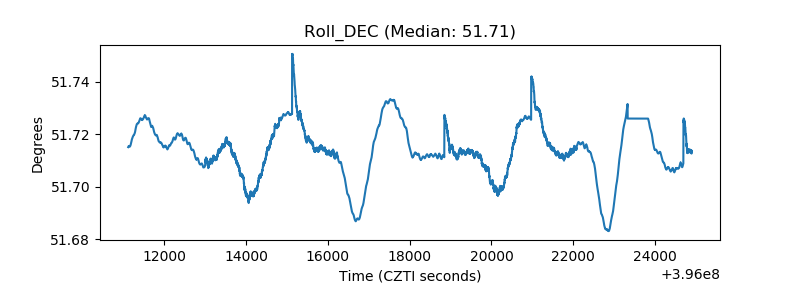 |
| _Roll_RA | 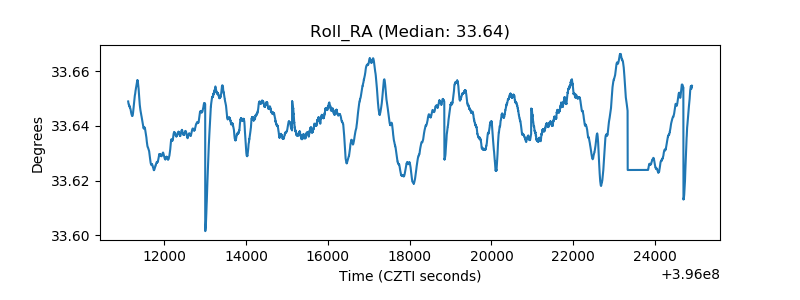 |
| Veto Counter | 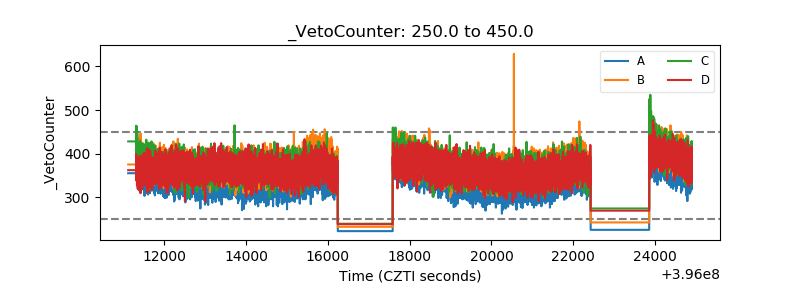 |