| Param | Original file | Final file |
|---|---|---|
| Filename | modeM0/AS1A11_075T01_9000005244_36820cztM0_level2.evt | modeM0/AS1A11_075T01_9000005244_36820cztM0_level2_quad_clean.evt |
| Size (bytes) | 1,035,293,760 | 90,826,560 |
| Size | 987.3 MB | 86.6 MB |
| Events in quadrant A | 3,951,878 | 599,445 |
| Events in quadrant B | 15,187,479 | 446,929 |
| Events in quadrant C | 5,908,566 | 585,063 |
| Events in quadrant D | 5,761,154 | 555,557 |
| Mode SS | |||
|---|---|---|---|
| Quadrant | BADHDUFLAG | Total packets | Discarded packets |
| A | 0 | 162 | 0 |
| B | 0 | 162 | 0 |
| C | 0 | 162 | 0 |
| D | 0 | 162 | 0 |
| Mode M0 | |||
|---|---|---|---|
| Quadrant | BADHDUFLAG | Total packets | Discarded packets |
| A | 0 | 17130 | 4 |
| B | 0 | 50681 | 2 |
| C | 0 | 22800 | 2 |
| D | 0 | 22817 | 2 |
| Mode M9 | |||
|---|---|---|---|
| Quadrant | BADHDUFLAG | Total packets | Discarded packets |
| A | 0 | 20 | 0 |
| B | 0 | 20 | 0 |
| C | 0 | 20 | 0 |
| D | 0 | 20 | 0 |
| Quadrant | Total seconds | Saturated seconds | Saturation percentage |
|---|---|---|---|
| A | 8092 | 29 | 0.358379% |
| B | 8092 | 4467 | 55.202669% |
| C | 8092 | 574 | 7.093426% |
| D | 8092 | 545 | 6.735047% |
Noise dominated data is calculated using 1-second bins in cleaned event files. If a bin has >2000 counts, and if more than 50% of those come from <1% of pixels, then it is considered to be noise-dominated and hence unusable.
| Quadrant | # 1 sec bins | Bins with >0 counts | Bins with >2000 counts | High rate bins dominated by noise | Noise dominated (total time) | Noise dominated (detector-on time) | Marked lightcurve |
|---|---|---|---|---|---|---|---|
| A | 44628 | 8094 | 16 | 16 | 0.04% | 0.20% | 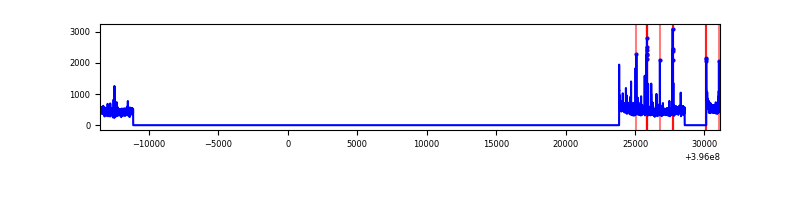 |
| B | 44627 | 8092 | 4127 | 4127 | 9.25% | 51.00% | 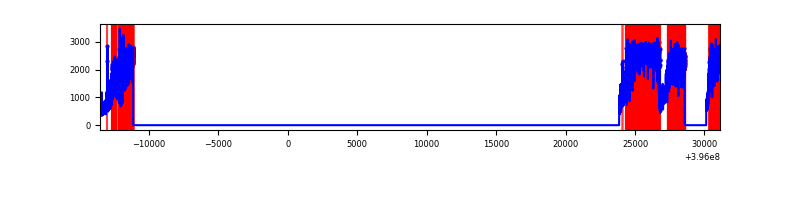 |
| C | 44628 | 8094 | 440 | 440 | 0.99% | 5.44% | 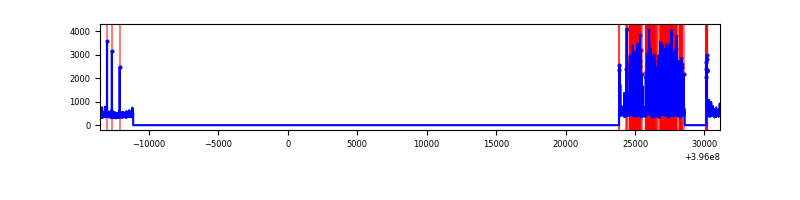 |
| D | 44628 | 8094 | 497 | 497 | 1.11% | 6.14% | 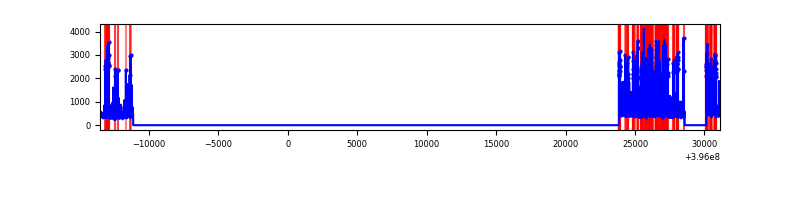 |
Top three noisy pixels from each quadrant. If the there are fewer than three noisy pixels in the level2.evt file, extra rows are filled as -1
| Pixel properties | Quadrant properties | ||||||
|---|---|---|---|---|---|---|---|
| Quadrant | DetID | PixID | Counts | Sigma | Mean | Median | Sigma |
| A | 10 | 83 | 309281 | 1690.22 | 902 | 884 | 182.5 |
| A | 9 | 143 | 104048 | 565.41 | 902 | 884 | 182.5 |
| A | 13 | 6 | 20985 | 110.17 | 902 | 884 | 182.5 |
| B | 12 | 1 | 11448561 | 88326.37 | 680 | 663 | 129.6 |
| B | 5 | 172 | 697716 | 5378.12 | 680 | 663 | 129.6 |
| B | 0 | 213 | 75099 | 574.31 | 680 | 663 | 129.6 |
| C | 14 | 254 | 1824669 | 9268.98 | 854 | 861 | 196.8 |
| C | 15 | 214 | 336557 | 1706.08 | 854 | 861 | 196.8 |
| C | 0 | 207 | 311665 | 1579.57 | 854 | 861 | 196.8 |
| D | 2 | 250 | 1362364 | 6546.43 | 855 | 832 | 208.0 |
| D | 12 | 233 | 412253 | 1978.17 | 855 | 832 | 208.0 |
| D | 13 | 249 | 350769 | 1682.55 | 855 | 832 | 208.0 |
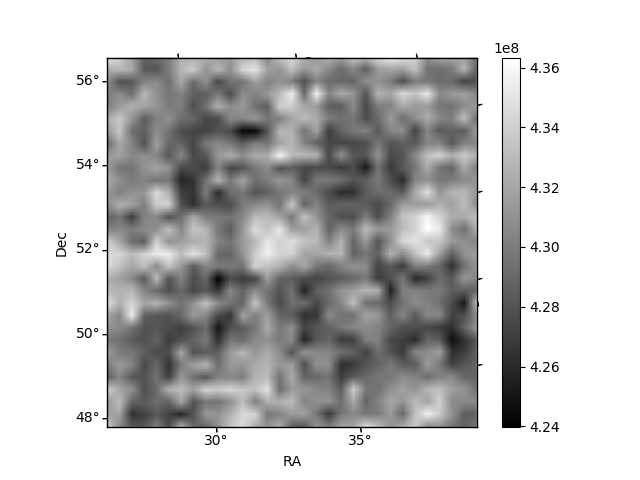
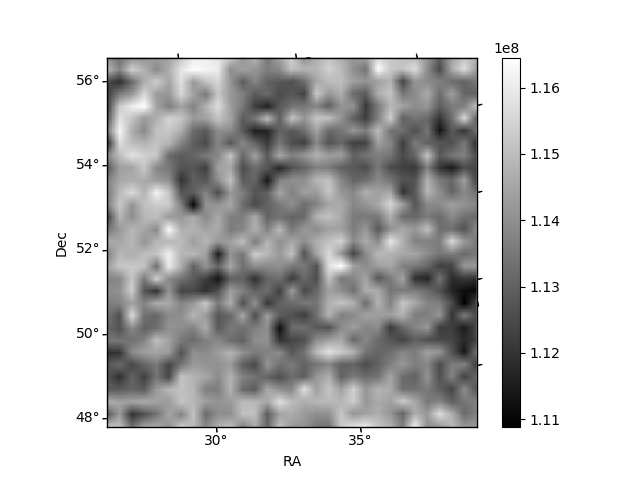
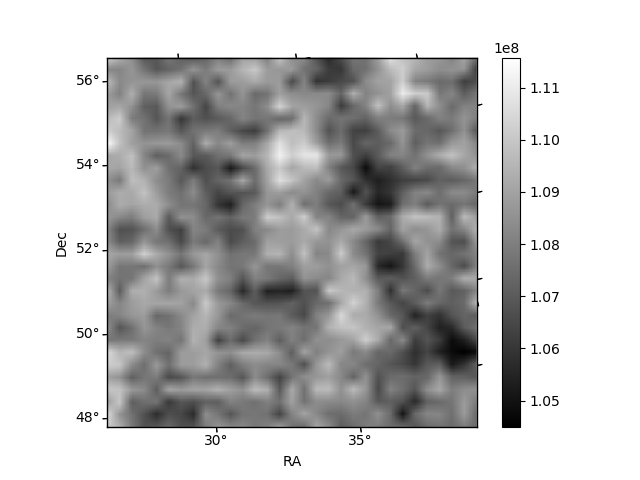
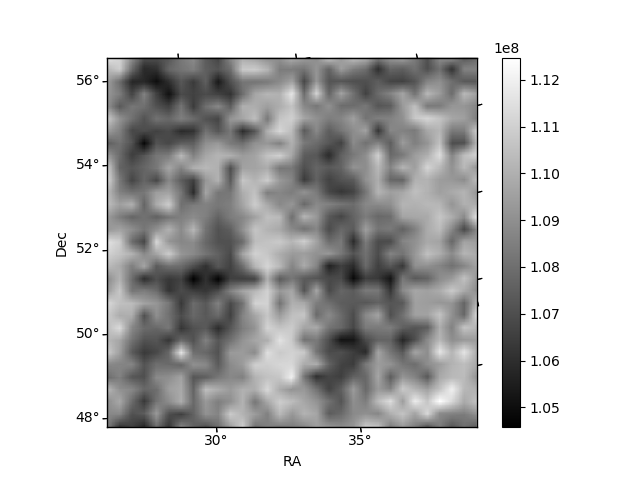
Histogram calculated using DETX and DETY for each event in the final _common_clean file
| Quadrant A | 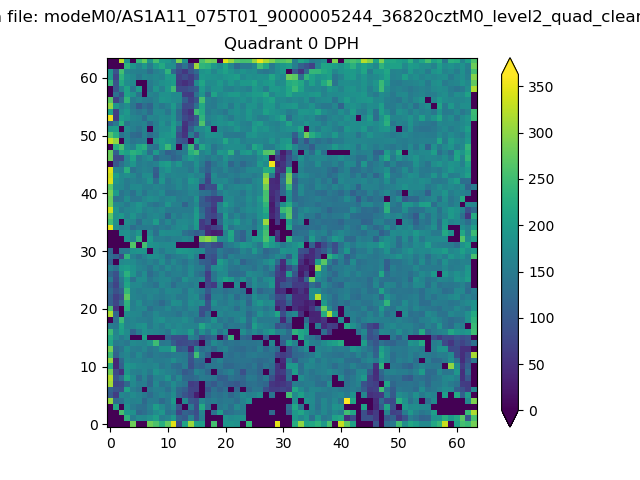 |
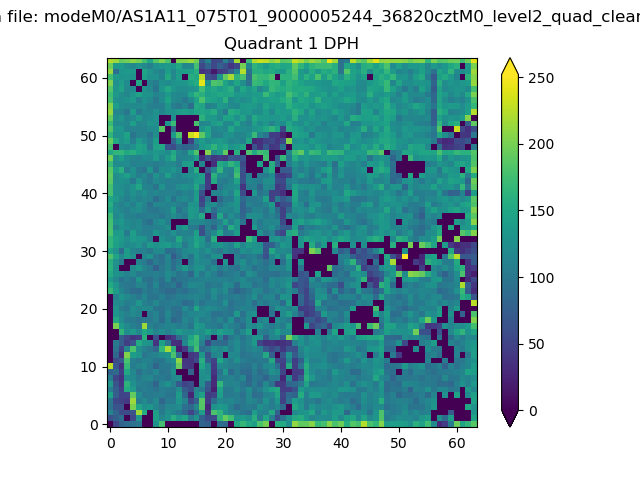 |
Quadrant B |
|---|---|---|---|
| Quadrant D | 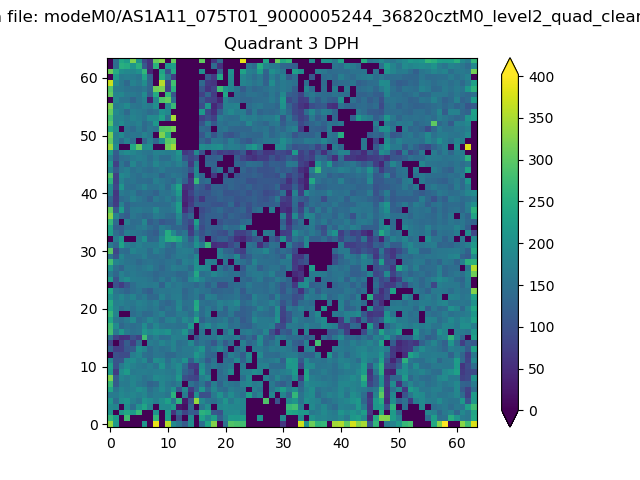 |
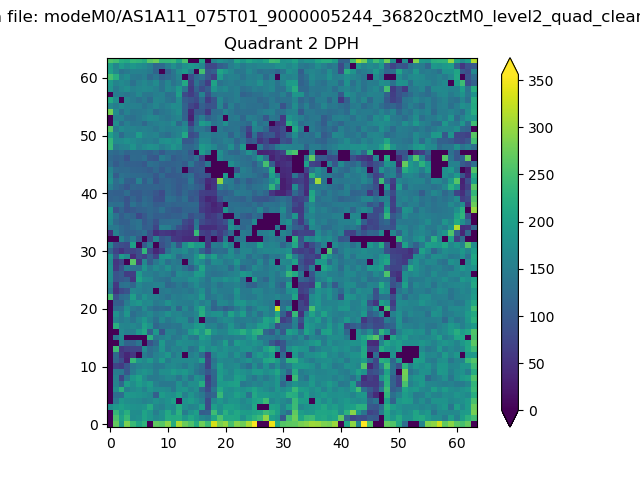 |
Quadrant C |
| Plot type | Count rate plots | Images |
|---|---|---|
| Comparison with Poisson distribution Blue bars denote a histogram of data divided into 1 sec bins. Red curve is a Poisson curve with rate = median count rate of data. |
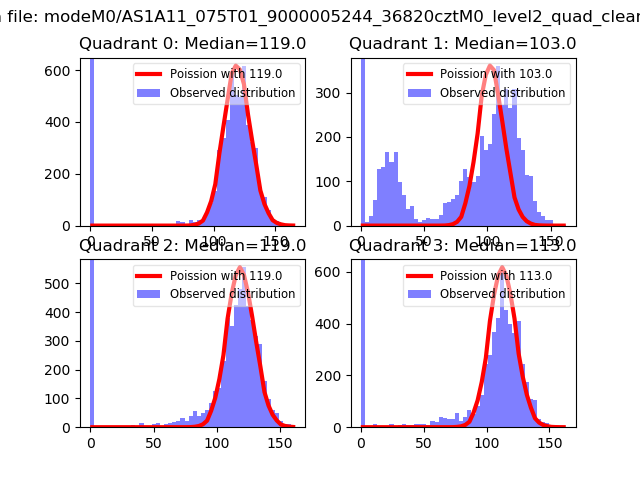 |
 |
| Quadrant-wise count rates Data is divided into 100 sec bins |
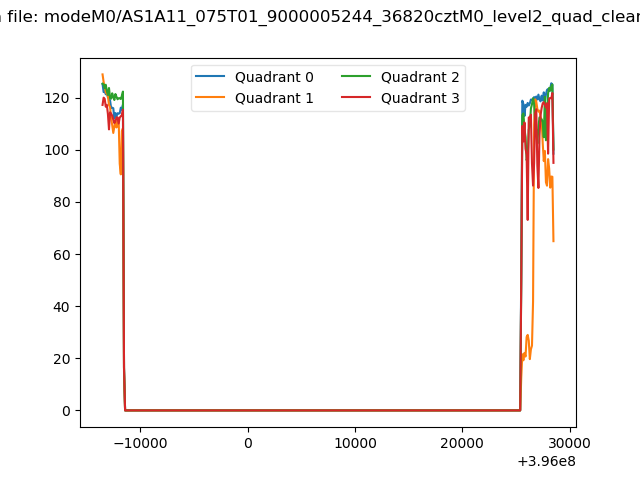 |
|
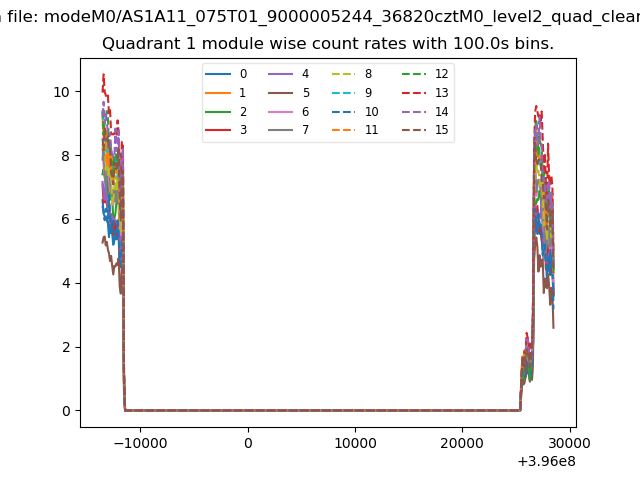
| Module-wise count rates for Quadrant A Data is divided into 100 sec bins |
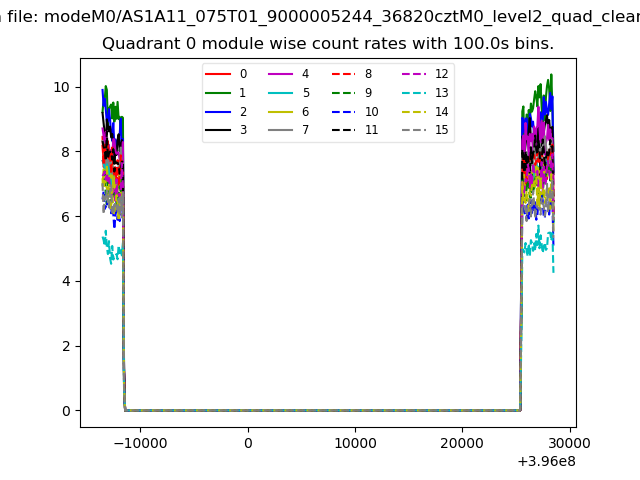 |
 |
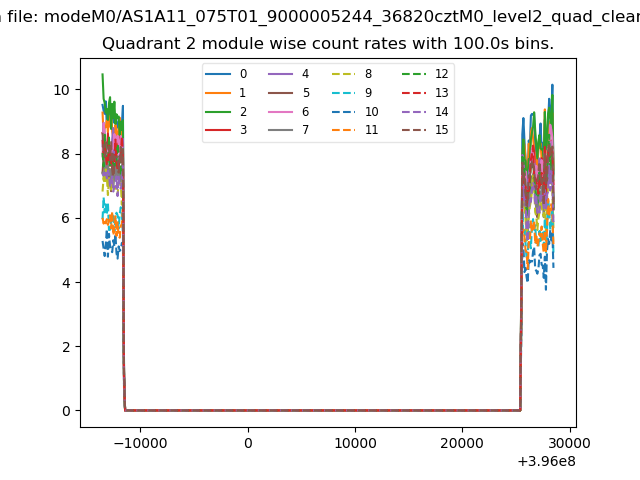
| Module-wise count rates for Quadrant B Data is divided into 100 sec bins |
 |
 |
| Module-wise count rates for Quadrant C Data is divided into 100 sec bins |
 |
 |
| Module-wise count rates for Quadrant D Data is divided into 100 sec bins |
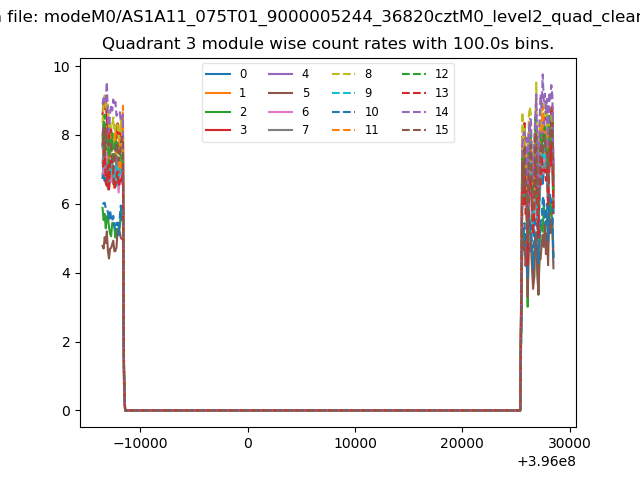 |
 |
| Parameter | Plot |
|---|---|
| CZT HV Monitor | 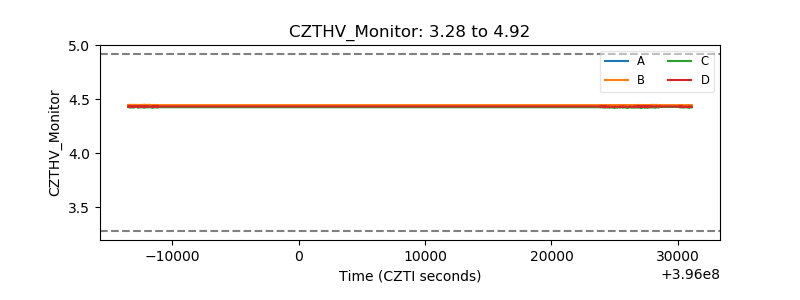 |
| D_VDD | 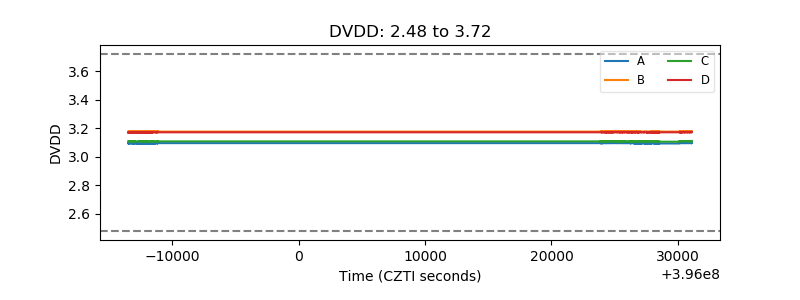 |
| Temperature 1 | 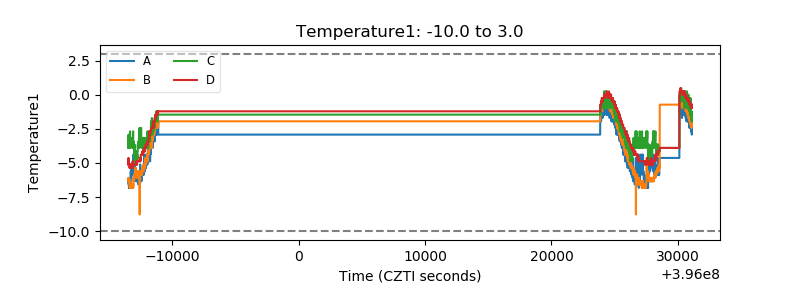 |
| Veto HV Monitor | 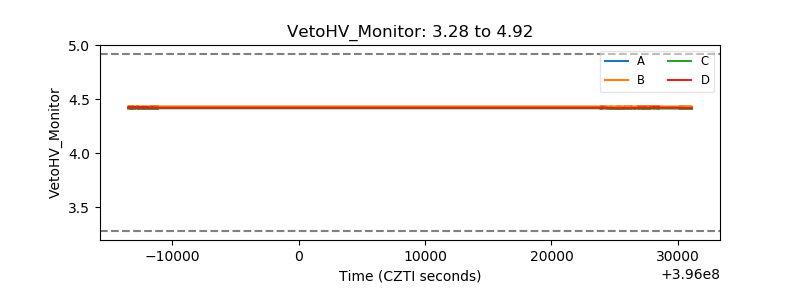 |
| Veto LLD | 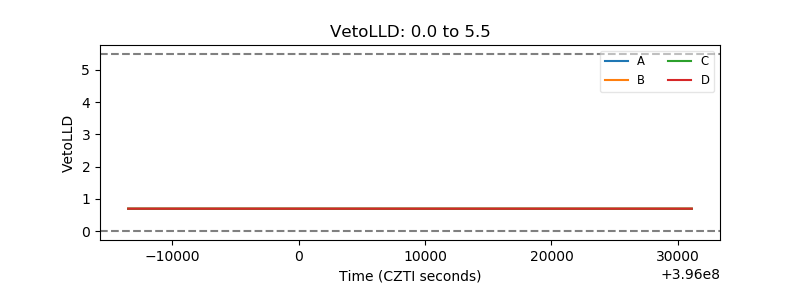 |
| Alpha Counter | 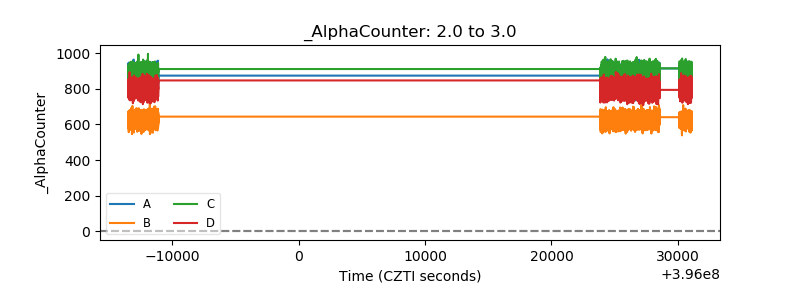 |
| _CPM_Rate | 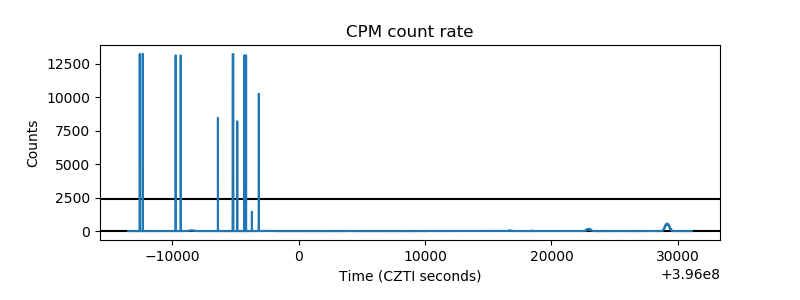 |
| CZT Counter | 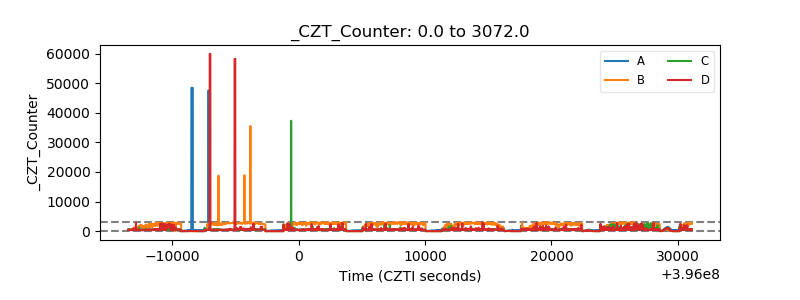 |
| +2.5 Volts monitor | 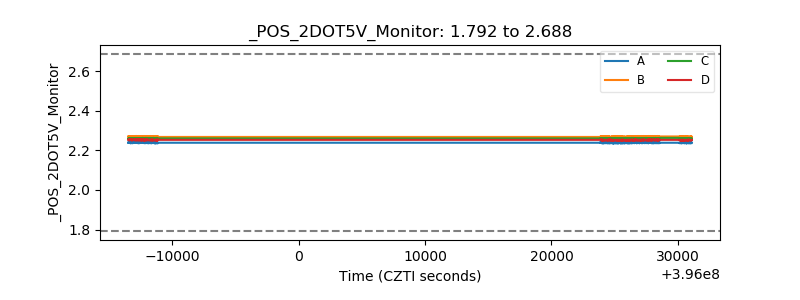 |
| +5 Volts monitor |  |
| _ROLL_ROT | 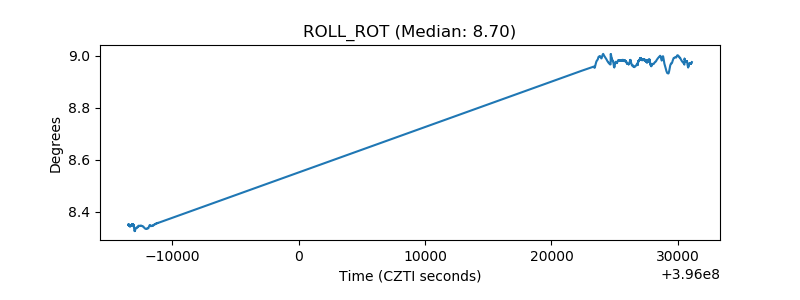 |
| _Roll_DEC | 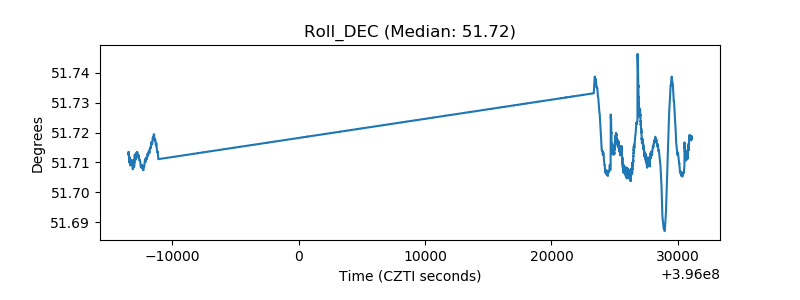 |
| _Roll_RA | 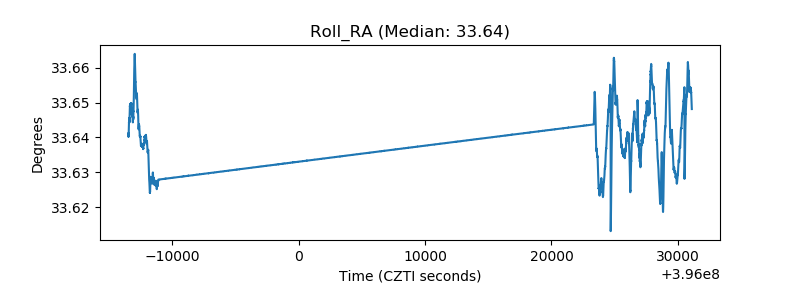 |
| Veto Counter | 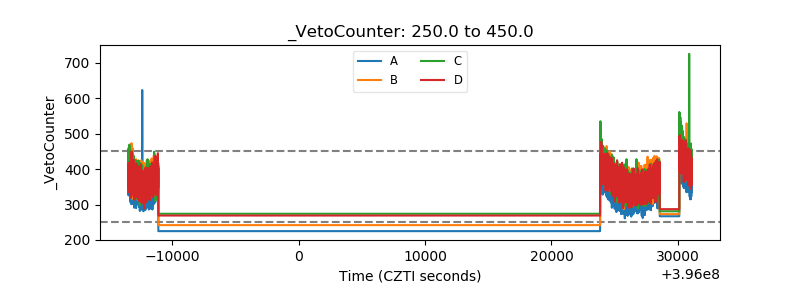 |