| Param | Original file | Final file |
|---|---|---|
| Filename | modeM0/AS1A11_075T01_9000005244_36821cztM0_level2.evt | modeM0/AS1A11_075T01_9000005244_36821cztM0_level2_quad_clean.evt |
| Size (bytes) | 2,001,542,400 | 146,874,240 |
| Size | 1.9 GB | 140.1 MB |
| Events in quadrant A | 7,054,611 | 1,016,279 |
| Events in quadrant B | 36,129,206 | 439,704 |
| Events in quadrant C | 7,938,594 | 1,020,212 |
| Events in quadrant D | 8,519,099 | 967,454 |
| Mode SS | |||
|---|---|---|---|
| Quadrant | BADHDUFLAG | Total packets | Discarded packets |
| A | 0 | 294 | 0 |
| B | 0 | 294 | 0 |
| C | 0 | 294 | 0 |
| D | 0 | 294 | 0 |
| Mode M0 | |||
|---|---|---|---|
| Quadrant | BADHDUFLAG | Total packets | Discarded packets |
| A | 0 | 30271 | 4 |
| B | 0 | 117167 | 3 |
| C | 0 | 32569 | 3 |
| D | 0 | 35326 | 3 |
| Mode M9 | |||
|---|---|---|---|
| Quadrant | BADHDUFLAG | Total packets | Discarded packets |
| A | 0 | 45 | 0 |
| B | 0 | 44 | 0 |
| C | 0 | 44 | 0 |
| D | 0 | 44 | 0 |
| Quadrant | Total seconds | Saturated seconds | Saturation percentage |
|---|---|---|---|
| A | 14491 | 31 | 0.213926% |
| B | 14491 | 13637 | 94.106687% |
| C | 14491 | 181 | 1.249051% |
| D | 14491 | 396 | 2.732731% |
Noise dominated data is calculated using 1-second bins in cleaned event files. If a bin has >2000 counts, and if more than 50% of those come from <1% of pixels, then it is considered to be noise-dominated and hence unusable.
| Quadrant | # 1 sec bins | Bins with >0 counts | Bins with >2000 counts | High rate bins dominated by noise | Noise dominated (total time) | Noise dominated (detector-on time) | Marked lightcurve |
|---|---|---|---|---|---|---|---|
| A | 44111 | 14494 | 13 | 13 | 0.03% | 0.09% | 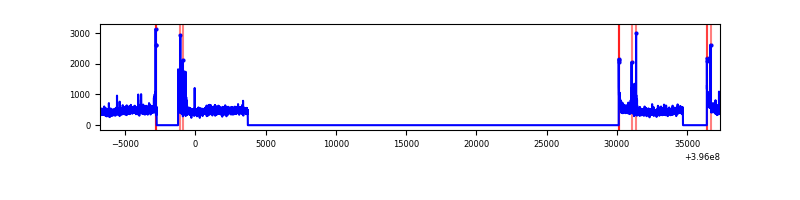 |
| B | 44110 | 14490 | 13278 | 13278 | 30.10% | 91.64% | 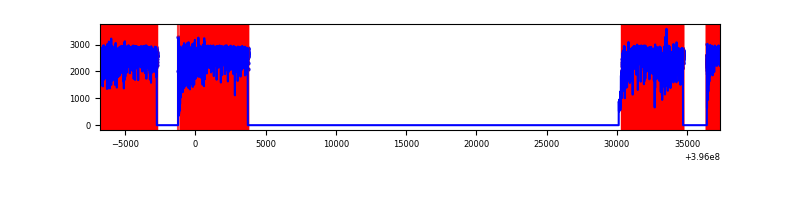 |
| C | 44111 | 14494 | 153 | 153 | 0.35% | 1.06% | 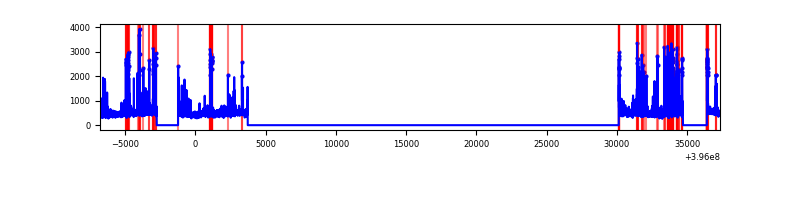 |
| D | 44111 | 14494 | 339 | 339 | 0.77% | 2.34% | 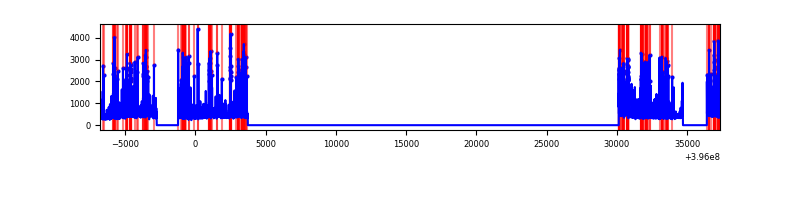 |
Top three noisy pixels from each quadrant. If the there are fewer than three noisy pixels in the level2.evt file, extra rows are filled as -1
| Pixel properties | Quadrant properties | ||||||
|---|---|---|---|---|---|---|---|
| Quadrant | DetID | PixID | Counts | Sigma | Mean | Median | Sigma |
| A | 10 | 83 | 510195 | 1522.75 | 1649 | 1615 | 334.0 |
| A | 9 | 143 | 78517 | 230.25 | 1649 | 1615 | 334.0 |
| A | 13 | 6 | 39765 | 114.23 | 1649 | 1615 | 334.0 |
| B | 12 | 1 | 32057021 | 225183.59 | 763 | 744 | 142.4 |
| B | 5 | 172 | 588194 | 4126.62 | 763 | 744 | 142.4 |
| B | 12 | 18 | 95867 | 668.2 | 763 | 744 | 142.4 |
| C | 14 | 254 | 786046 | 2113.08 | 1605 | 1617 | 371.2 |
| C | 15 | 214 | 611048 | 1641.67 | 1605 | 1617 | 371.2 |
| C | 0 | 10 | 126913 | 337.52 | 1605 | 1617 | 371.2 |
| D | 13 | 249 | 635871 | 1639.21 | 1597 | 1554 | 387.0 |
| D | 2 | 250 | 570834 | 1471.14 | 1597 | 1554 | 387.0 |
| D | 2 | 153 | 305004 | 784.18 | 1597 | 1554 | 387.0 |
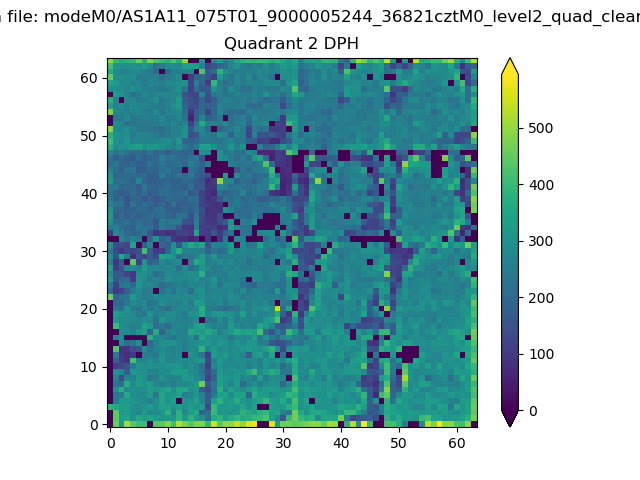
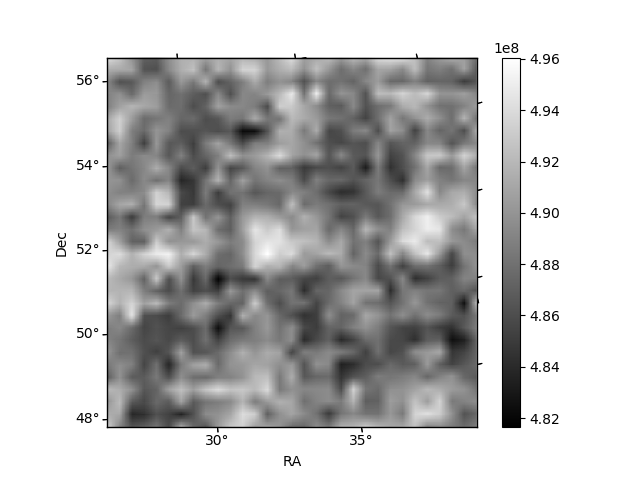
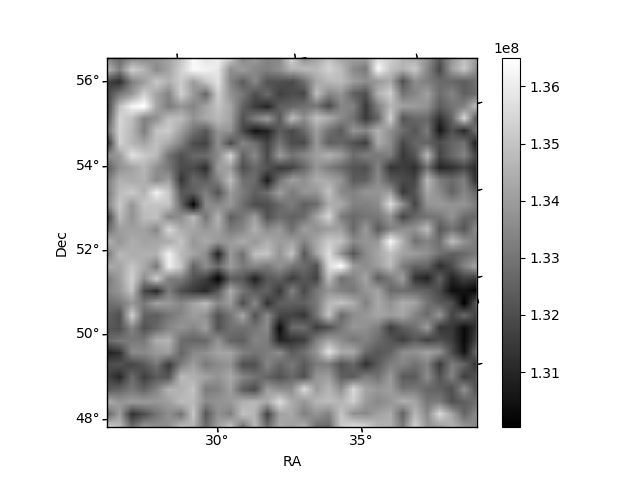
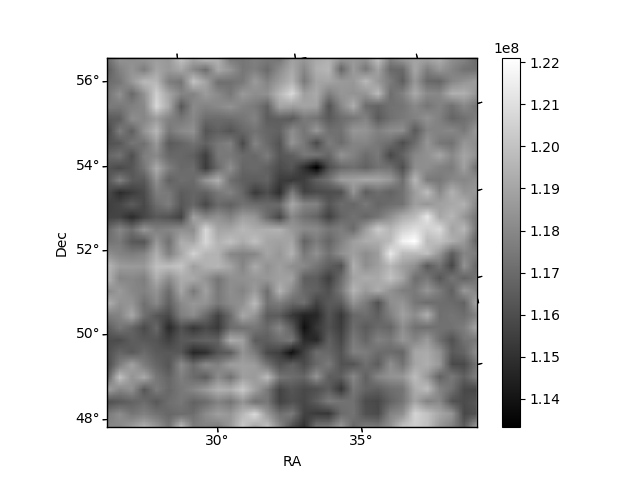
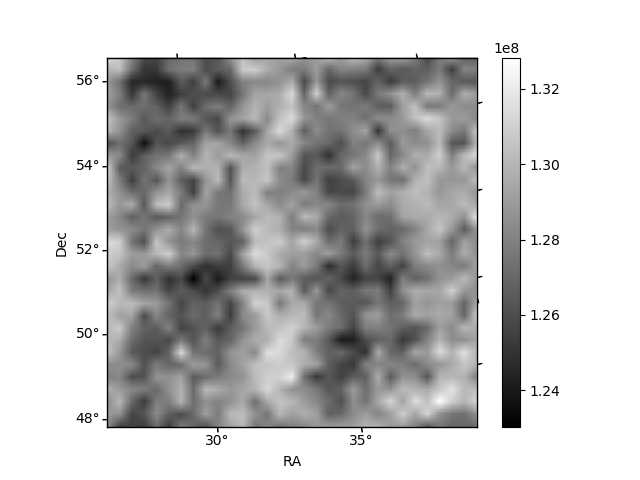
Histogram calculated using DETX and DETY for each event in the final _common_clean file
| Quadrant A | 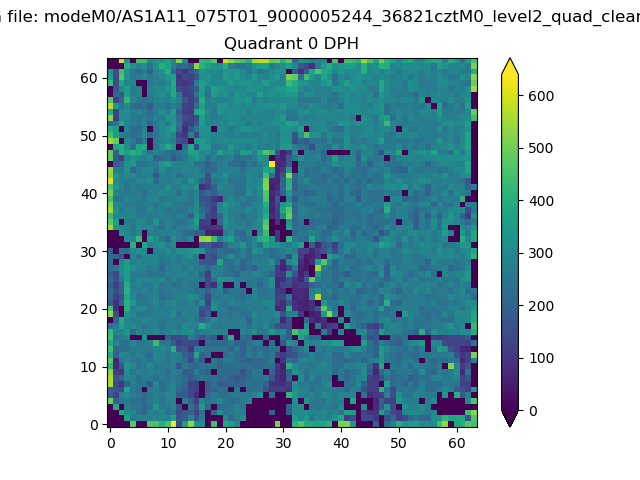 |
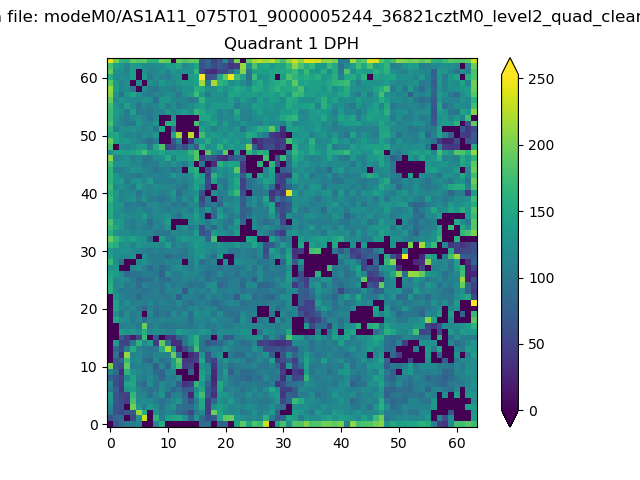 |
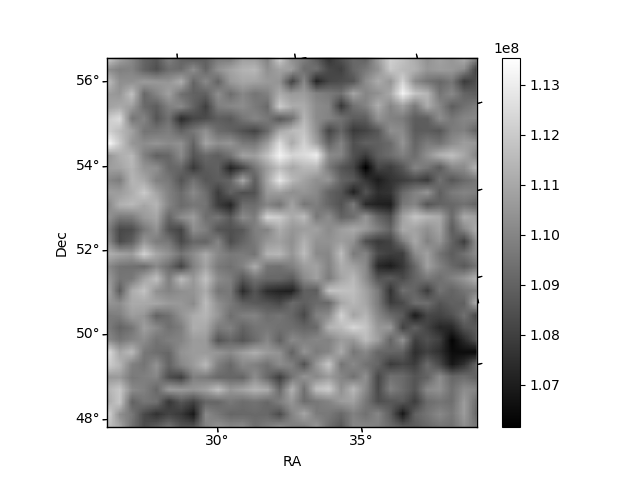
Quadrant B |
|---|---|---|---|
| Quadrant D | 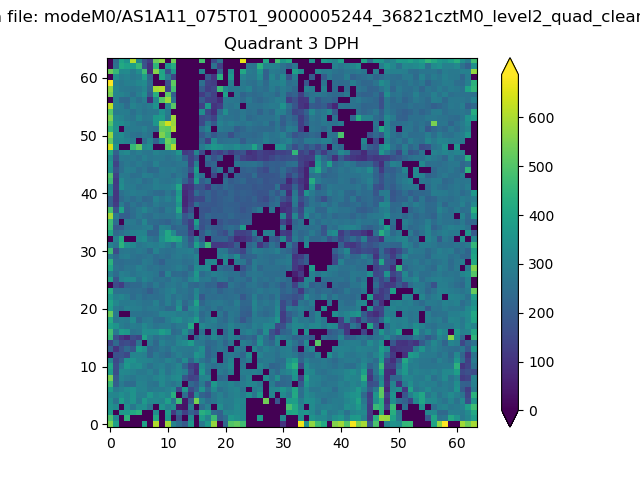 |
 |
Quadrant C |
| Plot type | Count rate plots | Images |
|---|---|---|
| Comparison with Poisson distribution Blue bars denote a histogram of data divided into 1 sec bins. Red curve is a Poisson curve with rate = median count rate of data. |
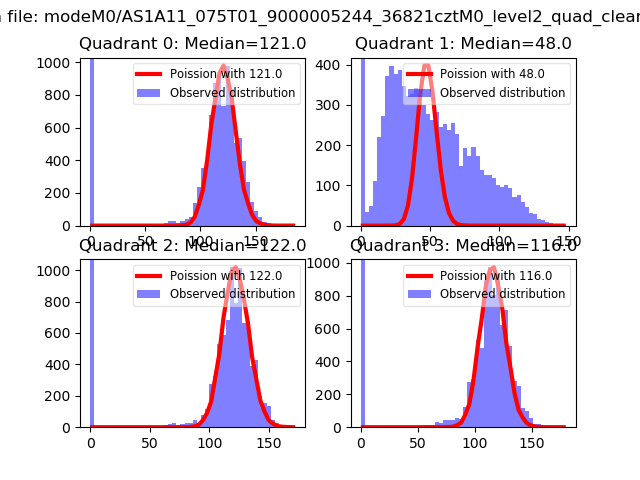 |
 |
| Quadrant-wise count rates Data is divided into 100 sec bins |
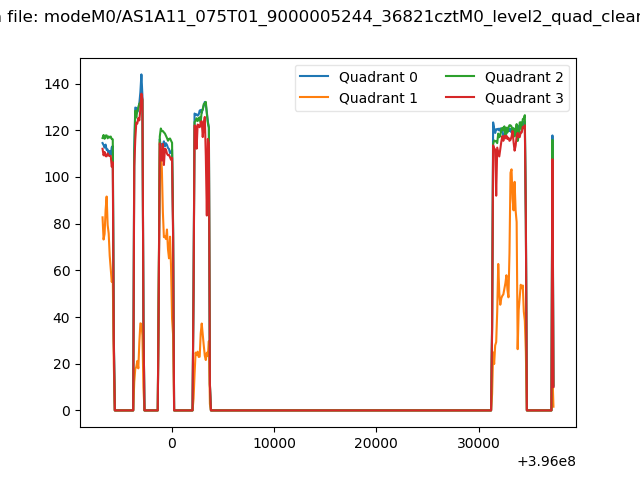 |
|
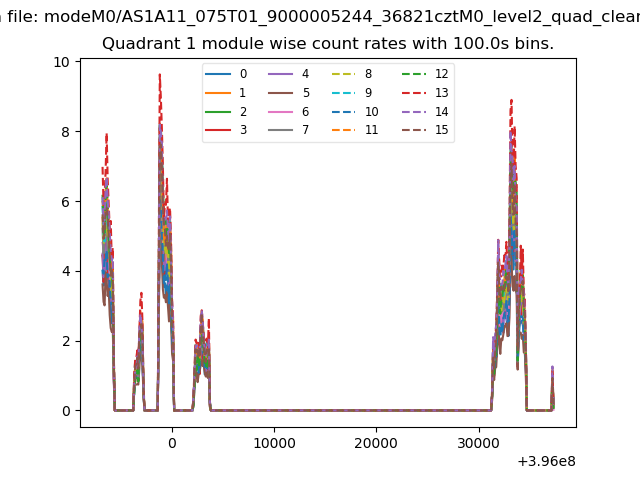
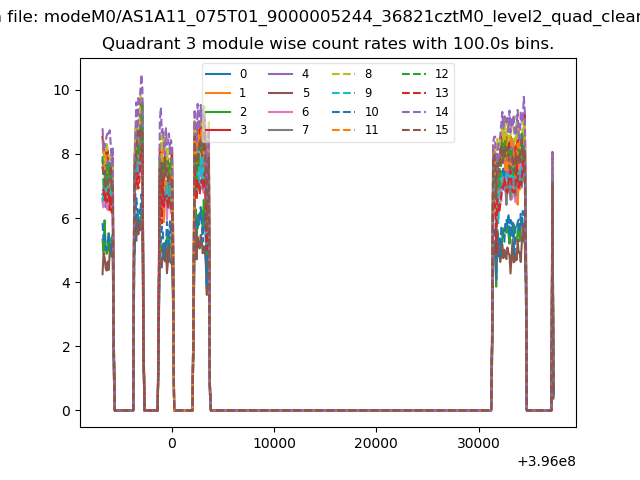
| Module-wise count rates for Quadrant A Data is divided into 100 sec bins |
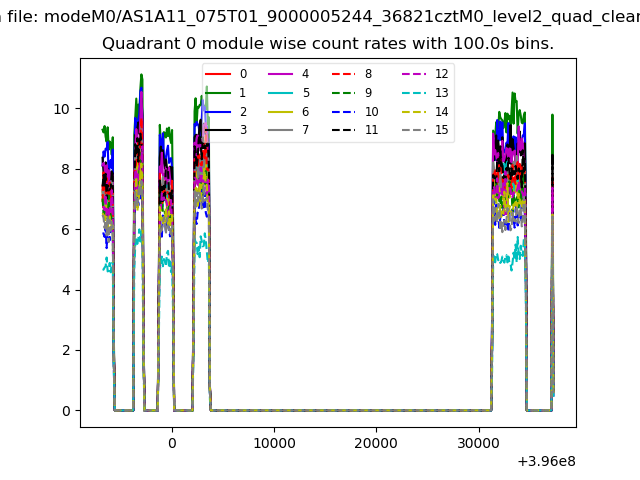 |
 |
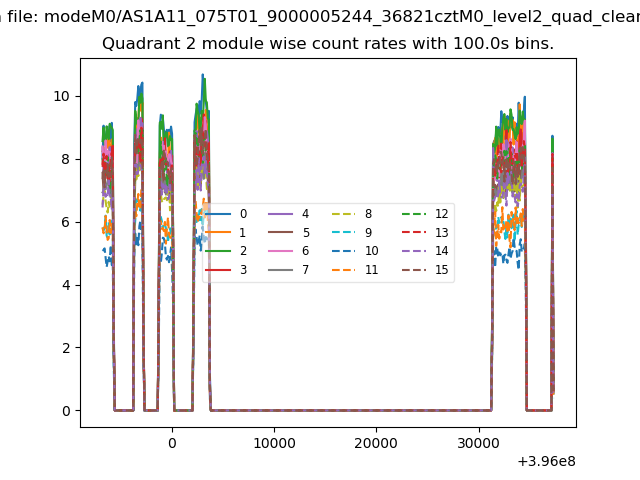
| Module-wise count rates for Quadrant B Data is divided into 100 sec bins |
 |
 |
| Module-wise count rates for Quadrant C Data is divided into 100 sec bins |
 |
 |
| Module-wise count rates for Quadrant D Data is divided into 100 sec bins |
 |
 |
| Parameter | Plot |
|---|---|
| CZT HV Monitor | 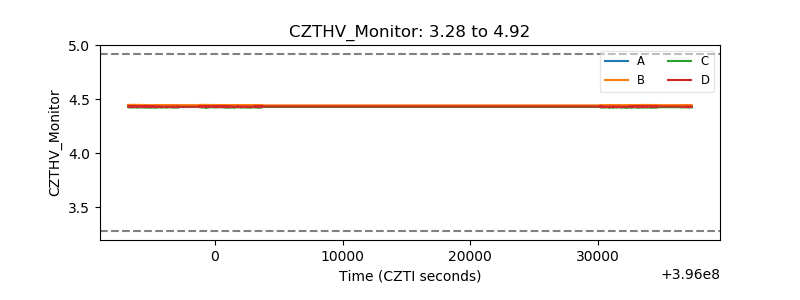 |
| D_VDD | 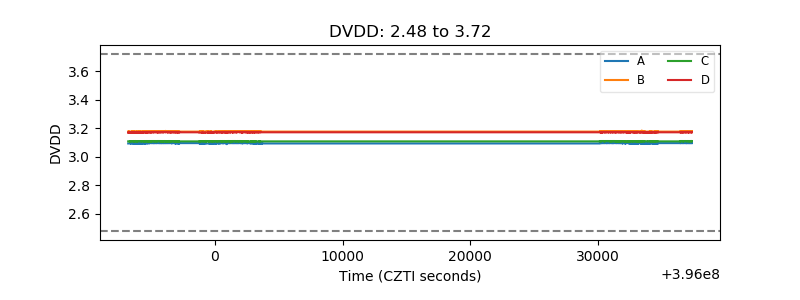 |
| Temperature 1 | 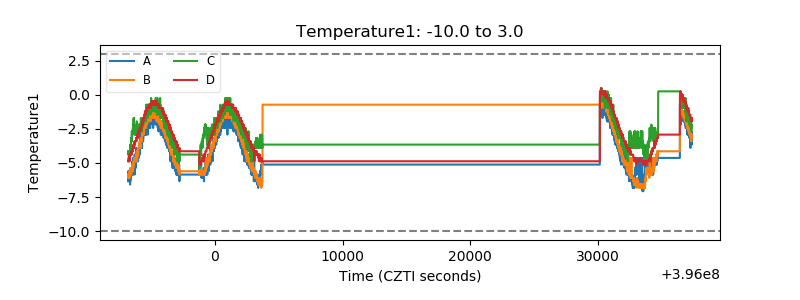 |
| Veto HV Monitor | 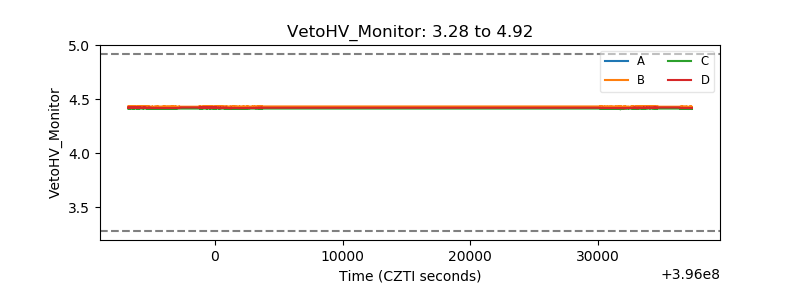 |
| Veto LLD | 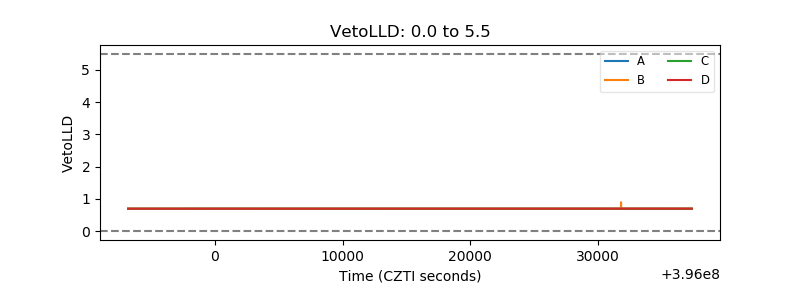 |
| Alpha Counter | 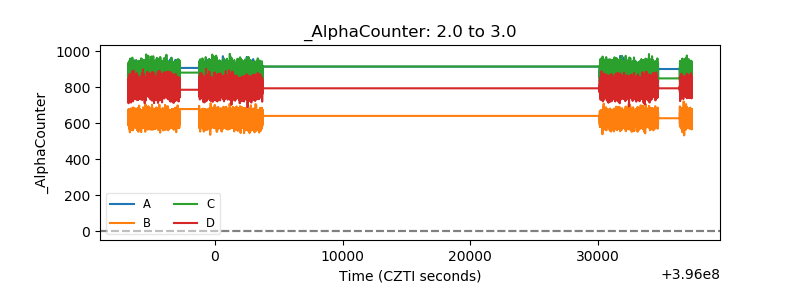 |
| _CPM_Rate | 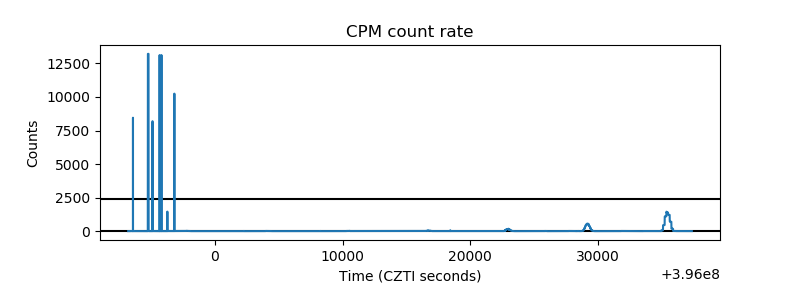 |
| CZT Counter | 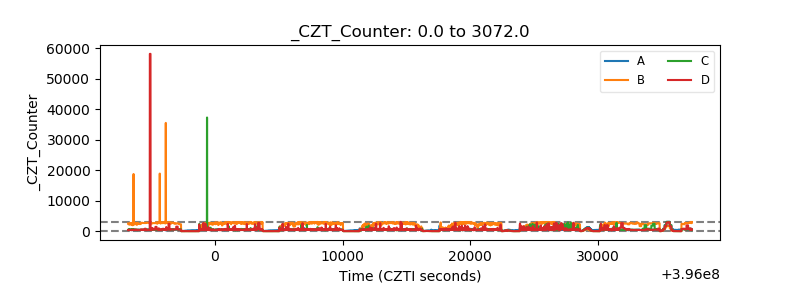 |
| +2.5 Volts monitor | 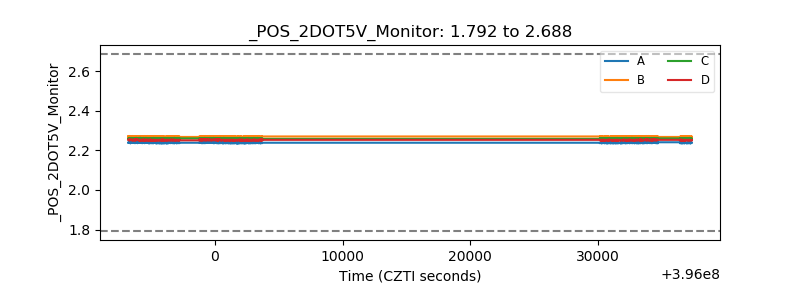 |
| +5 Volts monitor |  |
| _ROLL_ROT | 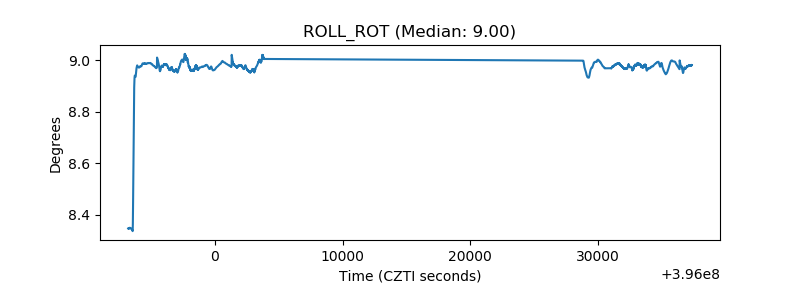 |
| _Roll_DEC | 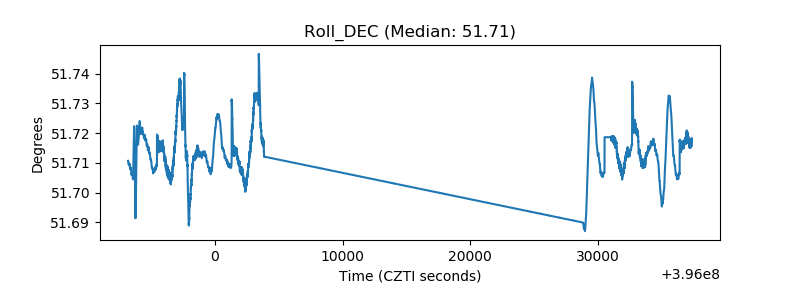 |
| _Roll_RA | 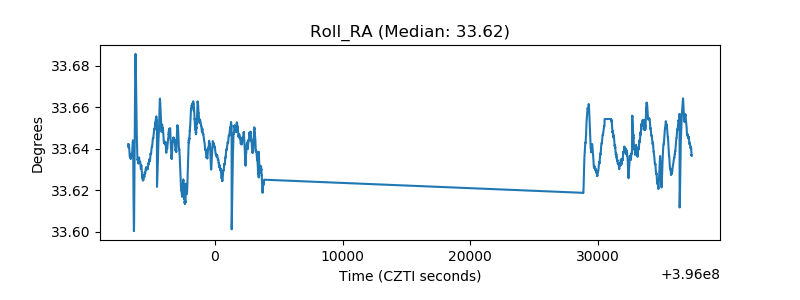 |
| Veto Counter | 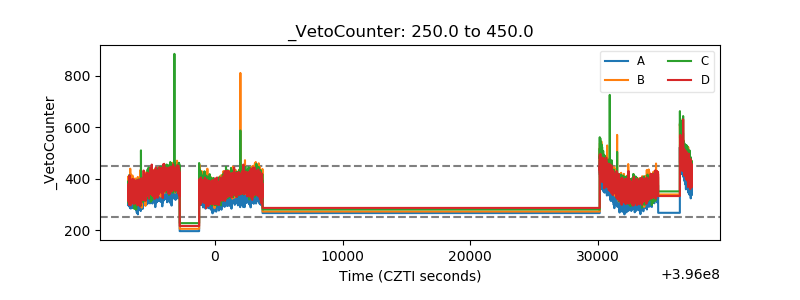 |