| Param | Original file | Final file |
|---|---|---|
| Filename | modeM0/AS1A11_075T01_9000005244_36823cztM0_level2.evt | modeM0/AS1A11_075T01_9000005244_36823cztM0_level2_quad_clean.evt |
| Size (bytes) | 779,860,800 | 67,000,320 |
| Size | 743.7 MB | 63.9 MB |
| Events in quadrant A | 2,737,398 | 501,712 |
| Events in quadrant B | 13,122,195 | 205,224 |
| Events in quadrant C | 3,148,232 | 503,425 |
| Events in quadrant D | 4,256,837 | 450,246 |
| Mode SS | |||
|---|---|---|---|
| Quadrant | BADHDUFLAG | Total packets | Discarded packets |
| A | 0 | 108 | 0 |
| B | 0 | 108 | 0 |
| C | 0 | 108 | 0 |
| D | 0 | 108 | 0 |
| Mode M0 | |||
|---|---|---|---|
| Quadrant | BADHDUFLAG | Total packets | Discarded packets |
| A | 0 | 11543 | 3 |
| B | 0 | 42500 | 2 |
| C | 0 | 12644 | 2 |
| D | 0 | 16136 | 2 |
| Mode M9 | |||
|---|---|---|---|
| Quadrant | BADHDUFLAG | Total packets | Discarded packets |
| A | 0 | 19 | 0 |
| B | 0 | 19 | 0 |
| C | 0 | 19 | 0 |
| D | 0 | 20 | 0 |
| Quadrant | Total seconds | Saturated seconds | Saturation percentage |
|---|---|---|---|
| A | 5221 | 28 | 0.536296% |
| B | 5221 | 5104 | 97.759050% |
| C | 5221 | 123 | 2.355871% |
| D | 5221 | 514 | 9.844857% |
Noise dominated data is calculated using 1-second bins in cleaned event files. If a bin has >2000 counts, and if more than 50% of those come from <1% of pixels, then it is considered to be noise-dominated and hence unusable.
| Quadrant | # 1 sec bins | Bins with >0 counts | Bins with >2000 counts | High rate bins dominated by noise | Noise dominated (total time) | Noise dominated (detector-on time) | Marked lightcurve |
|---|---|---|---|---|---|---|---|
| A | 7044 | 5222 | 15 | 15 | 0.21% | 0.29% | 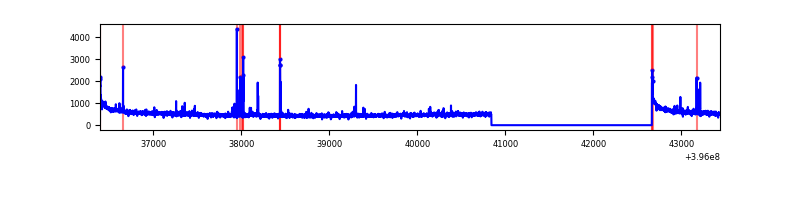 |
| B | 7043 | 5220 | 4941 | 4941 | 70.15% | 94.66% | 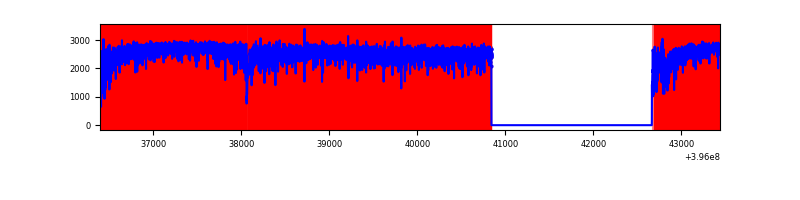 |
| C | 7044 | 5222 | 90 | 90 | 1.28% | 1.72% | 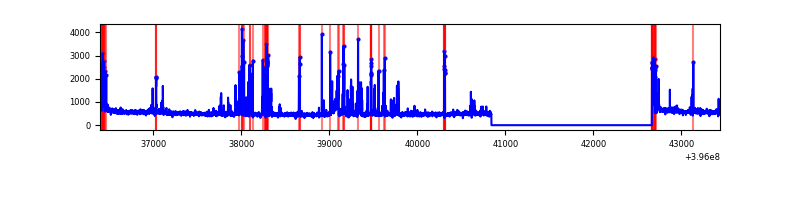 |
| D | 7044 | 5222 | 498 | 498 | 7.07% | 9.54% | 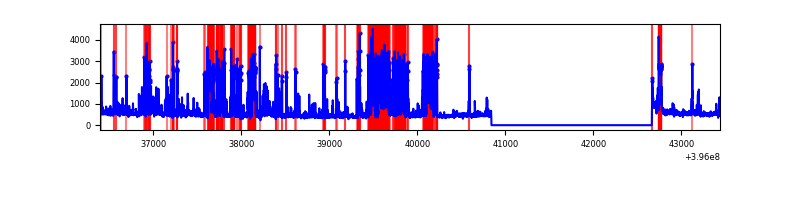 |
Top three noisy pixels from each quadrant. If the there are fewer than three noisy pixels in the level2.evt file, extra rows are filled as -1
| Pixel properties | Quadrant properties | ||||||
|---|---|---|---|---|---|---|---|
| Quadrant | DetID | PixID | Counts | Sigma | Mean | Median | Sigma |
| A | 10 | 83 | 244408 | 1972.12 | 610 | 598 | 123.6 |
| A | 0 | 247 | 51865 | 414.69 | 610 | 598 | 123.6 |
| A | 13 | 248 | 28458 | 225.35 | 610 | 598 | 123.6 |
| B | 12 | 1 | 11245755 | 195644.56 | 300 | 293 | 57.5 |
| B | 5 | 172 | 454195 | 7896.83 | 300 | 293 | 57.5 |
| B | 0 | 221 | 61260 | 1060.68 | 300 | 293 | 57.5 |
| C | 14 | 254 | 454312 | 3268.55 | 597 | 603 | 138.8 |
| C | 15 | 214 | 223316 | 1604.44 | 597 | 603 | 138.8 |
| C | 0 | 10 | 119760 | 858.41 | 597 | 603 | 138.8 |
| D | 1 | 52 | 1385030 | 9931.15 | 572 | 557 | 139.4 |
| D | 12 | 233 | 244686 | 1751.2 | 572 | 557 | 139.4 |
| D | 13 | 249 | 207818 | 1486.73 | 572 | 557 | 139.4 |
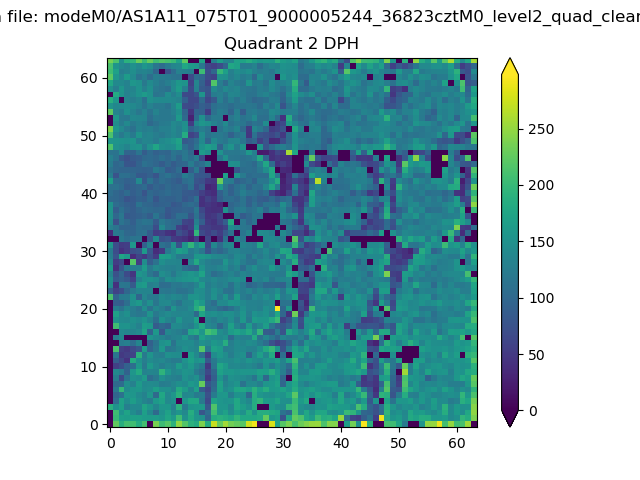
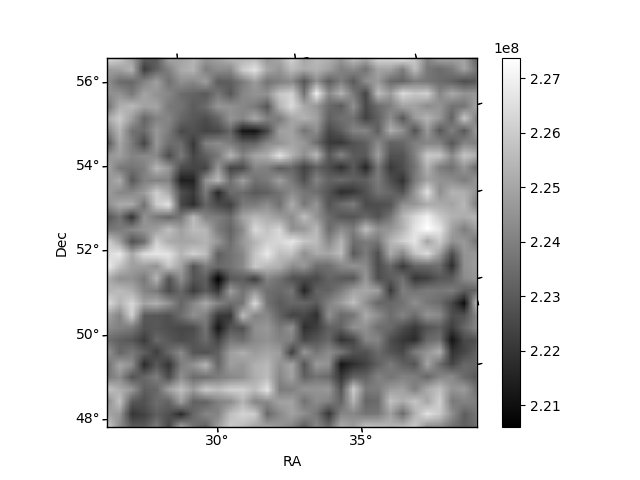
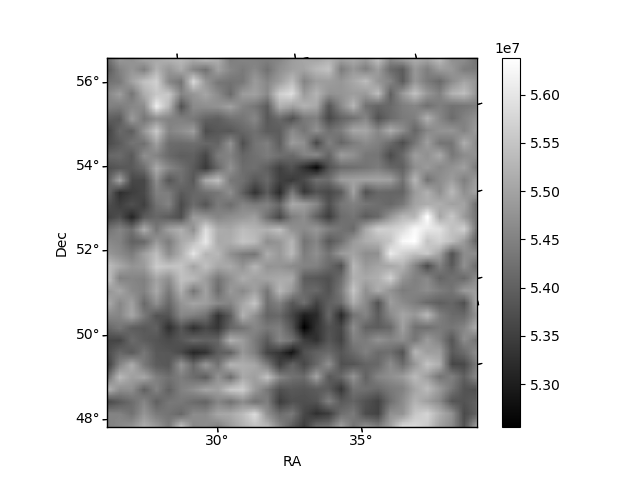
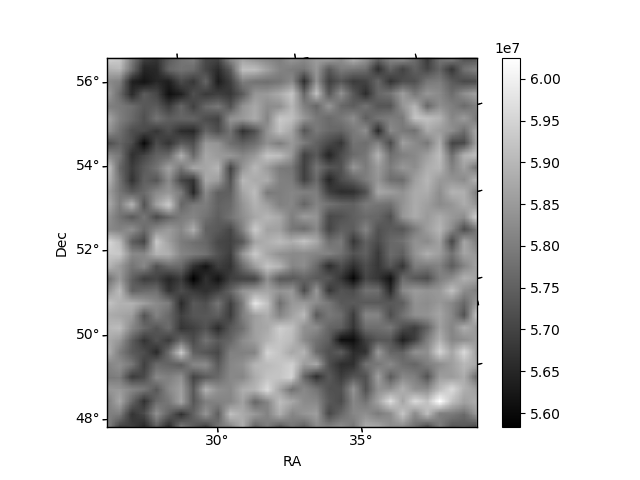
Histogram calculated using DETX and DETY for each event in the final _common_clean file
| Quadrant A | 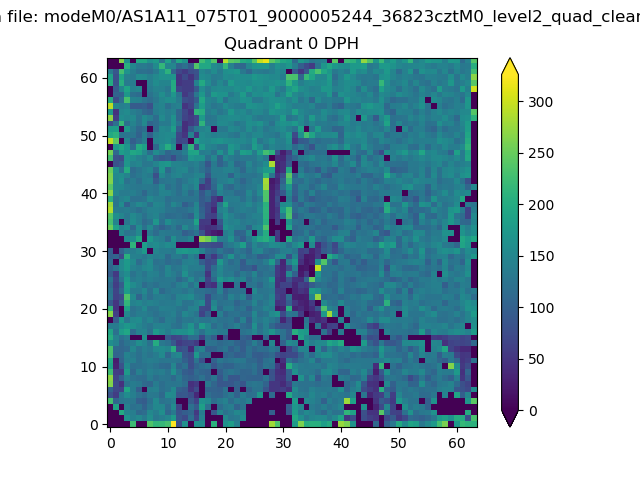 |
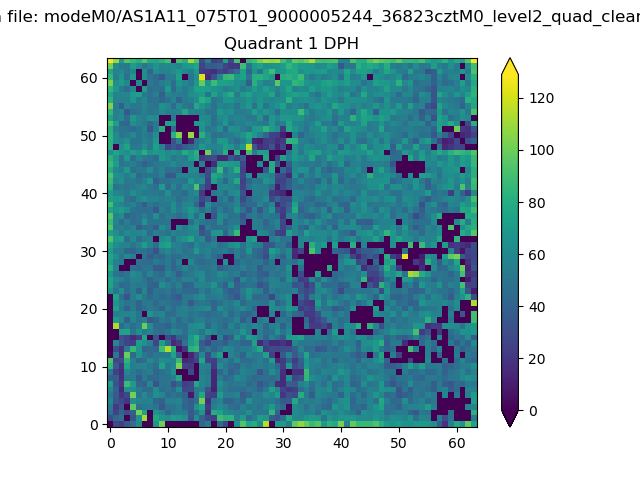 |
Quadrant B |
|---|---|---|---|
| Quadrant D | 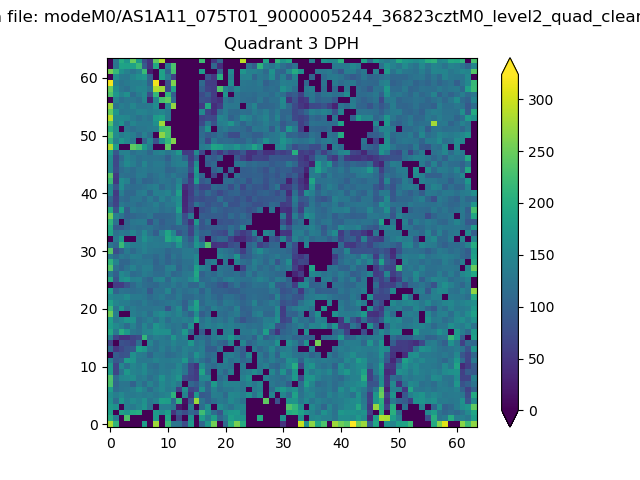 |
 |
Quadrant C |
| Plot type | Count rate plots | Images |
|---|---|---|
| Comparison with Poisson distribution Blue bars denote a histogram of data divided into 1 sec bins. Red curve is a Poisson curve with rate = median count rate of data. |
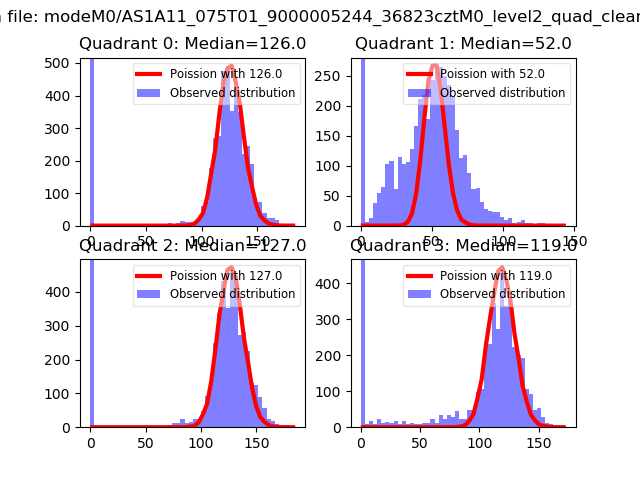 |
 |
| Quadrant-wise count rates Data is divided into 100 sec bins |
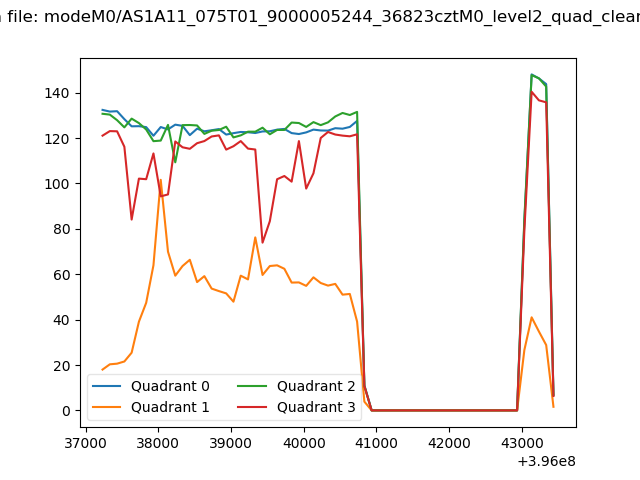 |
|
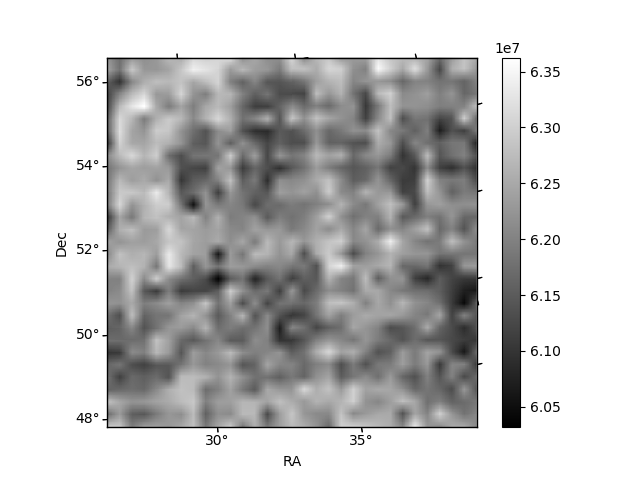
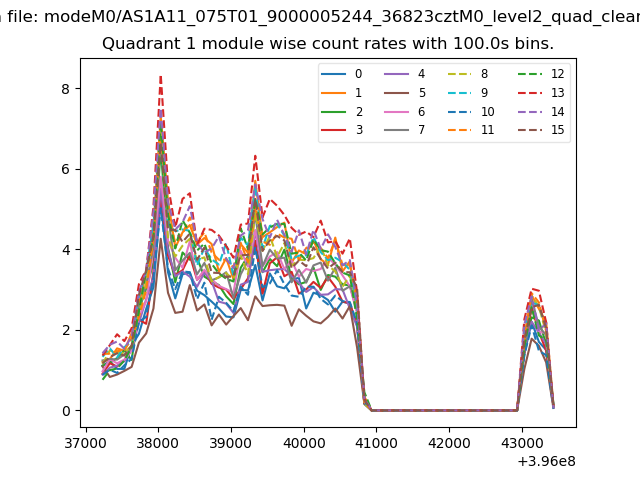
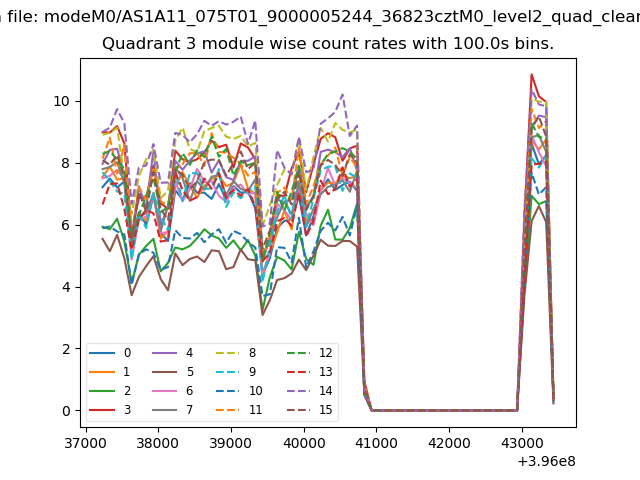
| Module-wise count rates for Quadrant A Data is divided into 100 sec bins |
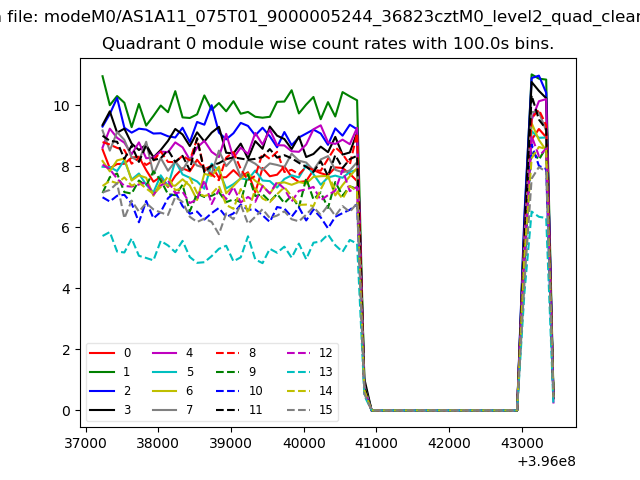 |
 |
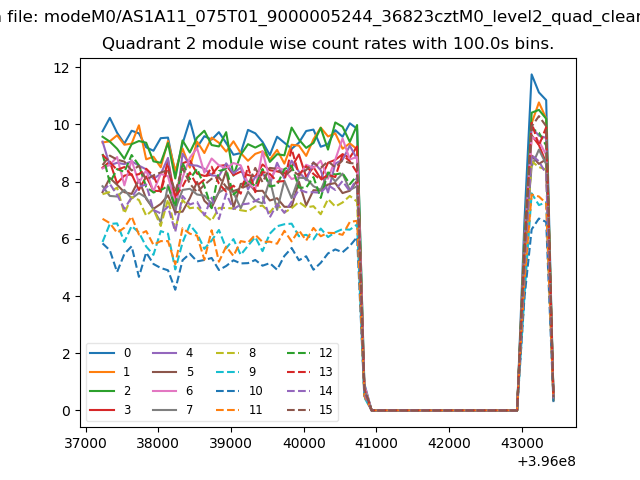
| Module-wise count rates for Quadrant B Data is divided into 100 sec bins |
 |
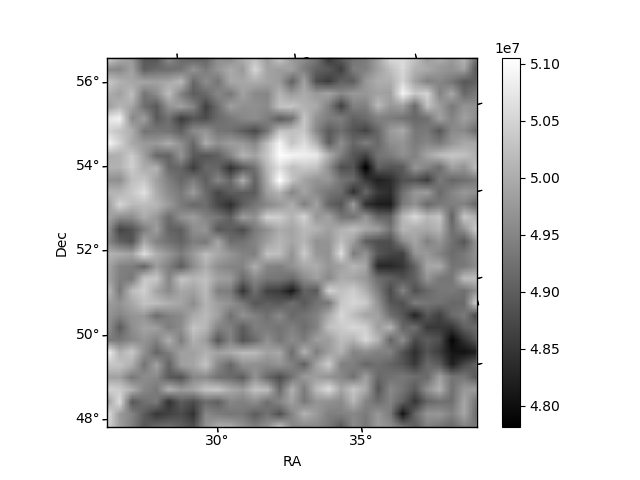 |
| Module-wise count rates for Quadrant C Data is divided into 100 sec bins |
 |
 |
| Module-wise count rates for Quadrant D Data is divided into 100 sec bins |
 |
 |
| Parameter | Plot |
|---|---|
| CZT HV Monitor | 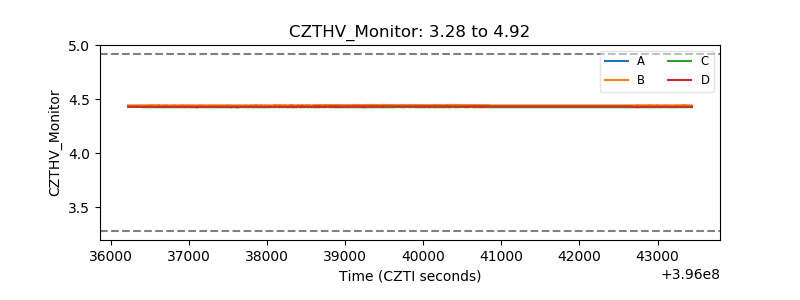 |
| D_VDD | 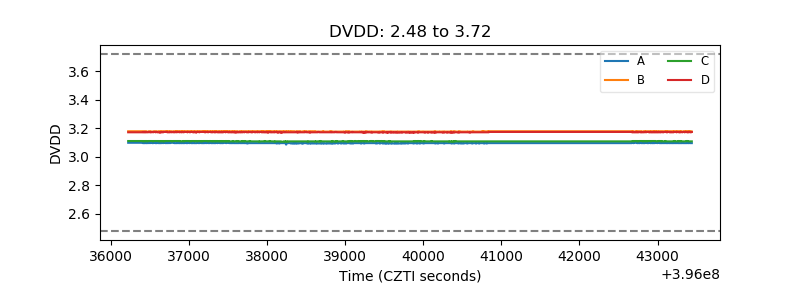 |
| Temperature 1 |  |
| Veto HV Monitor | 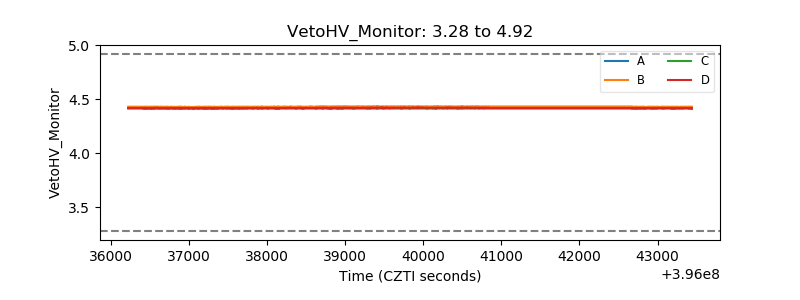 |
| Veto LLD | 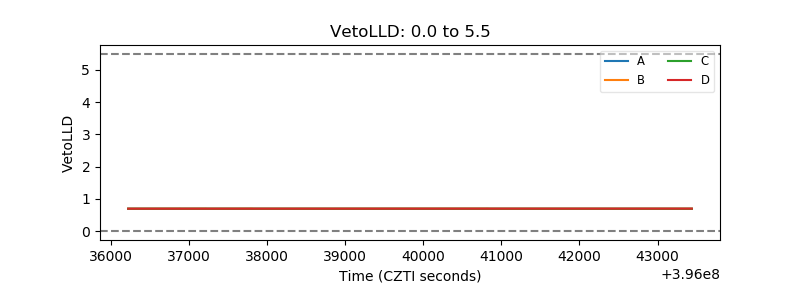 |
| Alpha Counter | 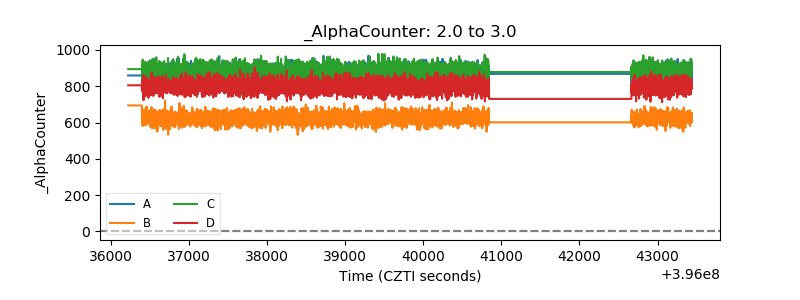 |
| _CPM_Rate | 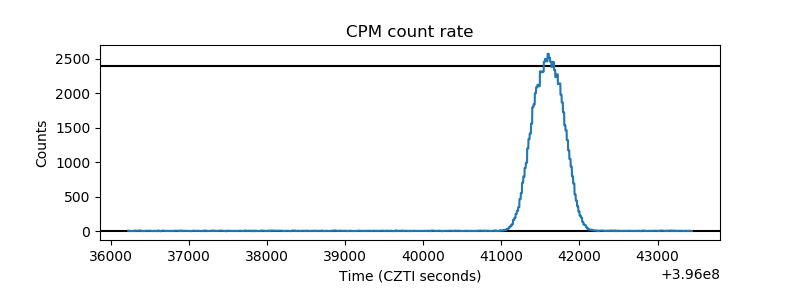 |
| CZT Counter | 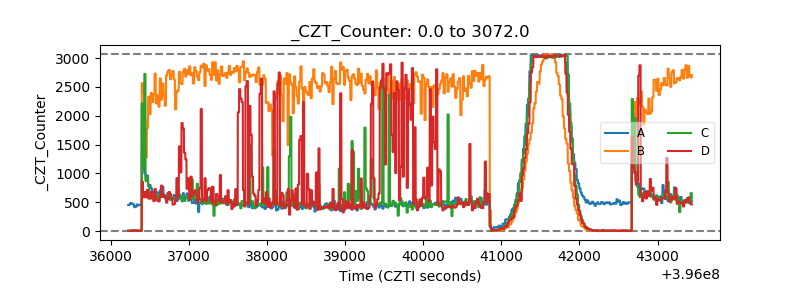 |
| +2.5 Volts monitor |  |
| +5 Volts monitor |  |
| _ROLL_ROT | 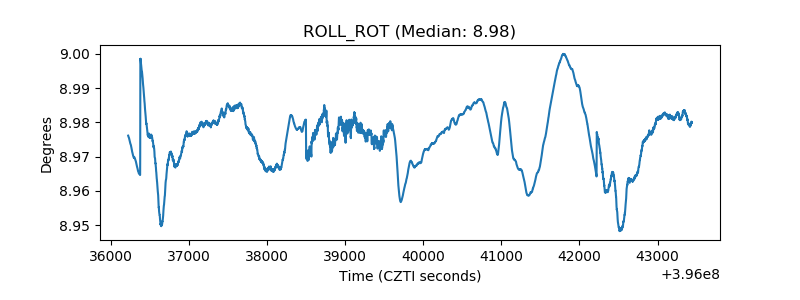 |
| _Roll_DEC | 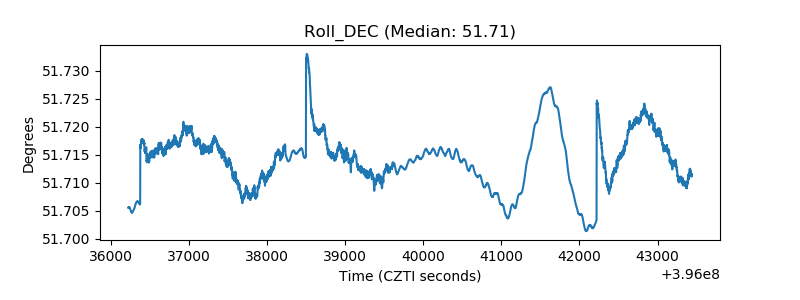 |
| _Roll_RA | 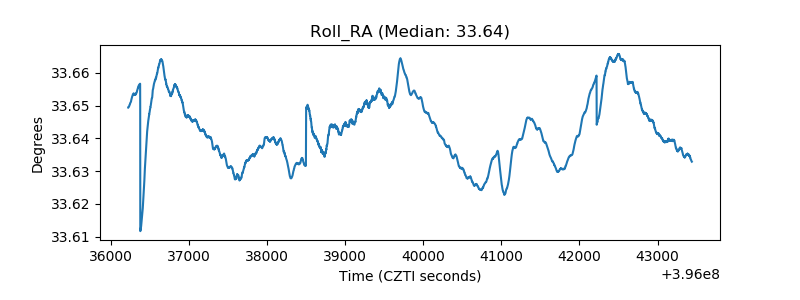 |
| Veto Counter | 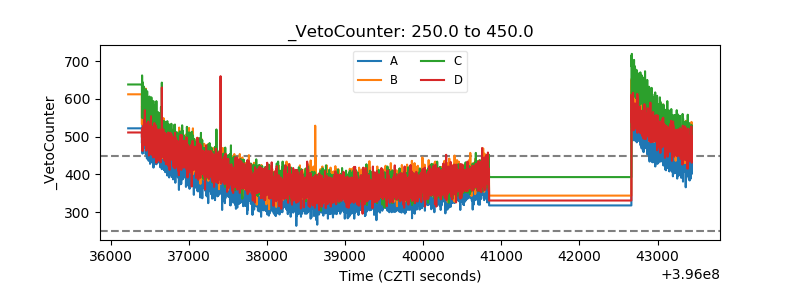 |