| Param | Original file | Final file |
|---|---|---|
| Filename | modeM0/AS1A11_075T01_9000005244_36824cztM0_level2.evt | modeM0/AS1A11_075T01_9000005244_36824cztM0_level2_quad_clean.evt |
| Size (bytes) | 682,640,640 | 86,834,880 |
| Size | 651.0 MB | 82.8 MB |
| Events in quadrant A | 2,663,211 | 629,639 |
| Events in quadrant B | 11,364,622 | 397,960 |
| Events in quadrant C | 3,048,935 | 639,828 |
| Events in quadrant D | 3,248,454 | 599,833 |
| Mode SS | |||
|---|---|---|---|
| Quadrant | BADHDUFLAG | Total packets | Discarded packets |
| A | 0 | 104 | 0 |
| B | 0 | 104 | 0 |
| C | 0 | 104 | 0 |
| D | 0 | 104 | 0 |
| Mode M0 | |||
|---|---|---|---|
| Quadrant | BADHDUFLAG | Total packets | Discarded packets |
| A | 0 | 11242 | 3 |
| B | 0 | 37224 | 2 |
| C | 0 | 12274 | 2 |
| D | 0 | 13154 | 2 |
| Mode M9 | |||
|---|---|---|---|
| Quadrant | BADHDUFLAG | Total packets | Discarded packets |
| A | 0 | 35 | 0 |
| B | 0 | 35 | 0 |
| C | 0 | 35 | 0 |
| D | 0 | 36 | 0 |
| Quadrant | Total seconds | Saturated seconds | Saturation percentage |
|---|---|---|---|
| A | 5151 | 15 | 0.291206% |
| B | 5151 | 4093 | 79.460299% |
| C | 5151 | 79 | 1.533683% |
| D | 5151 | 162 | 3.145020% |
Noise dominated data is calculated using 1-second bins in cleaned event files. If a bin has >2000 counts, and if more than 50% of those come from <1% of pixels, then it is considered to be noise-dominated and hence unusable.
| Quadrant | # 1 sec bins | Bins with >0 counts | Bins with >2000 counts | High rate bins dominated by noise | Noise dominated (total time) | Noise dominated (detector-on time) | Marked lightcurve |
|---|---|---|---|---|---|---|---|
| A | 7095 | 5152 | 11 | 11 | 0.16% | 0.21% | 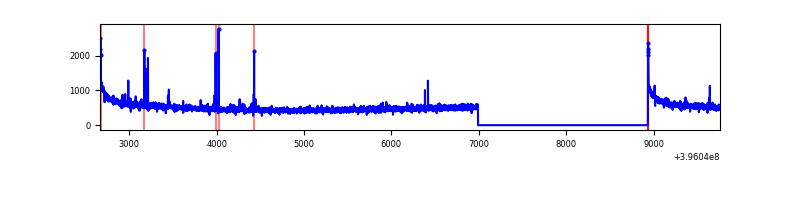 |
| B | 7095 | 5151 | 3905 | 3905 | 55.04% | 75.81% |  |
| C | 7095 | 5152 | 59 | 59 | 0.83% | 1.15% | 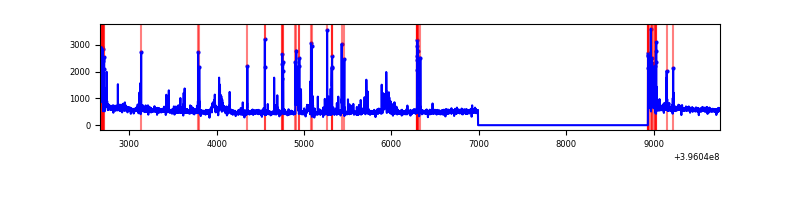 |
| D | 7095 | 5152 | 167 | 167 | 2.35% | 3.24% | 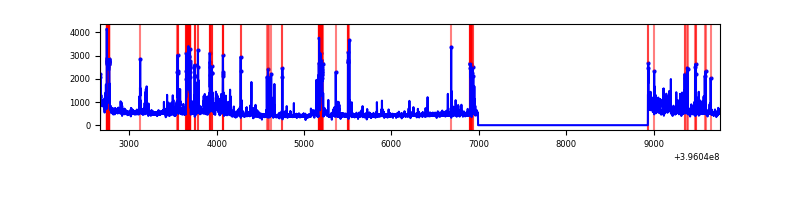 |
Top three noisy pixels from each quadrant. If the there are fewer than three noisy pixels in the level2.evt file, extra rows are filled as -1
| Pixel properties | Quadrant properties | ||||||
|---|---|---|---|---|---|---|---|
| Quadrant | DetID | PixID | Counts | Sigma | Mean | Median | Sigma |
| A | 10 | 83 | 233590 | 1870.65 | 611 | 601 | 124.5 |
| A | 9 | 143 | 25526 | 200.12 | 611 | 601 | 124.5 |
| A | 13 | 6 | 16287 | 125.94 | 611 | 601 | 124.5 |
| B | 12 | 1 | 8701256 | 107590.44 | 424 | 413 | 80.9 |
| B | 5 | 172 | 305575 | 3773.49 | 424 | 413 | 80.9 |
| B | 0 | 190 | 234693 | 2896.99 | 424 | 413 | 80.9 |
| C | 0 | 207 | 239320 | 1709.82 | 604 | 611 | 139.6 |
| C | 15 | 214 | 216283 | 1544.81 | 604 | 611 | 139.6 |
| C | 0 | 10 | 128930 | 919.12 | 604 | 611 | 139.6 |
| D | 12 | 233 | 387534 | 2693.27 | 593 | 580 | 143.7 |
| D | 13 | 249 | 273046 | 1896.41 | 593 | 580 | 143.7 |
| D | 2 | 249 | 104778 | 725.24 | 593 | 580 | 143.7 |
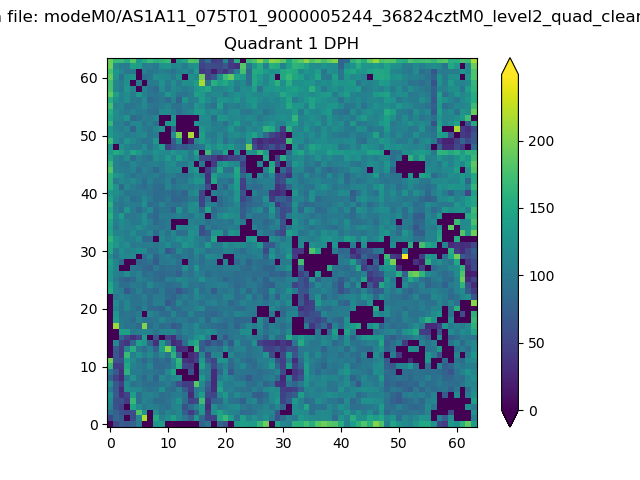
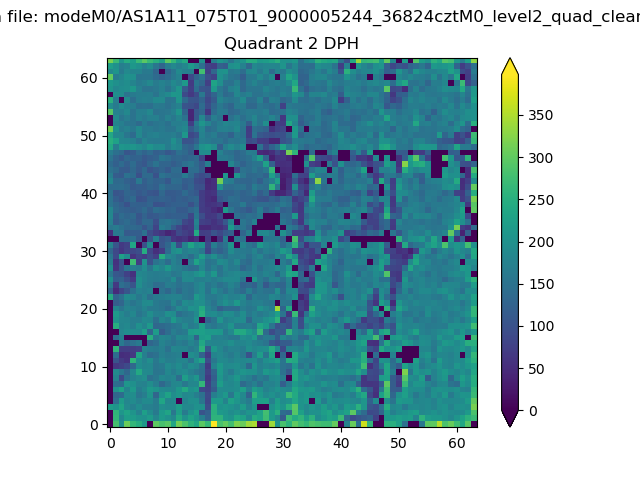
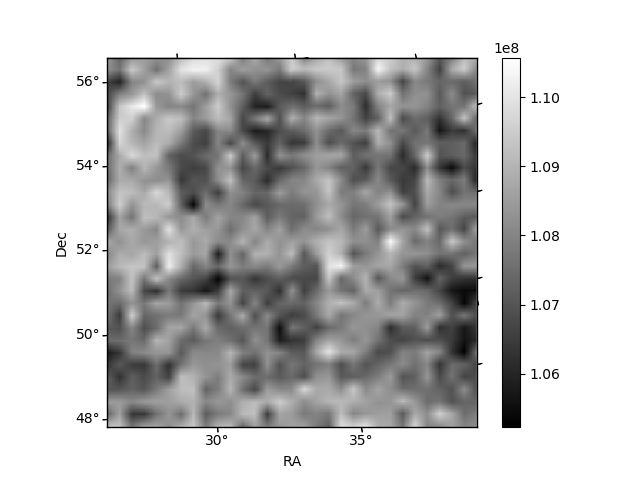
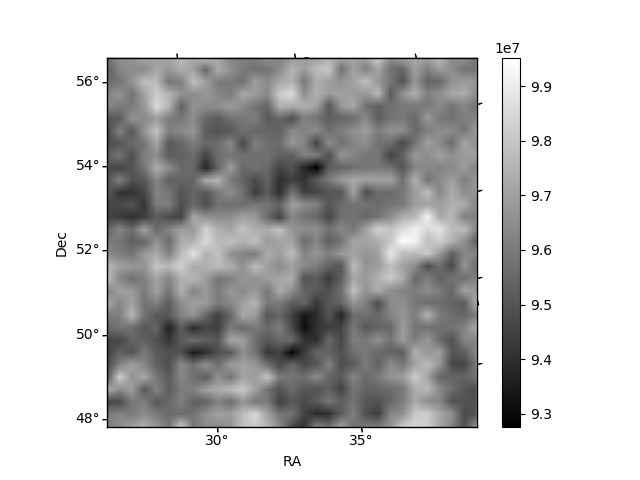
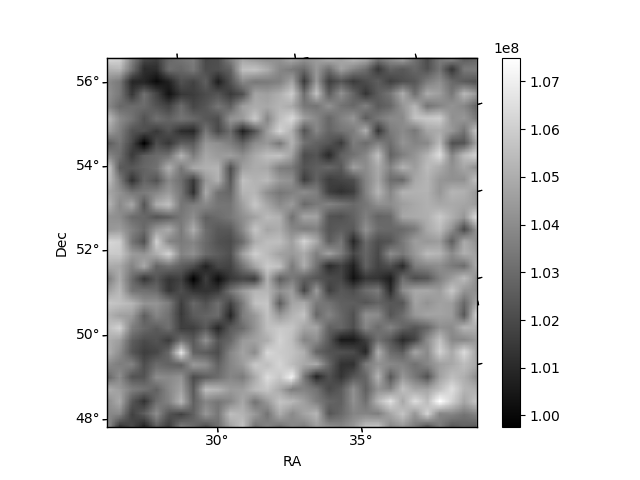
Histogram calculated using DETX and DETY for each event in the final _common_clean file
| Quadrant A | 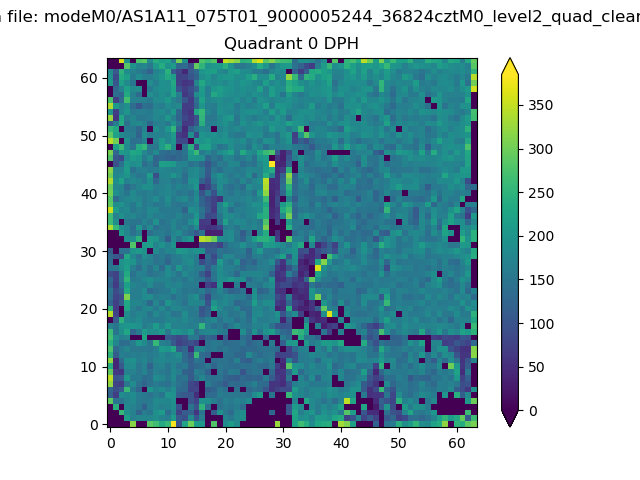 |
 |
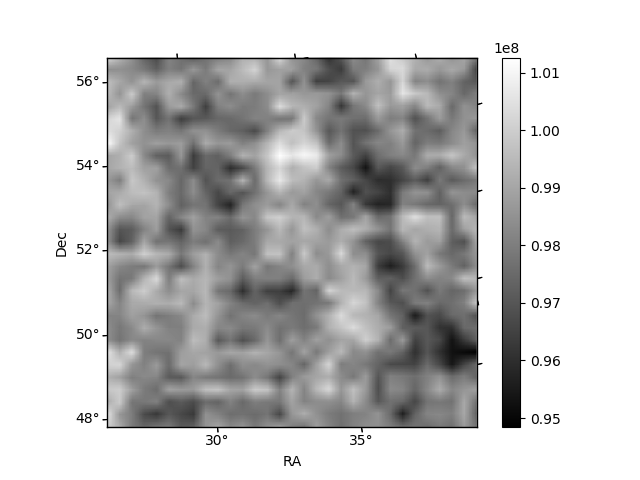
Quadrant B |
|---|---|---|---|
| Quadrant D |  |
 |
Quadrant C |
| Plot type | Count rate plots | Images |
|---|---|---|
| Comparison with Poisson distribution Blue bars denote a histogram of data divided into 1 sec bins. Red curve is a Poisson curve with rate = median count rate of data. |
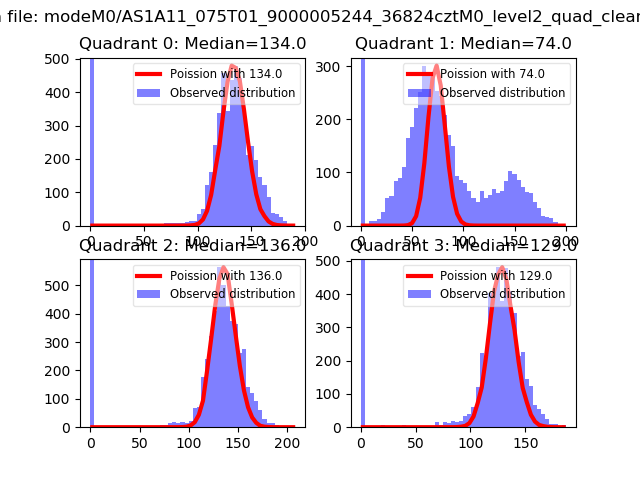 |
 |
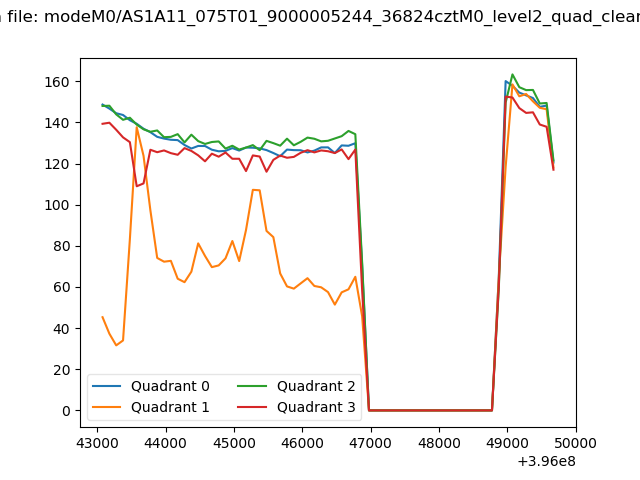
| Quadrant-wise count rates Data is divided into 100 sec bins |
 |
|
| Module-wise count rates for Quadrant A Data is divided into 100 sec bins |
 |
 |
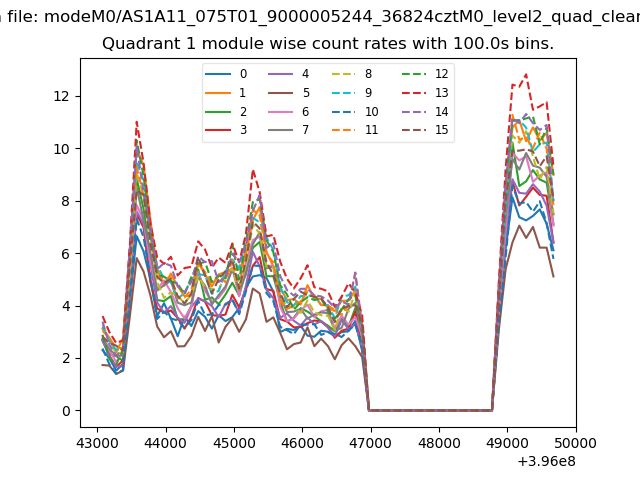
| Module-wise count rates for Quadrant B Data is divided into 100 sec bins |
 |
 |
| Module-wise count rates for Quadrant C Data is divided into 100 sec bins |
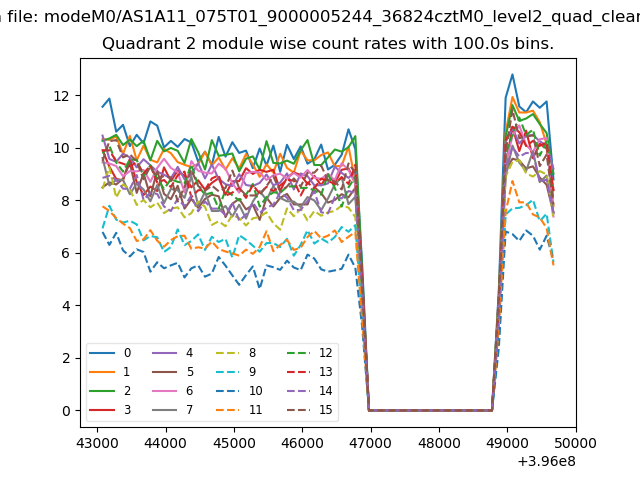 |
 |
| Module-wise count rates for Quadrant D Data is divided into 100 sec bins |
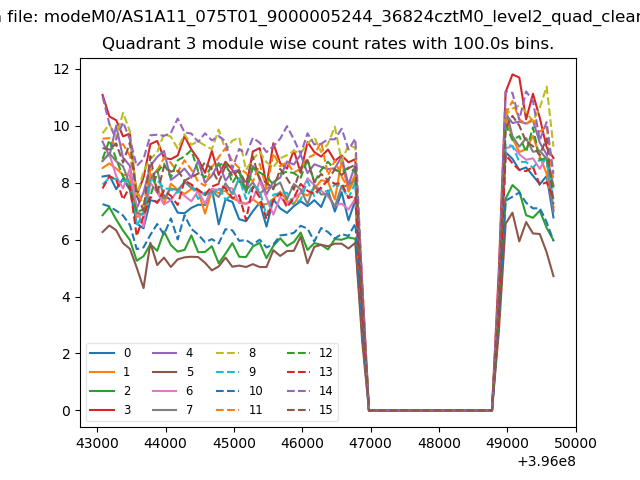 |
 |
| Parameter | Plot |
|---|---|
| CZT HV Monitor | 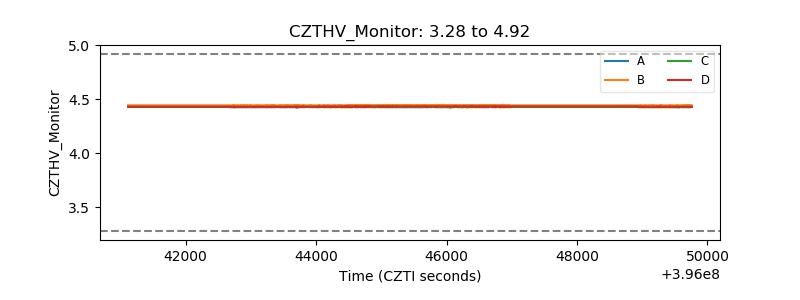 |
| D_VDD | 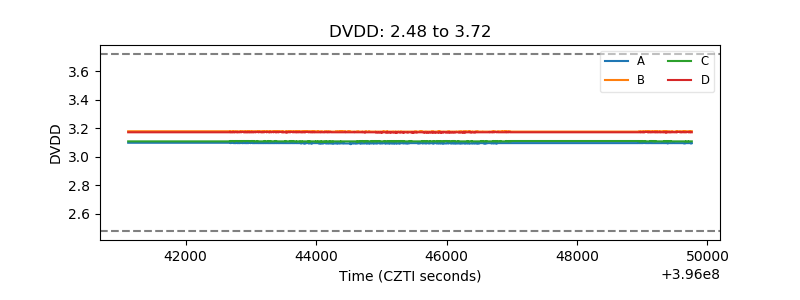 |
| Temperature 1 | 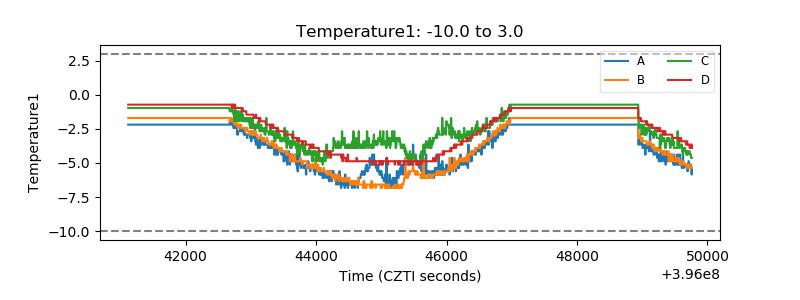 |
| Veto HV Monitor | 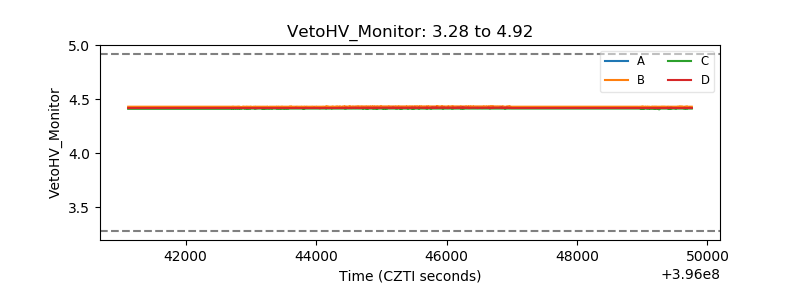 |
| Veto LLD |  |
| Alpha Counter | 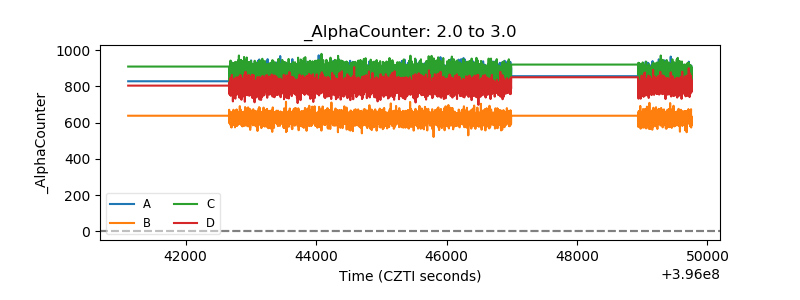 |
| _CPM_Rate | 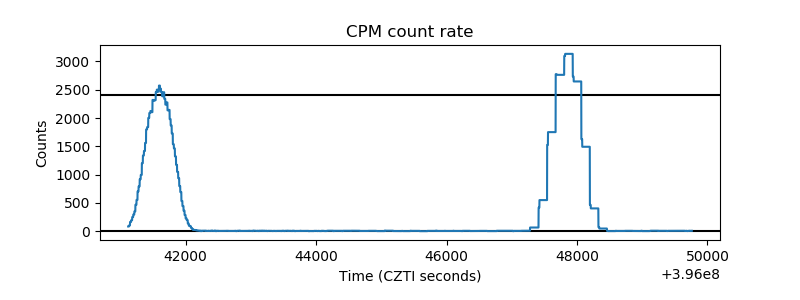 |
| CZT Counter | 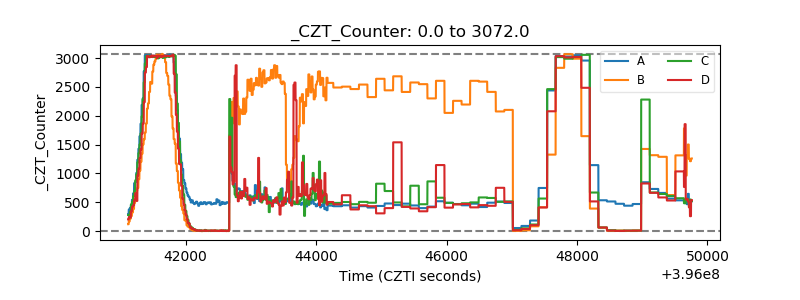 |
| +2.5 Volts monitor | 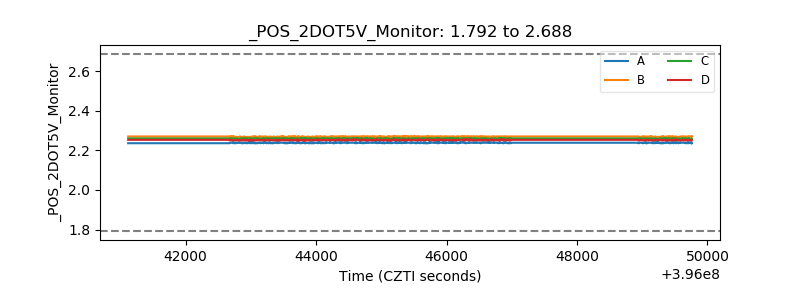 |
| +5 Volts monitor |  |
| _ROLL_ROT |  |
| _Roll_DEC | 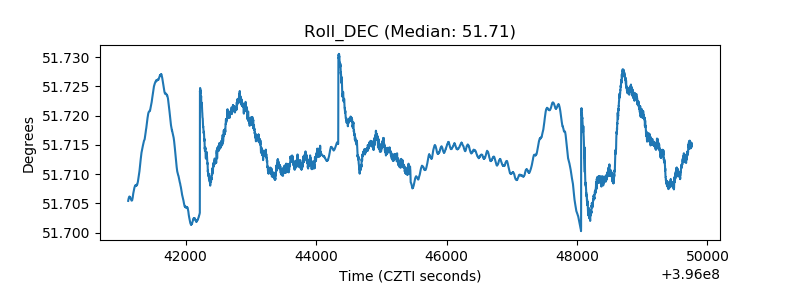 |
| _Roll_RA | 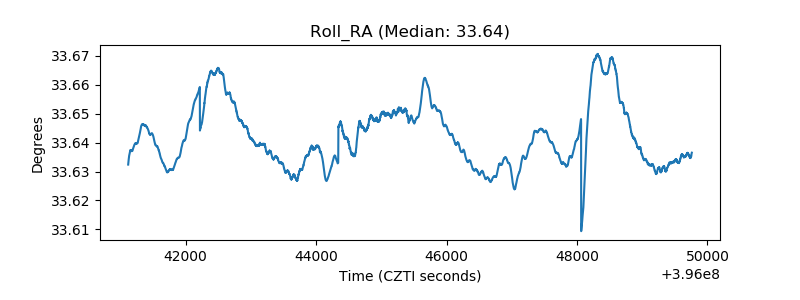 |
| Veto Counter | 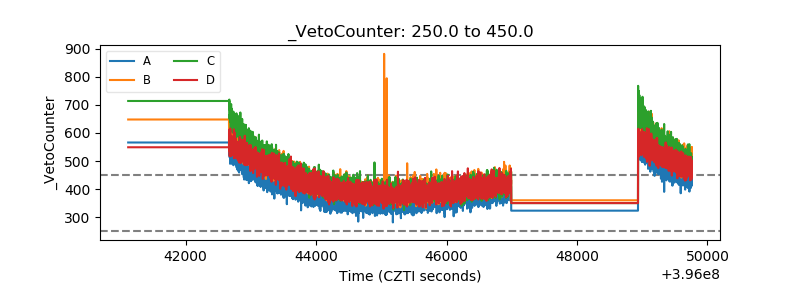 |