| Param | Original file | Final file |
|---|---|---|
| Filename | modeM0/AS1A11_075T01_9000005244_36825cztM0_level2.evt | modeM0/AS1A11_075T01_9000005244_36825cztM0_level2_quad_clean.evt |
| Size (bytes) | 623,658,240 | 92,341,440 |
| Size | 594.8 MB | 88.1 MB |
| Events in quadrant A | 2,592,983 | 643,287 |
| Events in quadrant B | 10,126,996 | 510,603 |
| Events in quadrant C | 2,954,430 | 659,195 |
| Events in quadrant D | 2,867,770 | 624,940 |
| Mode SS | |||
|---|---|---|---|
| Quadrant | BADHDUFLAG | Total packets | Discarded packets |
| A | 0 | 106 | 0 |
| B | 0 | 106 | 0 |
| C | 0 | 106 | 0 |
| D | 0 | 106 | 0 |
| Mode M0 | |||
|---|---|---|---|
| Quadrant | BADHDUFLAG | Total packets | Discarded packets |
| A | 0 | 10927 | 3 |
| B | 0 | 33596 | 2 |
| C | 0 | 11800 | 2 |
| D | 0 | 12041 | 2 |
| Mode M9 | |||
|---|---|---|---|
| Quadrant | BADHDUFLAG | Total packets | Discarded packets |
| A | 0 | 40 | 0 |
| B | 0 | 40 | 0 |
| C | 0 | 40 | 0 |
| D | 0 | 40 | 0 |
| Quadrant | Total seconds | Saturated seconds | Saturation percentage |
|---|---|---|---|
| A | 5096 | 12 | 0.235479% |
| B | 5096 | 3292 | 64.599686% |
| C | 5096 | 95 | 1.864207% |
| D | 5096 | 56 | 1.098901% |
Noise dominated data is calculated using 1-second bins in cleaned event files. If a bin has >2000 counts, and if more than 50% of those come from <1% of pixels, then it is considered to be noise-dominated and hence unusable.
| Quadrant | # 1 sec bins | Bins with >0 counts | Bins with >2000 counts | High rate bins dominated by noise | Noise dominated (total time) | Noise dominated (detector-on time) | Marked lightcurve |
|---|---|---|---|---|---|---|---|
| A | 9103 | 5098 | 5 | 5 | 0.05% | 0.10% | 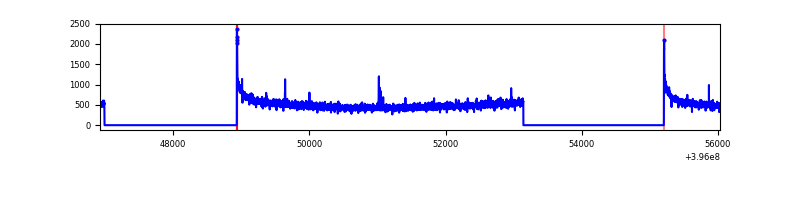 |
| B | 9102 | 5095 | 3097 | 3097 | 34.03% | 60.79% | 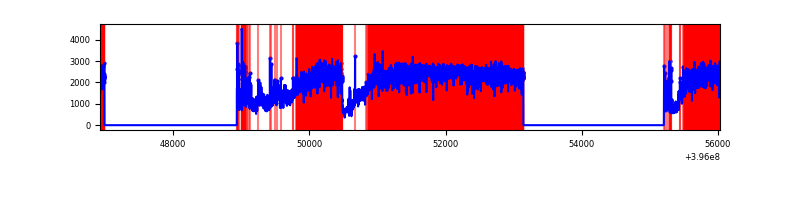 |
| C | 9103 | 5098 | 72 | 72 | 0.79% | 1.41% | 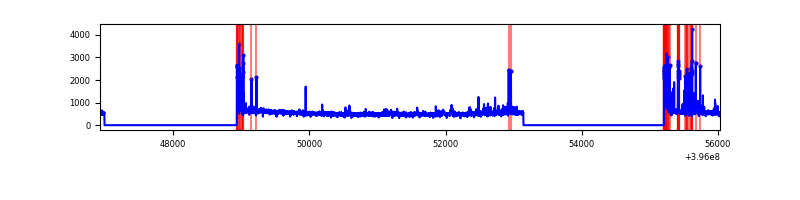 |
| D | 9103 | 5098 | 42 | 42 | 0.46% | 0.82% | 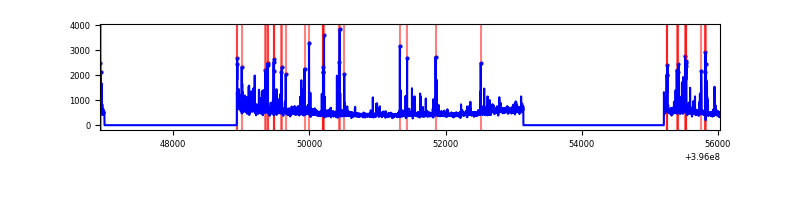 |
Top three noisy pixels from each quadrant. If the there are fewer than three noisy pixels in the level2.evt file, extra rows are filled as -1
| Pixel properties | Quadrant properties | ||||||
|---|---|---|---|---|---|---|---|
| Quadrant | DetID | PixID | Counts | Sigma | Mean | Median | Sigma |
| A | 10 | 83 | 221013 | 1803.06 | 604 | 592 | 122.2 |
| A | 13 | 6 | 17805 | 140.8 | 604 | 592 | 122.2 |
| A | 9 | 143 | 8589 | 65.42 | 604 | 592 | 122.2 |
| B | 12 | 1 | 7313609 | 78546.94 | 497 | 485 | 93.1 |
| B | 0 | 221 | 186467 | 1997.55 | 497 | 485 | 93.1 |
| B | 0 | 190 | 150720 | 1613.61 | 497 | 485 | 93.1 |
| C | 0 | 207 | 217256 | 1569.3 | 598 | 604 | 138.1 |
| C | 15 | 214 | 214557 | 1549.75 | 598 | 604 | 138.1 |
| C | 0 | 10 | 137870 | 994.28 | 598 | 604 | 138.1 |
| D | 13 | 249 | 145140 | 1000.62 | 594 | 579 | 144.5 |
| D | 2 | 250 | 103001 | 708.94 | 594 | 579 | 144.5 |
| D | 12 | 233 | 100274 | 690.07 | 594 | 579 | 144.5 |
Histogram calculated using DETX and DETY for each event in the final _common_clean file
| Quadrant A | 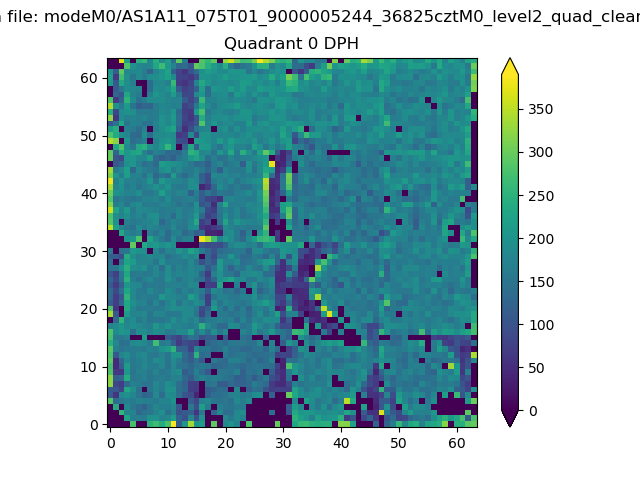 |
 |
Quadrant B |
|---|---|---|---|
| Quadrant D |  |
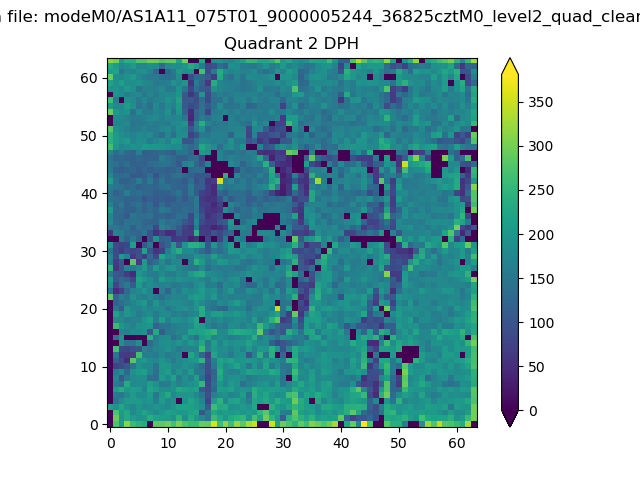 |
Quadrant C |
| Plot type | Count rate plots | Images |
|---|---|---|
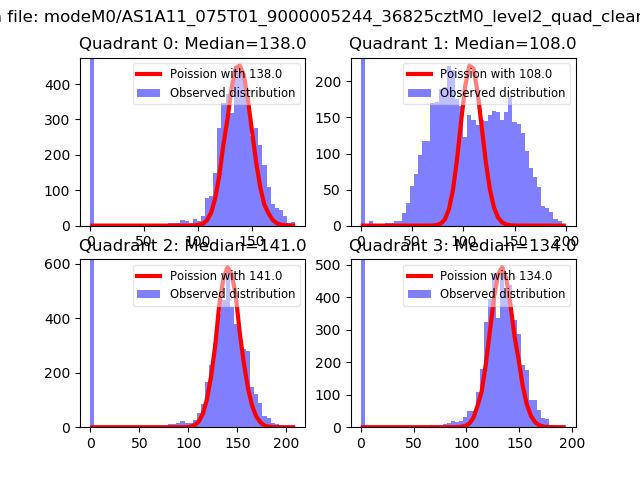
| Comparison with Poisson distribution Blue bars denote a histogram of data divided into 1 sec bins. Red curve is a Poisson curve with rate = median count rate of data. |
 |
 |
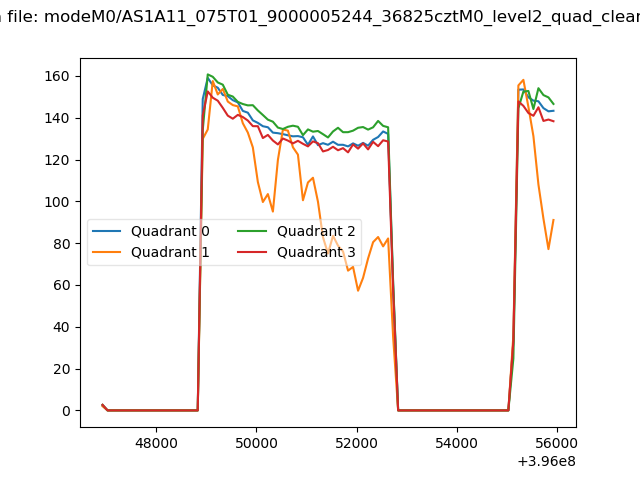
| Quadrant-wise count rates Data is divided into 100 sec bins |
 |
|
| Module-wise count rates for Quadrant A Data is divided into 100 sec bins |
 |
 |
| Module-wise count rates for Quadrant B Data is divided into 100 sec bins |
 |
 |
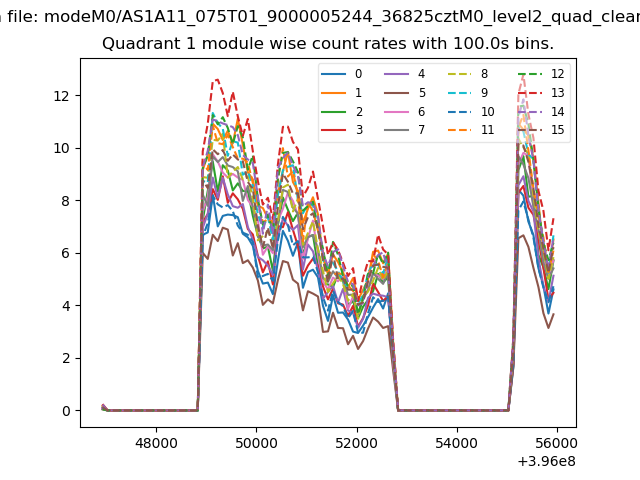
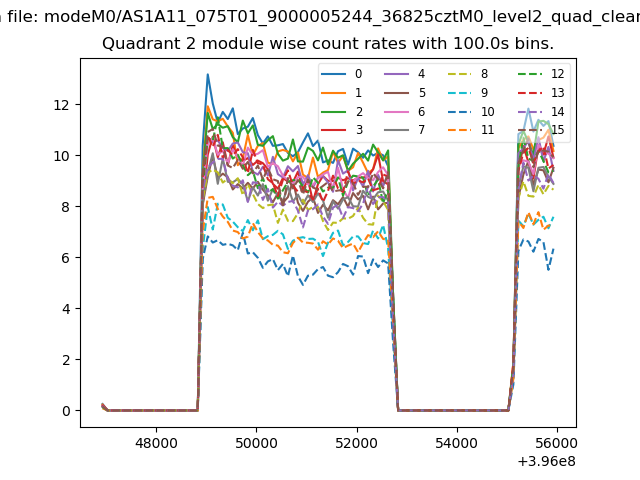
| Module-wise count rates for Quadrant C Data is divided into 100 sec bins |
 |
 |
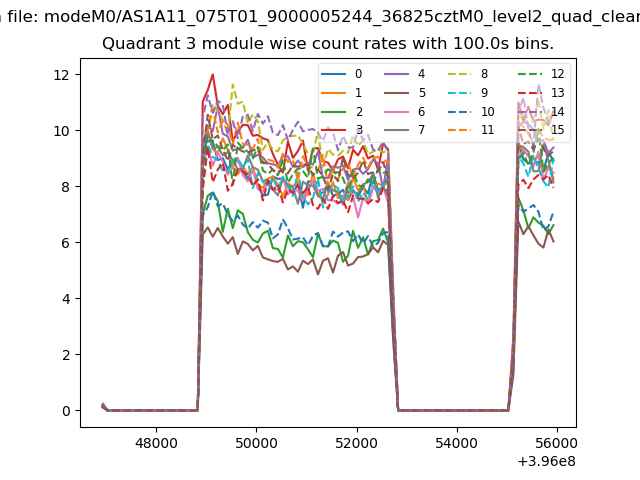
| Module-wise count rates for Quadrant D Data is divided into 100 sec bins |
 |
 |
| Parameter | Plot |
|---|---|
| CZT HV Monitor | 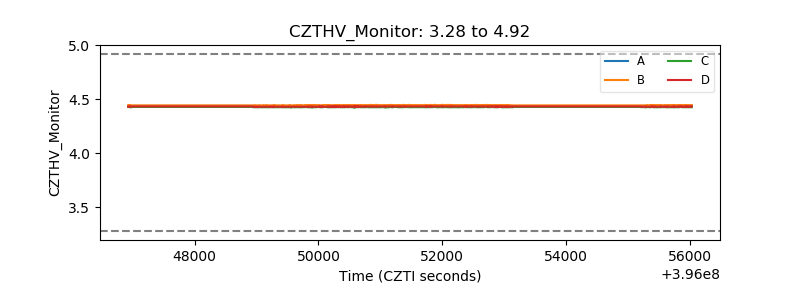 |
| D_VDD | 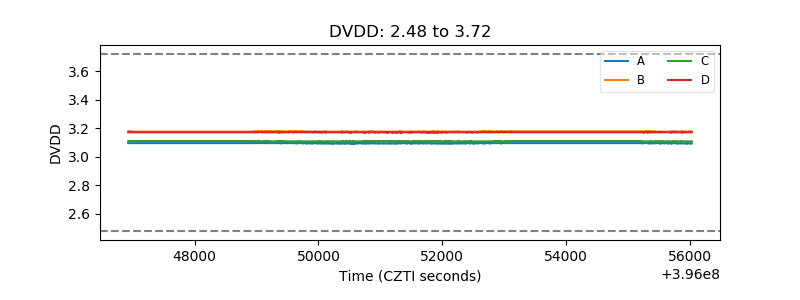 |
| Temperature 1 | 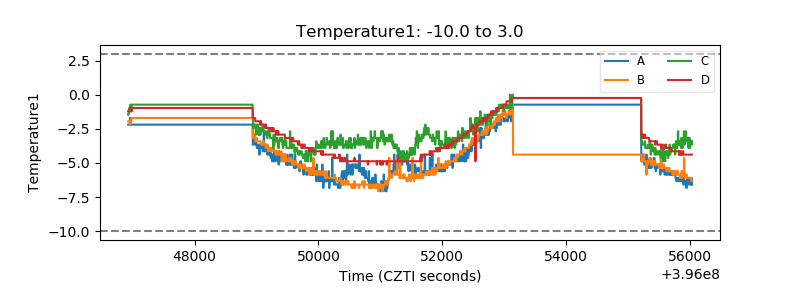 |
| Veto HV Monitor | 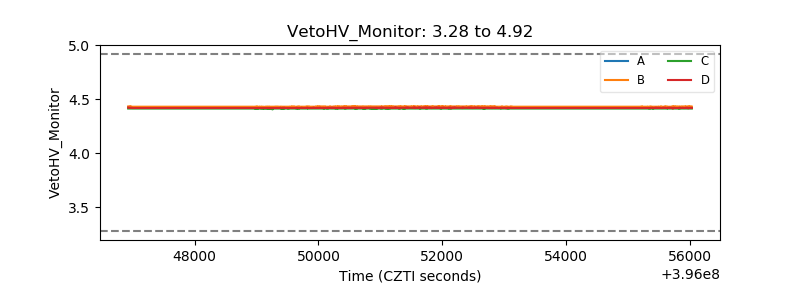 |
| Veto LLD | 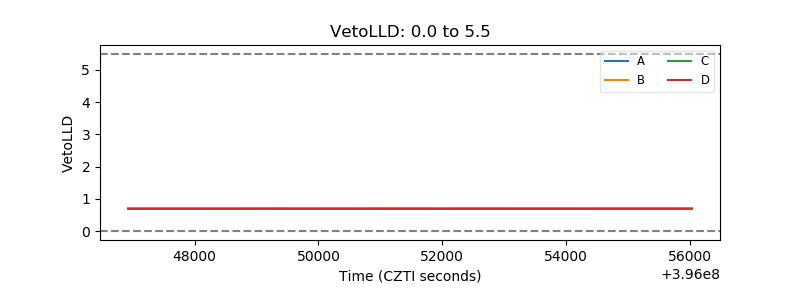 |
| Alpha Counter | 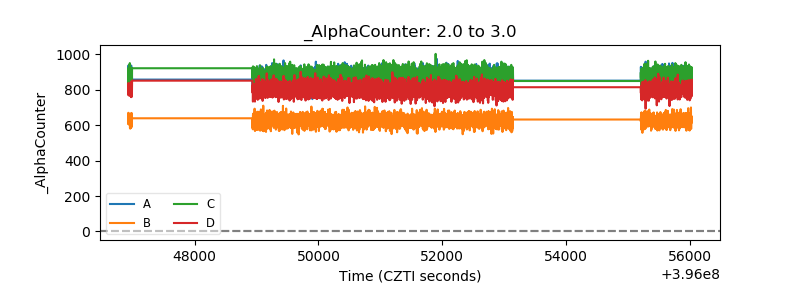 |
| _CPM_Rate | 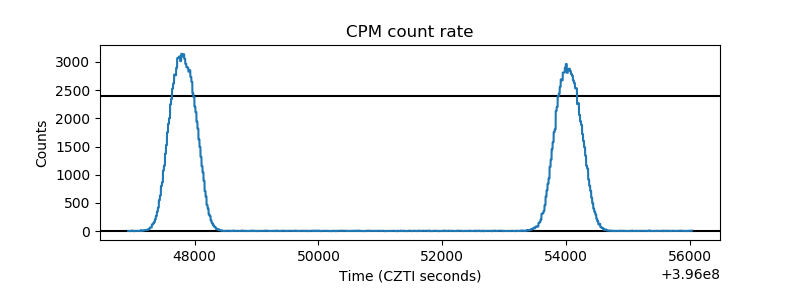 |
| CZT Counter | 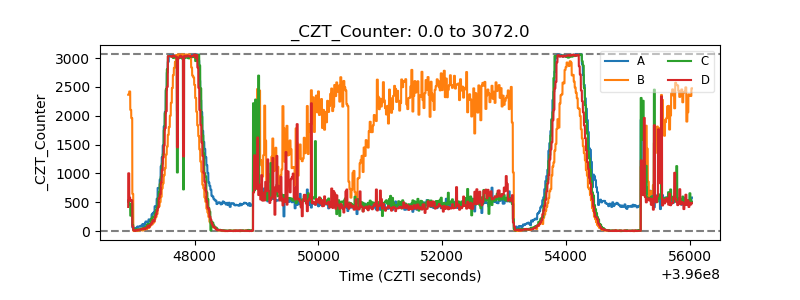 |
| +2.5 Volts monitor |  |
| +5 Volts monitor | 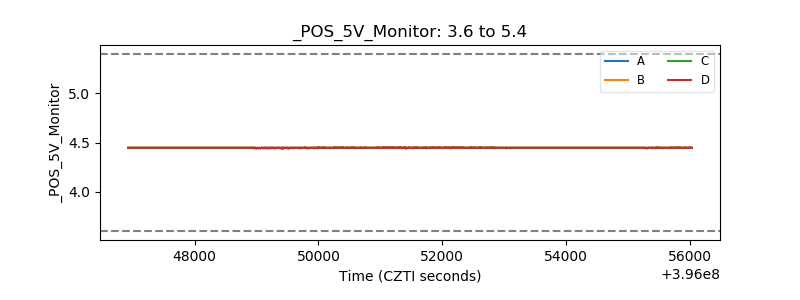 |
| _ROLL_ROT | 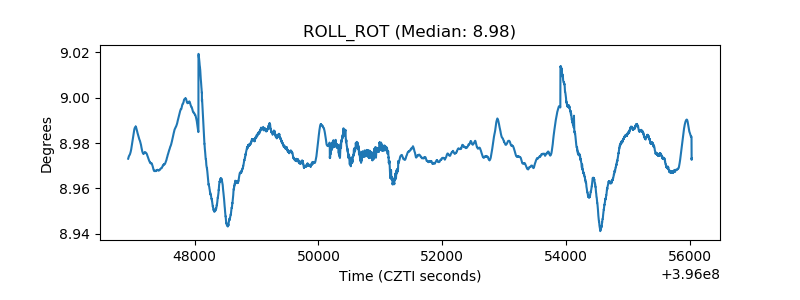 |
| _Roll_DEC | 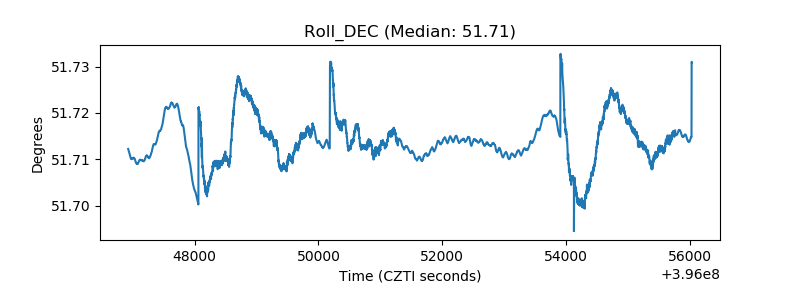 |
| _Roll_RA | 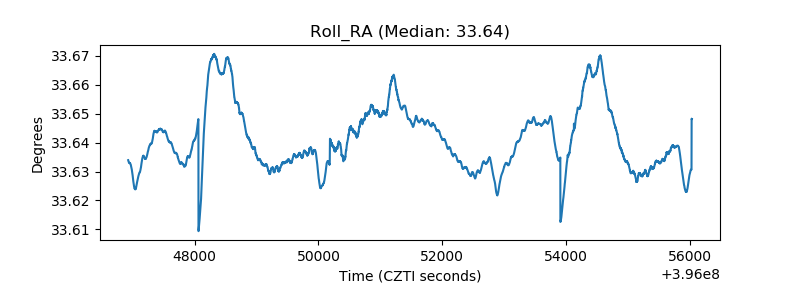 |
| Veto Counter | 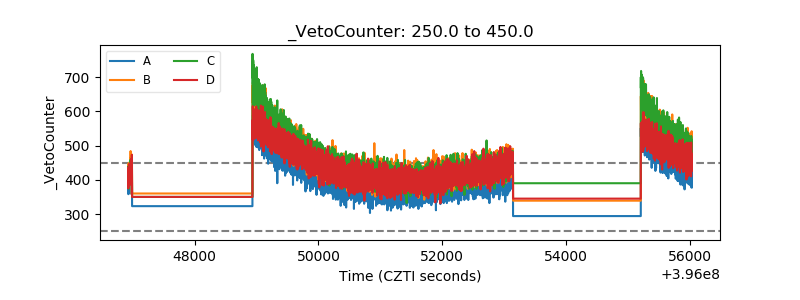 |