| Param | Original file | Final file |
|---|---|---|
| Filename | modeM0/AS1A11_075T01_9000005244_36827cztM0_level2.evt | modeM0/AS1A11_075T01_9000005244_36827cztM0_level2_quad_clean.evt |
| Size (bytes) | 589,783,680 | 73,995,840 |
| Size | 562.5 MB | 70.6 MB |
| Events in quadrant A | 2,483,918 | 486,372 |
| Events in quadrant B | 8,965,020 | 441,063 |
| Events in quadrant C | 2,917,233 | 495,212 |
| Events in quadrant D | 3,160,620 | 470,414 |
| Mode SS | |||
|---|---|---|---|
| Quadrant | BADHDUFLAG | Total packets | Discarded packets |
| A | 0 | 102 | 0 |
| B | 0 | 102 | 0 |
| C | 0 | 102 | 0 |
| D | 0 | 102 | 0 |
| Mode M0 | |||
|---|---|---|---|
| Quadrant | BADHDUFLAG | Total packets | Discarded packets |
| A | 0 | 10544 | 3 |
| B | 0 | 30043 | 2 |
| C | 0 | 11721 | 2 |
| D | 0 | 12965 | 2 |
| Mode M9 | |||
|---|---|---|---|
| Quadrant | BADHDUFLAG | Total packets | Discarded packets |
| A | 0 | 30 | 0 |
| B | 0 | 30 | 0 |
| C | 0 | 30 | 0 |
| D | 0 | 31 | 0 |
| Quadrant | Total seconds | Saturated seconds | Saturation percentage |
|---|---|---|---|
| A | 4943 | 11 | 0.222537% |
| B | 4943 | 2224 | 44.992919% |
| C | 4943 | 127 | 2.569290% |
| D | 4943 | 130 | 2.629982% |
Noise dominated data is calculated using 1-second bins in cleaned event files. If a bin has >2000 counts, and if more than 50% of those come from <1% of pixels, then it is considered to be noise-dominated and hence unusable.
| Quadrant | # 1 sec bins | Bins with >0 counts | Bins with >2000 counts | High rate bins dominated by noise | Noise dominated (total time) | Noise dominated (detector-on time) | Marked lightcurve |
|---|---|---|---|---|---|---|---|
| A | 7067 | 4944 | 5 | 5 | 0.07% | 0.10% | 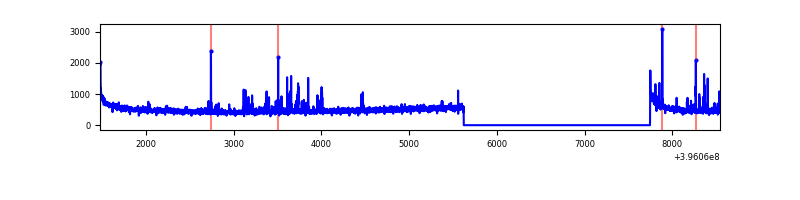 |
| B | 7067 | 4943 | 2256 | 2256 | 31.92% | 45.64% | 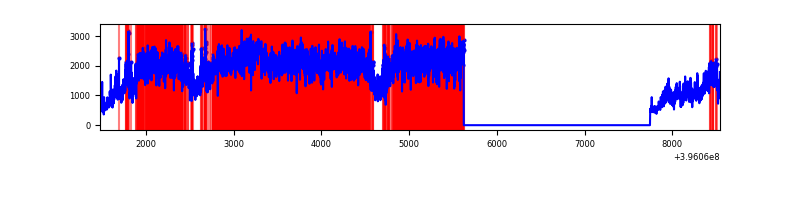 |
| C | 7067 | 4944 | 113 | 113 | 1.60% | 2.29% | 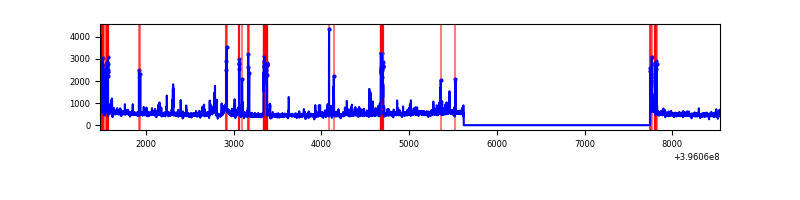 |
| D | 7067 | 4944 | 147 | 147 | 2.08% | 2.97% | 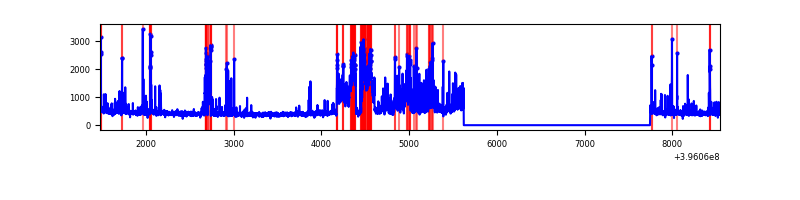 |
Top three noisy pixels from each quadrant. If the there are fewer than three noisy pixels in the level2.evt file, extra rows are filled as -1
| Pixel properties | Quadrant properties | ||||||
|---|---|---|---|---|---|---|---|
| Quadrant | DetID | PixID | Counts | Sigma | Mean | Median | Sigma |
| A | 10 | 83 | 204403 | 1803.43 | 559 | 550 | 113.0 |
| A | 9 | 143 | 92210 | 810.89 | 559 | 550 | 113.0 |
| A | 13 | 6 | 9558 | 79.69 | 559 | 550 | 113.0 |
| B | 12 | 1 | 6232335 | 65160.65 | 510 | 498 | 95.6 |
| B | 5 | 200 | 318781 | 3327.99 | 510 | 498 | 95.6 |
| B | 5 | 255 | 104792 | 1090.5 | 510 | 498 | 95.6 |
| C | 0 | 207 | 234543 | 1849.38 | 545 | 549 | 126.5 |
| C | 15 | 214 | 210585 | 1660.03 | 545 | 549 | 126.5 |
| C | 14 | 254 | 164860 | 1298.64 | 545 | 549 | 126.5 |
| D | 12 | 227 | 615888 | 4682.88 | 539 | 525 | 131.4 |
| D | 13 | 249 | 188365 | 1429.45 | 539 | 525 | 131.4 |
| D | 12 | 233 | 98888 | 748.54 | 539 | 525 | 131.4 |
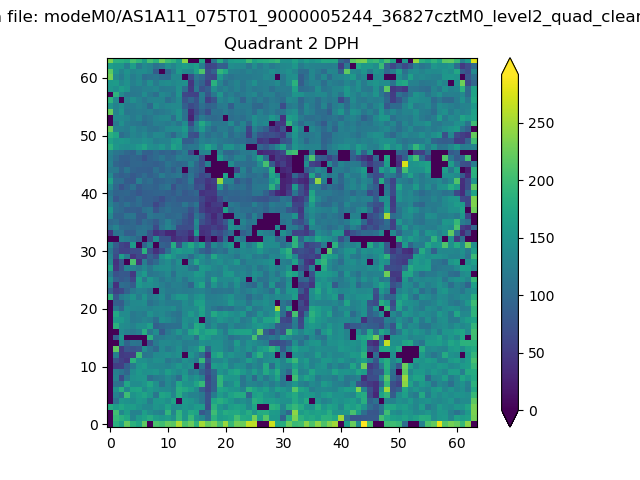
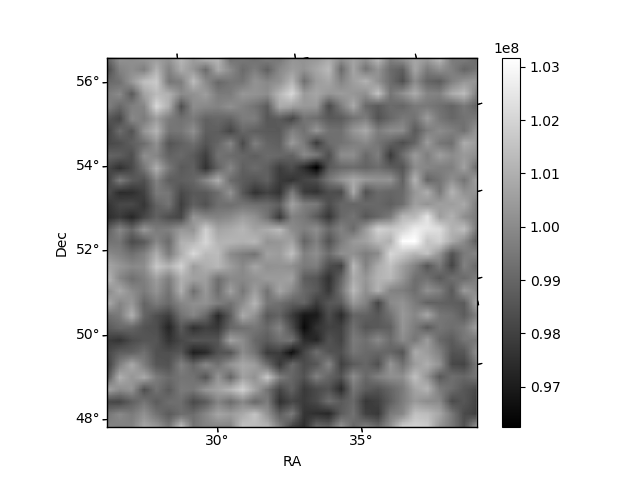
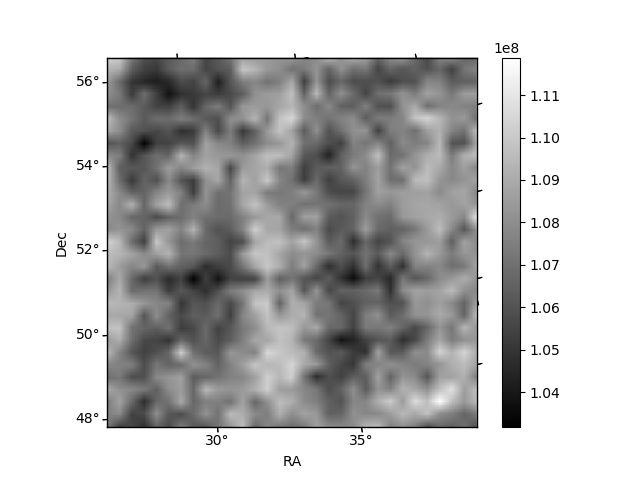
Histogram calculated using DETX and DETY for each event in the final _common_clean file
| Quadrant A | 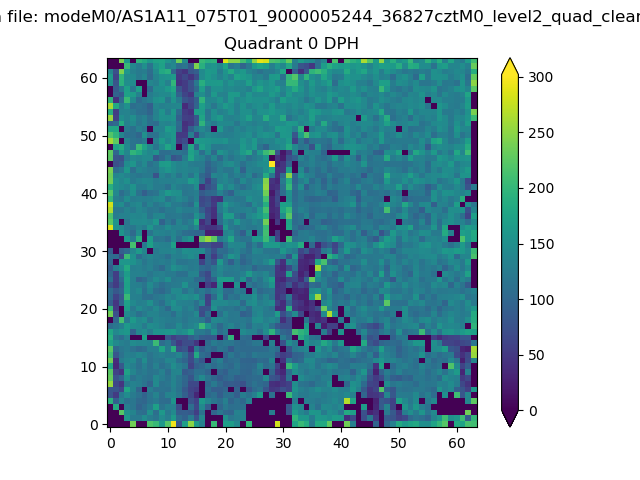 |
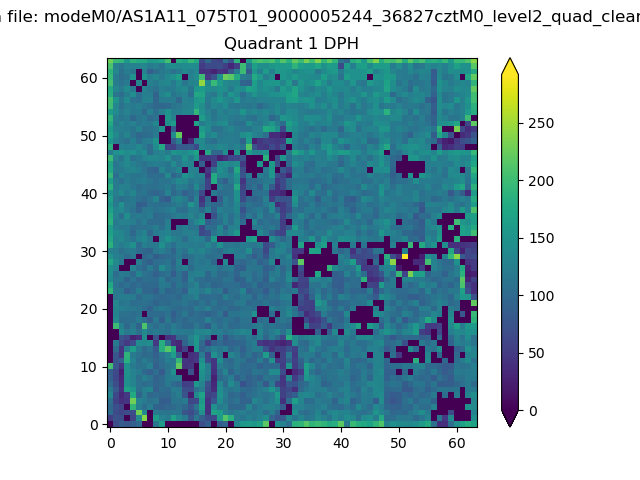 |
Quadrant B |
|---|---|---|---|
| Quadrant D | 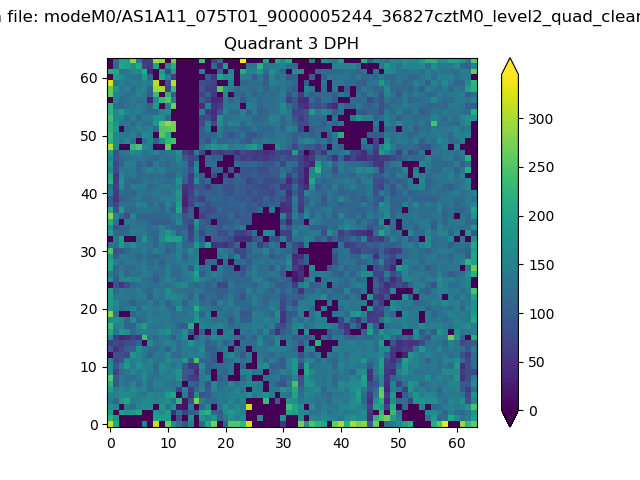 |
 |
Quadrant C |
| Plot type | Count rate plots | Images |
|---|---|---|
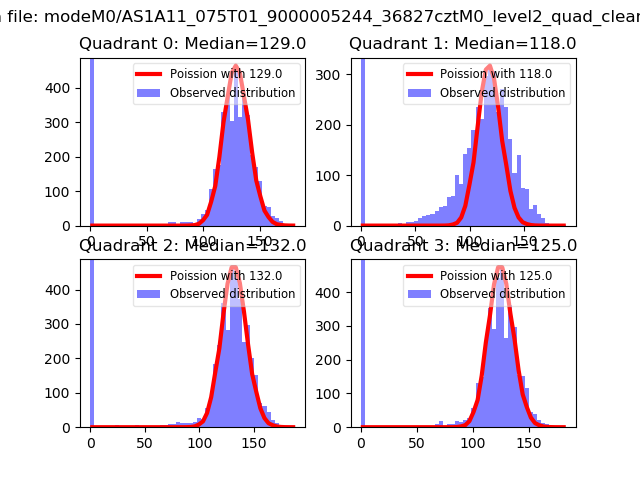
| Comparison with Poisson distribution Blue bars denote a histogram of data divided into 1 sec bins. Red curve is a Poisson curve with rate = median count rate of data. |
 |
 |
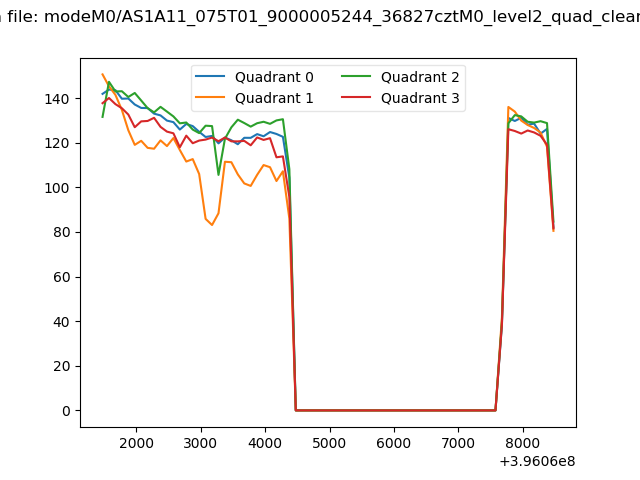
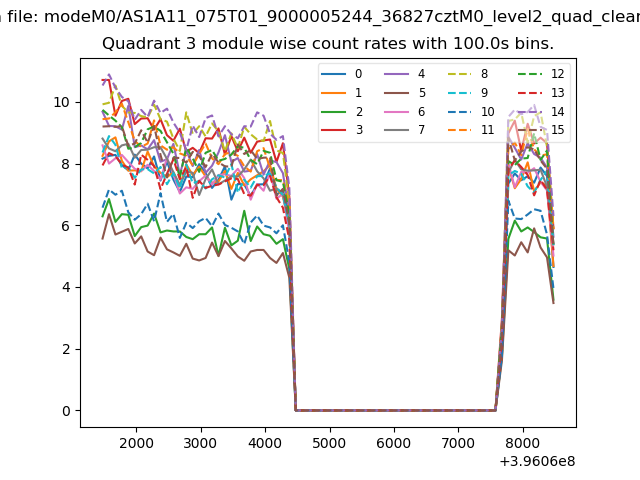
| Quadrant-wise count rates Data is divided into 100 sec bins |
 |
|
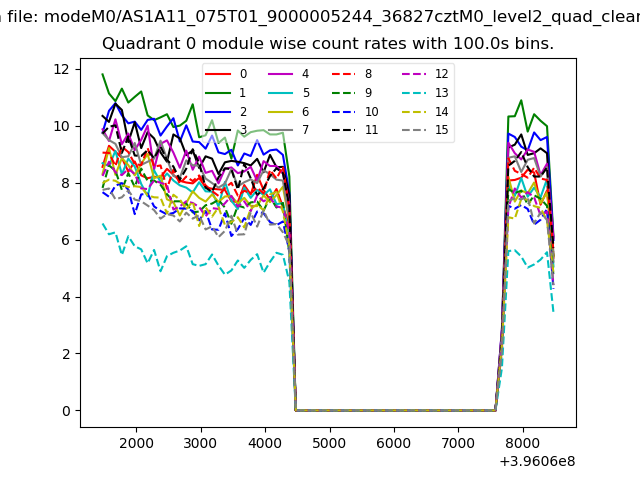
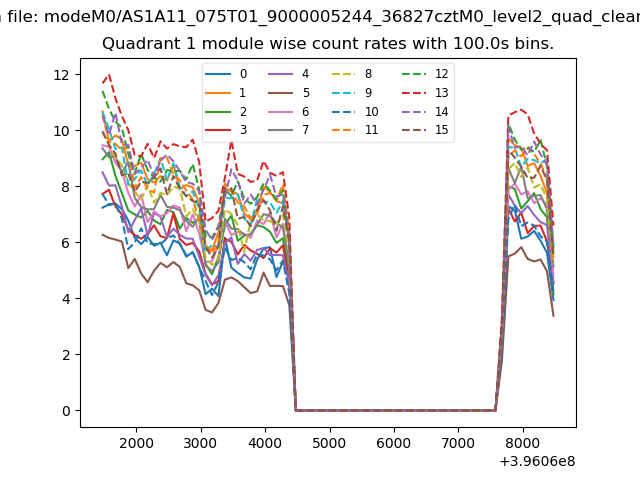
| Module-wise count rates for Quadrant A Data is divided into 100 sec bins |
 |
 |
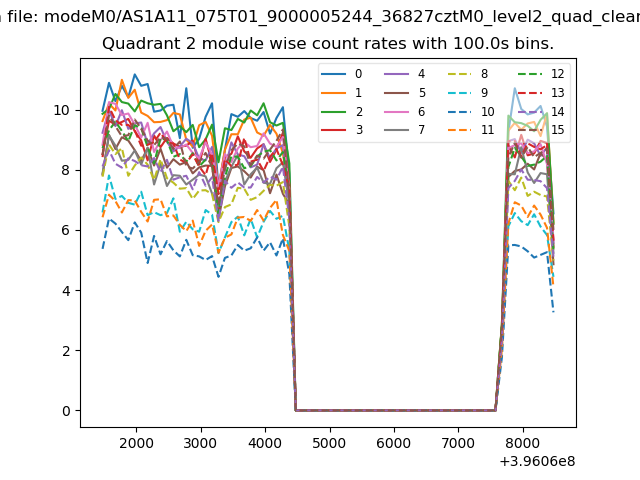
| Module-wise count rates for Quadrant B Data is divided into 100 sec bins |
 |
 |
| Module-wise count rates for Quadrant C Data is divided into 100 sec bins |
 |
 |
| Module-wise count rates for Quadrant D Data is divided into 100 sec bins |
 |
 |
| Parameter | Plot |
|---|---|
| CZT HV Monitor | 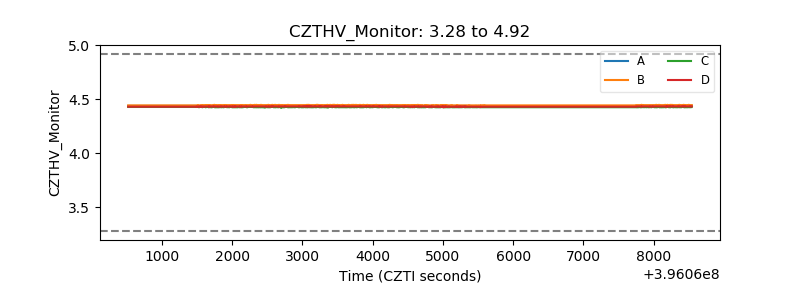 |
| D_VDD | 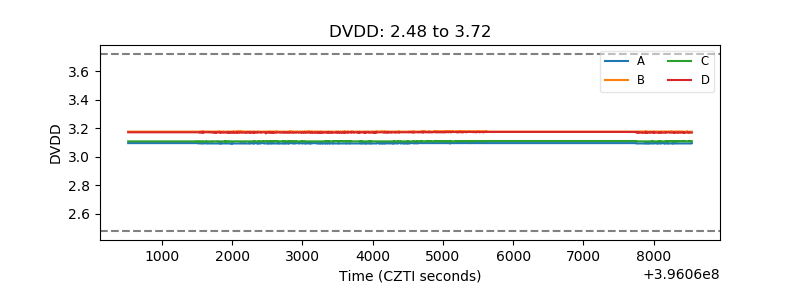 |
| Temperature 1 | 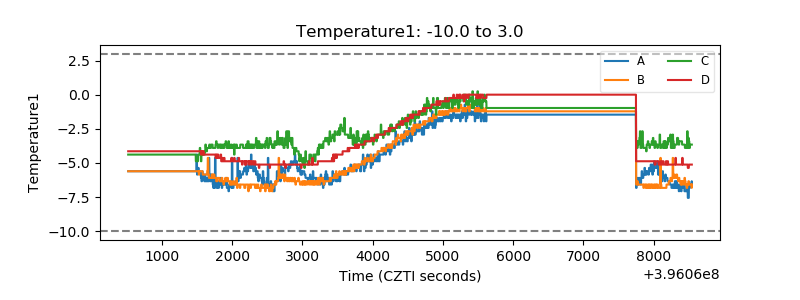 |
| Veto HV Monitor | 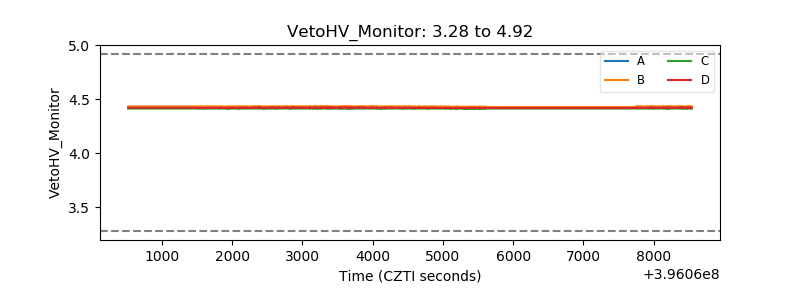 |
| Veto LLD | 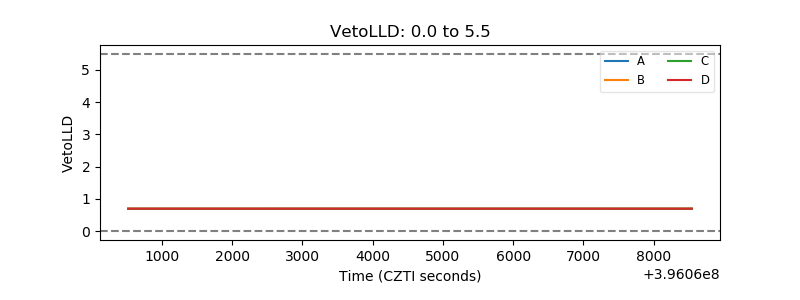 |
| Alpha Counter | 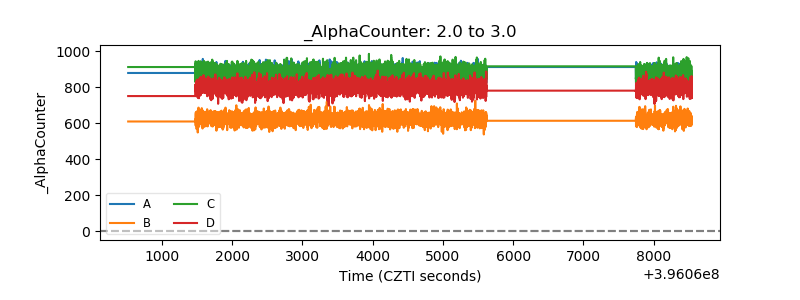 |
| _CPM_Rate | 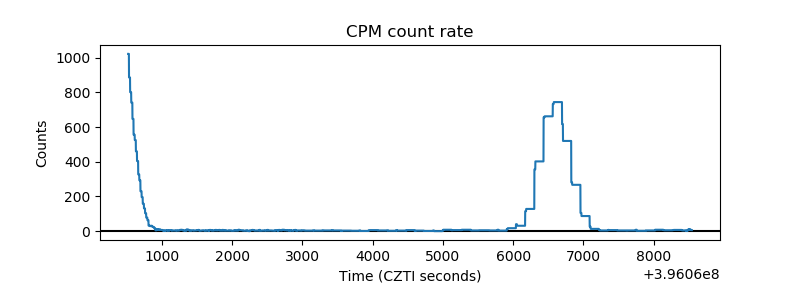 |
| CZT Counter | 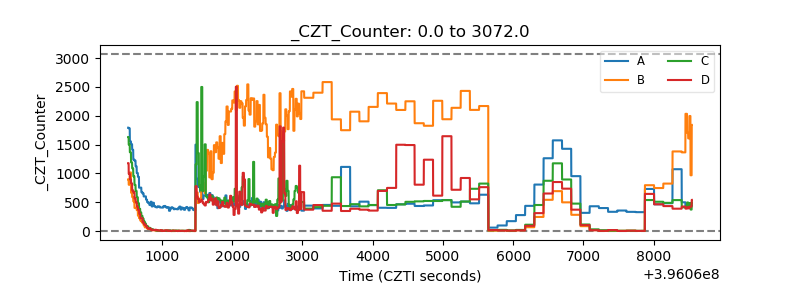 |
| +2.5 Volts monitor |  |
| +5 Volts monitor |  |
| _ROLL_ROT | 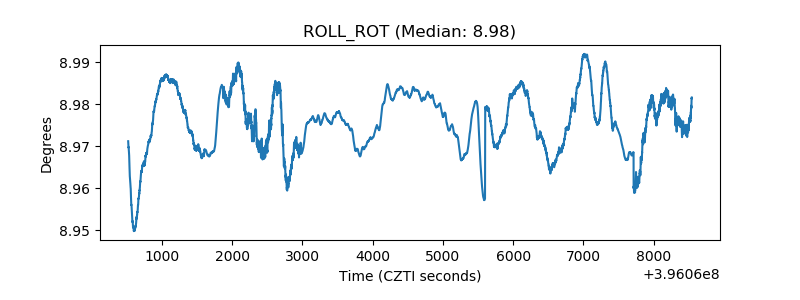 |
| _Roll_DEC | 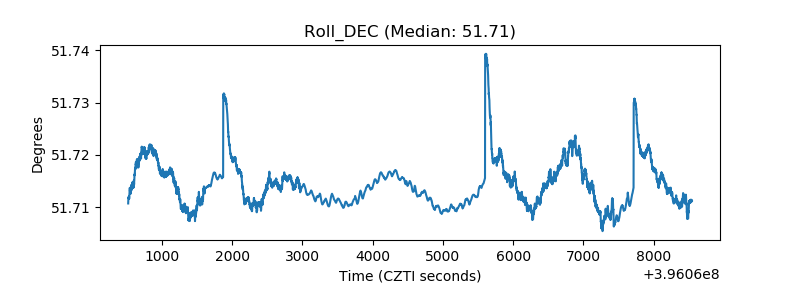 |
| _Roll_RA | 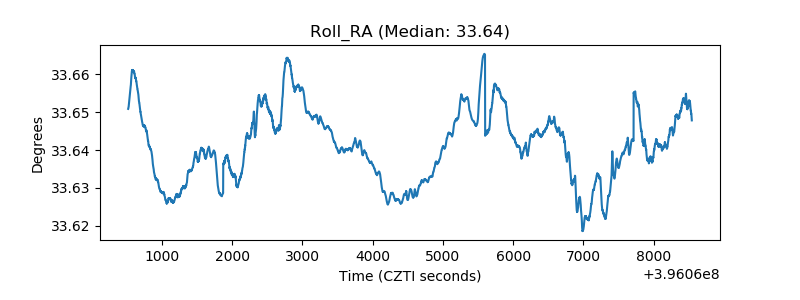 |
| Veto Counter | 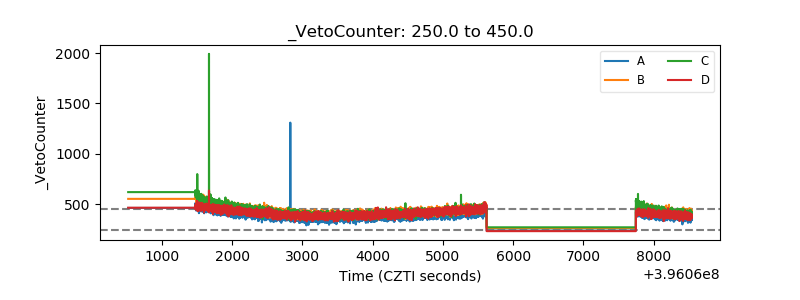 |