| Param | Original file | Final file |
|---|---|---|
| Filename | modeM0/AS1A11_075T01_9000005244_36834cztM0_level2.evt | modeM0/AS1A11_075T01_9000005244_36834cztM0_level2_quad_clean.evt |
| Size (bytes) | 1,983,510,720 | 153,613,440 |
| Size | 1.8 GB | 146.5 MB |
| Events in quadrant A | 7,623,391 | 1,040,980 |
| Events in quadrant B | 35,604,872 | 486,619 |
| Events in quadrant C | 7,828,058 | 1,047,320 |
| Events in quadrant D | 7,974,043 | 1,007,889 |
| Mode SS | |||
|---|---|---|---|
| Quadrant | BADHDUFLAG | Total packets | Discarded packets |
| A | 0 | 314 | 0 |
| B | 0 | 314 | 0 |
| C | 0 | 314 | 0 |
| D | 0 | 314 | 0 |
| Mode M0 | |||
|---|---|---|---|
| Quadrant | BADHDUFLAG | Total packets | Discarded packets |
| A | 0 | 32313 | 5 |
| B | 0 | 116376 | 4 |
| C | 0 | 32447 | 4 |
| D | 0 | 34334 | 4 |
| Mode M9 | |||
|---|---|---|---|
| Quadrant | BADHDUFLAG | Total packets | Discarded packets |
| A | 0 | 48 | 0 |
| B | 0 | 48 | 0 |
| C | 0 | 48 | 0 |
| D | 0 | 49 | 0 |
| Quadrant | Total seconds | Saturated seconds | Saturation percentage |
|---|---|---|---|
| A | 15449 | 24 | 0.155350% |
| B | 15449 | 12911 | 83.571752% |
| C | 15449 | 64 | 0.414266% |
| D | 15449 | 155 | 1.003301% |
Noise dominated data is calculated using 1-second bins in cleaned event files. If a bin has >2000 counts, and if more than 50% of those come from <1% of pixels, then it is considered to be noise-dominated and hence unusable.
| Quadrant | # 1 sec bins | Bins with >0 counts | Bins with >2000 counts | High rate bins dominated by noise | Noise dominated (total time) | Noise dominated (detector-on time) | Marked lightcurve |
|---|---|---|---|---|---|---|---|
| A | 19719 | 15452 | 6 | 6 | 0.03% | 0.04% | 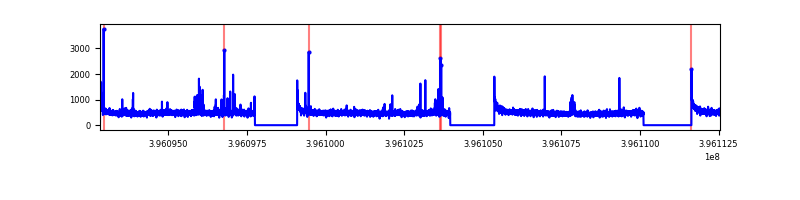 |
| B | 19718 | 15449 | 12393 | 12393 | 62.85% | 80.22% | 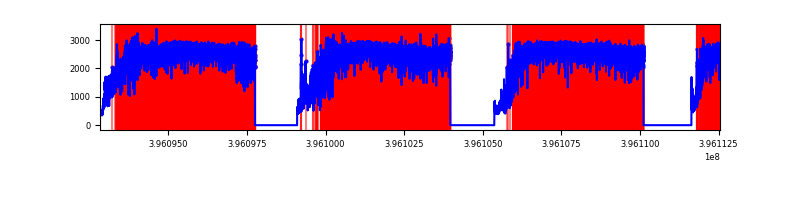 |
| C | 19719 | 15452 | 45 | 45 | 0.23% | 0.29% | 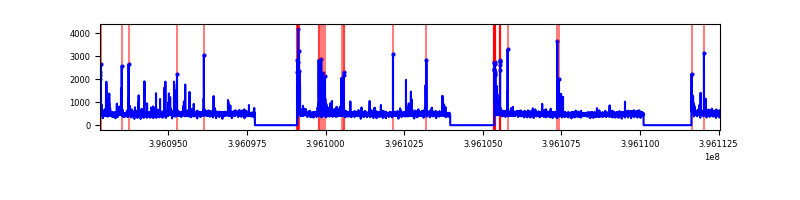 |
| D | 19719 | 15452 | 131 | 131 | 0.66% | 0.85% | 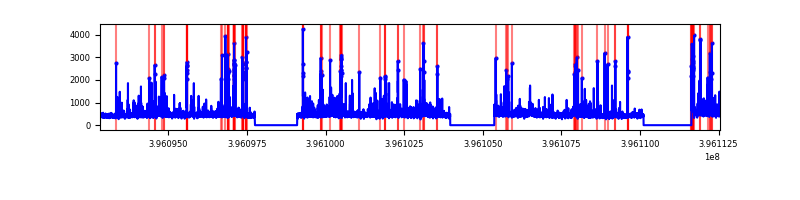 |
Top three noisy pixels from each quadrant. If the there are fewer than three noisy pixels in the level2.evt file, extra rows are filled as -1
| Pixel properties | Quadrant properties | ||||||
|---|---|---|---|---|---|---|---|
| Quadrant | DetID | PixID | Counts | Sigma | Mean | Median | Sigma |
| A | 10 | 83 | 584071 | 1642.8 | 1751 | 1714 | 354.5 |
| A | 7 | 3 | 122360 | 340.34 | 1751 | 1714 | 354.5 |
| A | 9 | 143 | 65639 | 180.33 | 1751 | 1714 | 354.5 |
| B | 12 | 1 | 30603484 | 167831.64 | 966 | 939 | 182.3 |
| B | 5 | 255 | 204431 | 1116.0 | 966 | 939 | 182.3 |
| B | 5 | 172 | 163466 | 891.34 | 966 | 939 | 182.3 |
| C | 15 | 214 | 660414 | 1675.48 | 1705 | 1715 | 393.1 |
| C | 14 | 254 | 180223 | 454.06 | 1705 | 1715 | 393.1 |
| C | 0 | 10 | 143961 | 361.82 | 1705 | 1715 | 393.1 |
| D | 13 | 249 | 292628 | 702.69 | 1705 | 1661 | 414.1 |
| D | 12 | 233 | 281689 | 676.27 | 1705 | 1661 | 414.1 |
| D | 2 | 153 | 171224 | 409.5 | 1705 | 1661 | 414.1 |
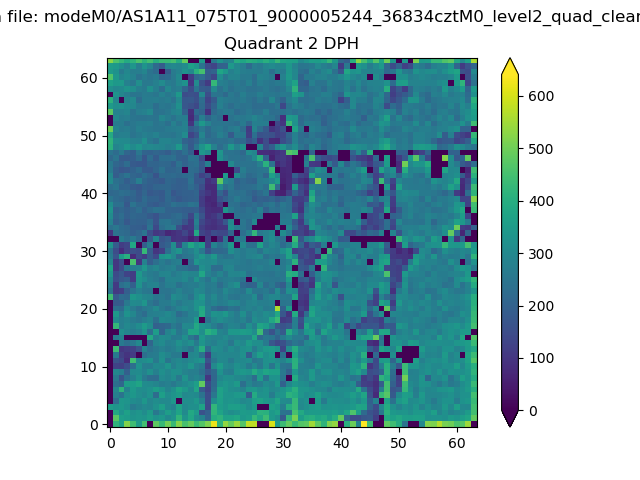
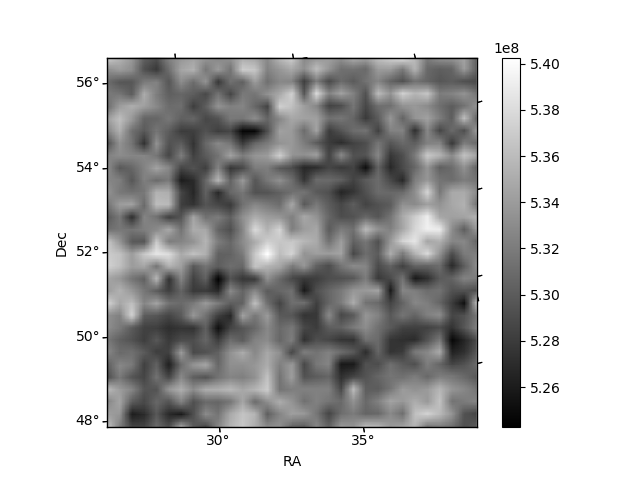
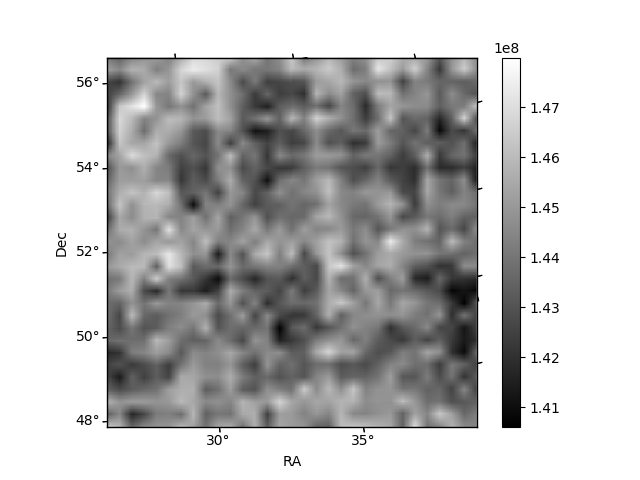
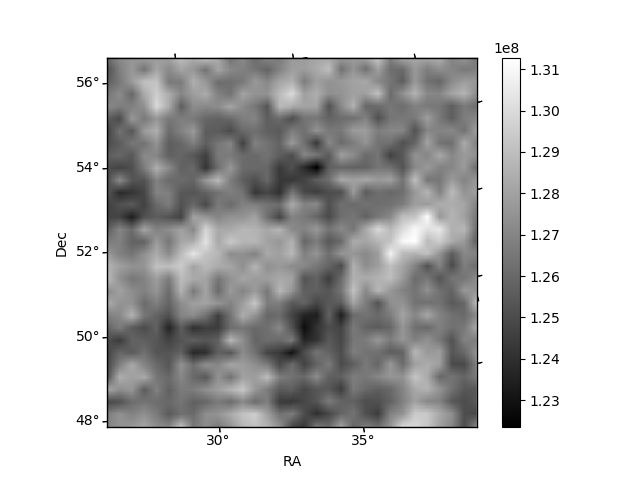
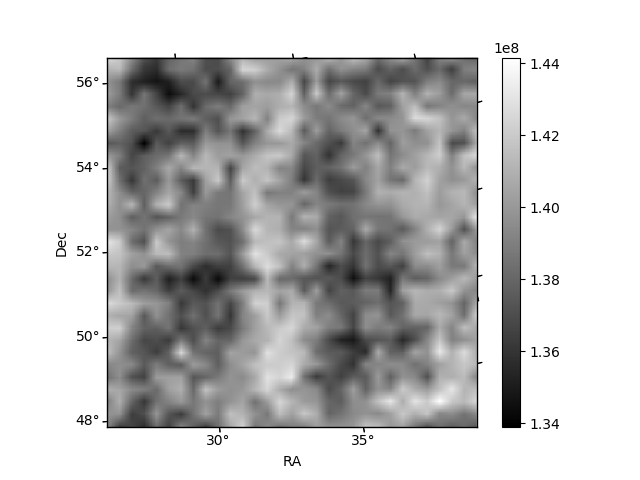
Histogram calculated using DETX and DETY for each event in the final _common_clean file
| Quadrant A | 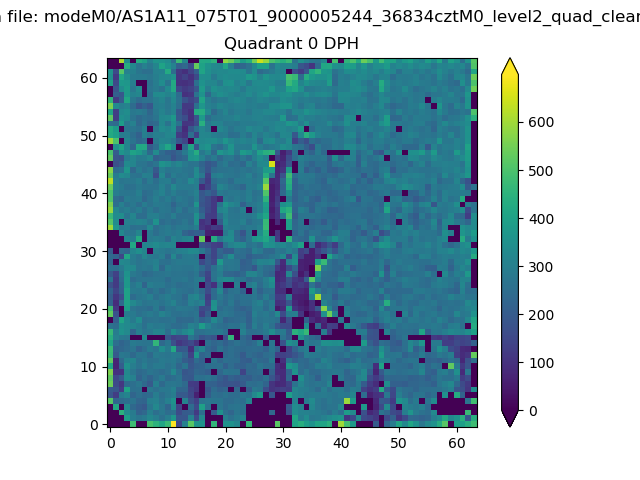 |
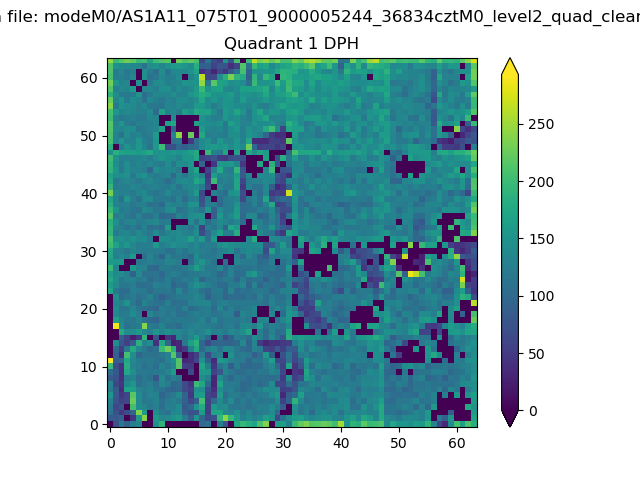 |
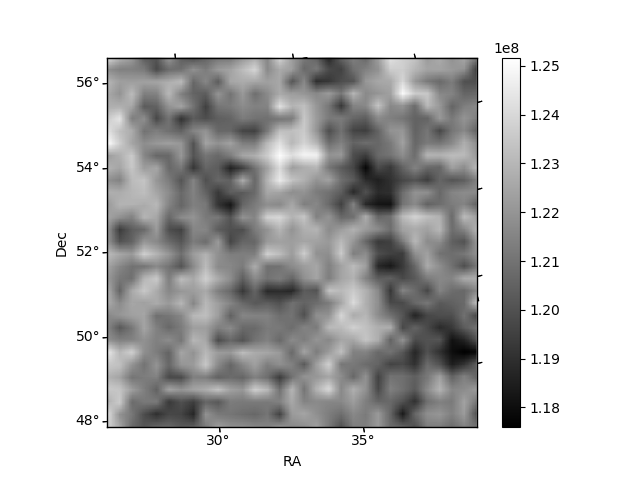
Quadrant B |
|---|---|---|---|
| Quadrant D | 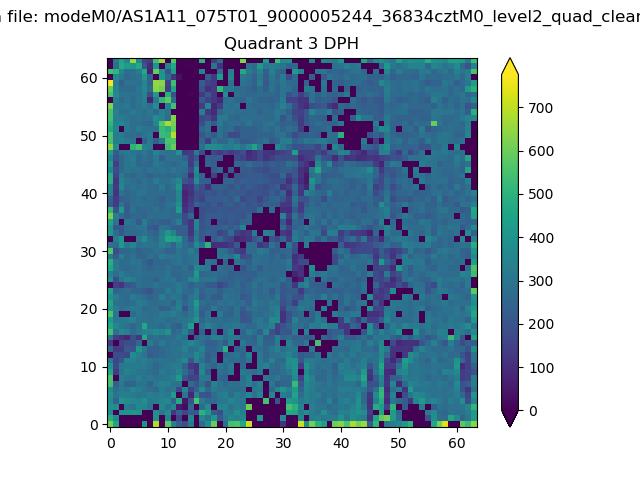 |
 |
Quadrant C |
| Plot type | Count rate plots | Images |
|---|---|---|
| Comparison with Poisson distribution Blue bars denote a histogram of data divided into 1 sec bins. Red curve is a Poisson curve with rate = median count rate of data. |
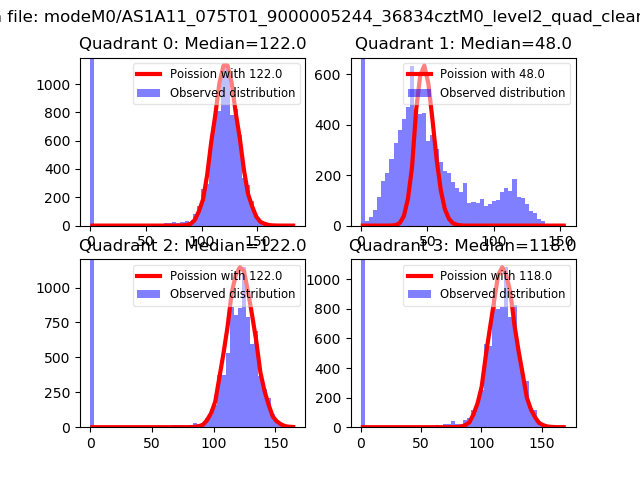 |
 |
| Quadrant-wise count rates Data is divided into 100 sec bins |
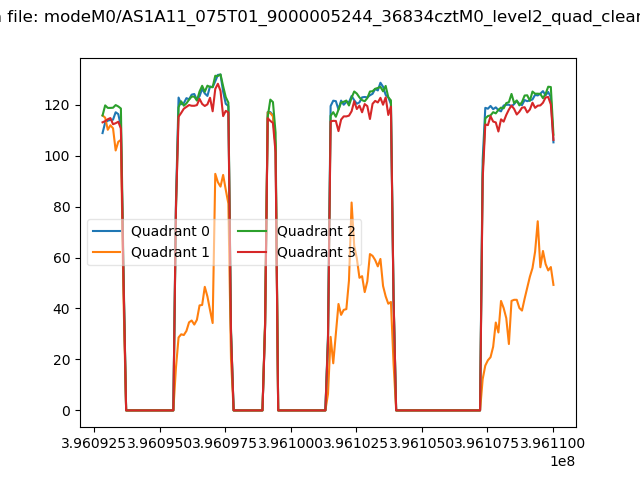 |
|
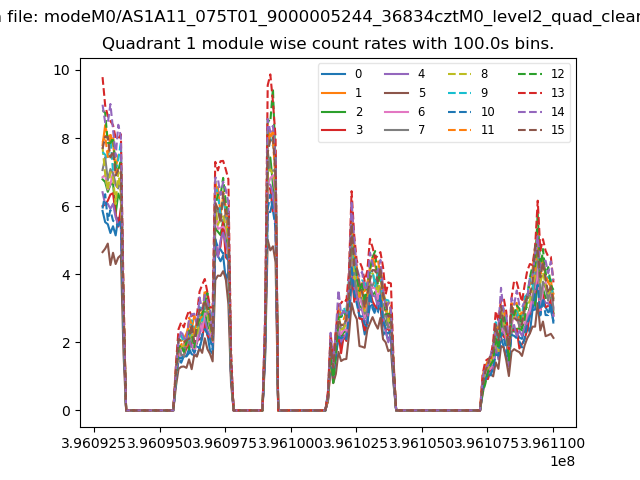
| Module-wise count rates for Quadrant A Data is divided into 100 sec bins |
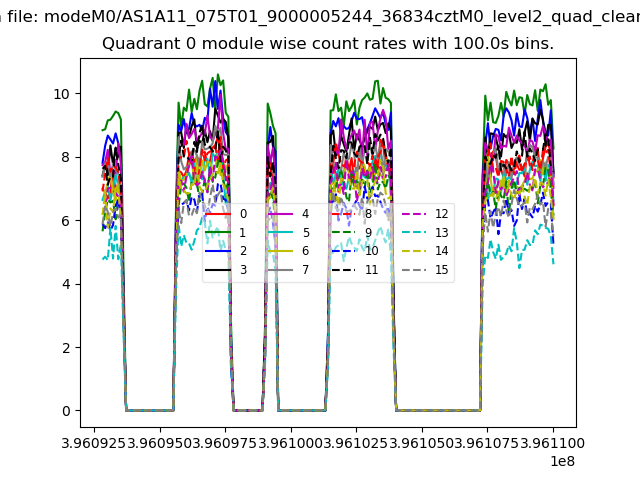 |
 |
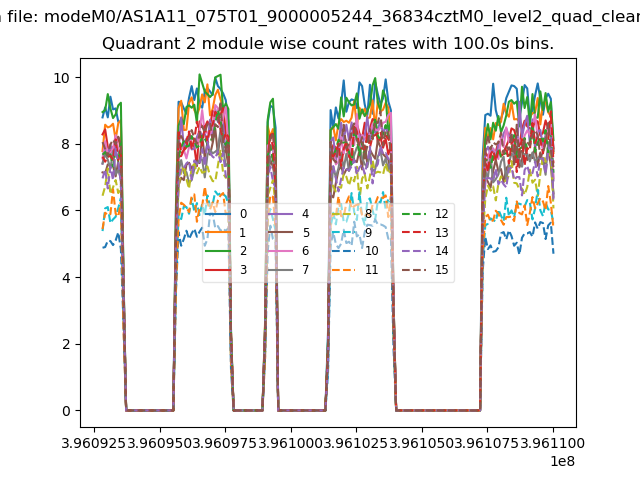
| Module-wise count rates for Quadrant B Data is divided into 100 sec bins |
 |
 |
| Module-wise count rates for Quadrant C Data is divided into 100 sec bins |
 |
 |
| Module-wise count rates for Quadrant D Data is divided into 100 sec bins |
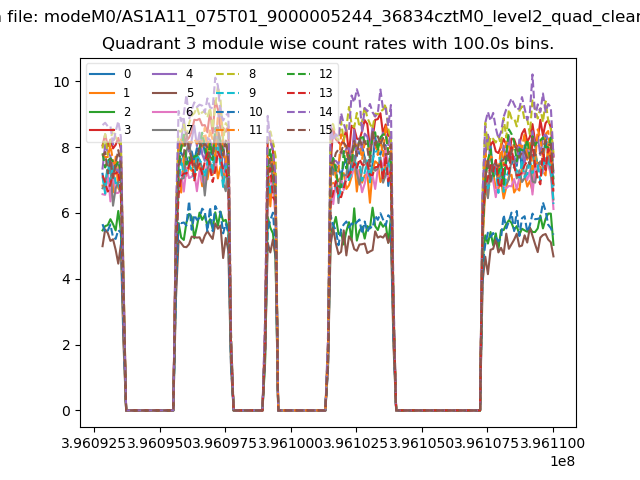 |
 |
| Parameter | Plot |
|---|---|
| CZT HV Monitor | 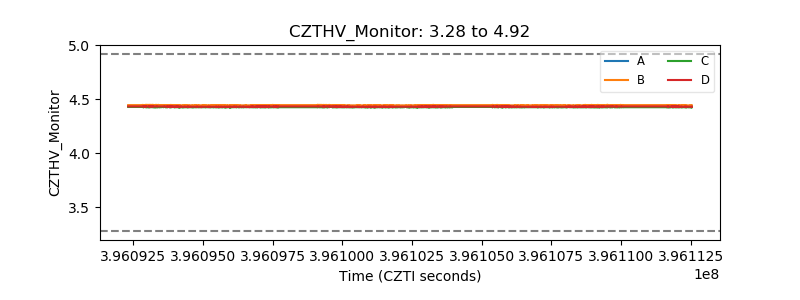 |
| D_VDD | 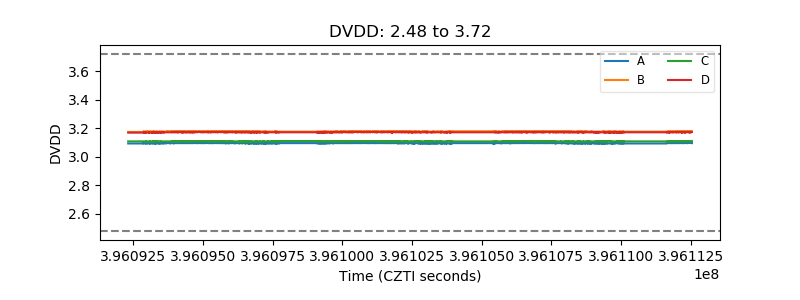 |
| Temperature 1 | 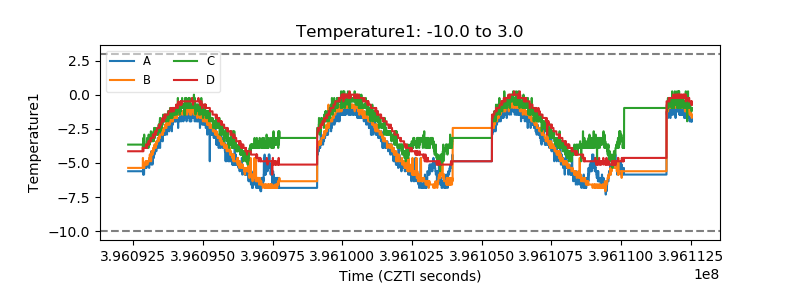 |
| Veto HV Monitor | 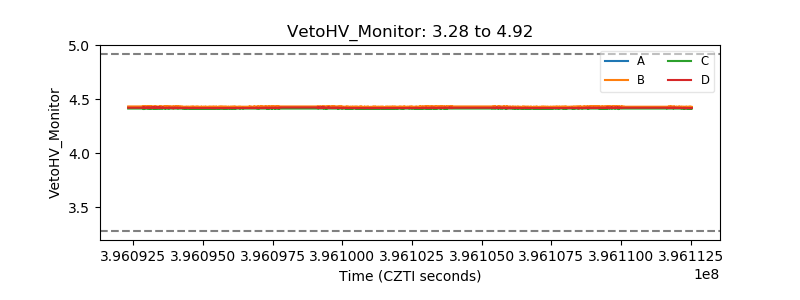 |
| Veto LLD | 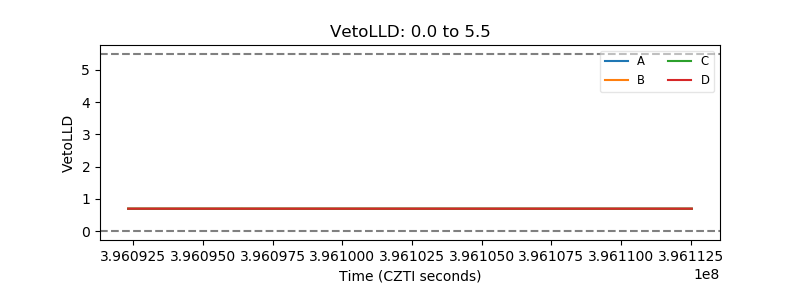 |
| Alpha Counter | 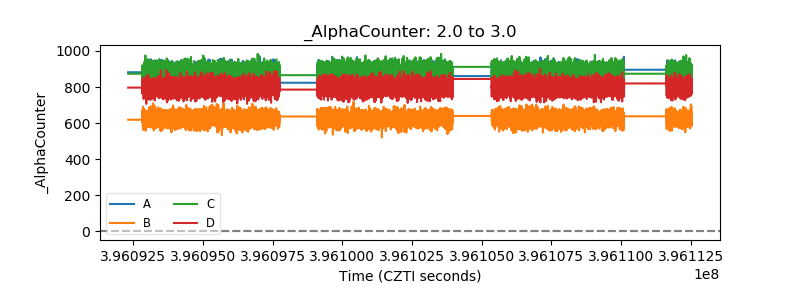 |
| _CPM_Rate | 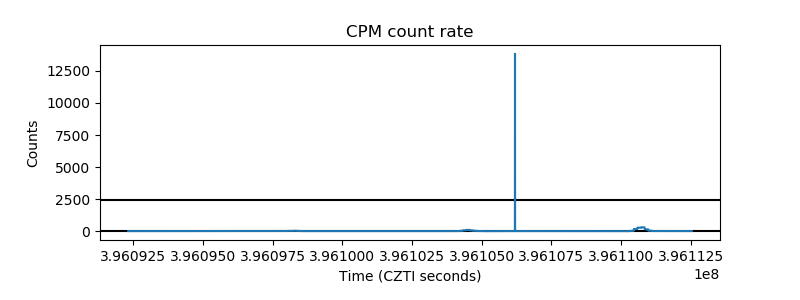 |
| CZT Counter | 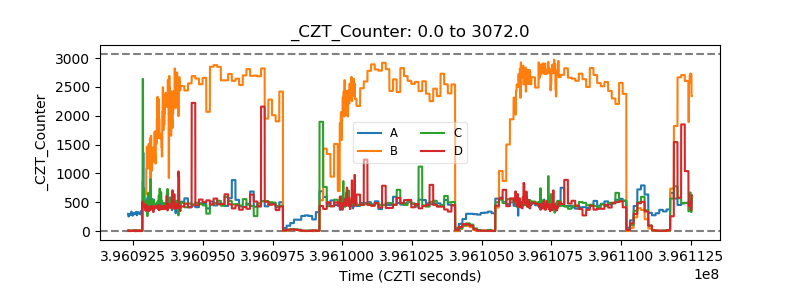 |
| +2.5 Volts monitor |  |
| +5 Volts monitor |  |
| _ROLL_ROT | 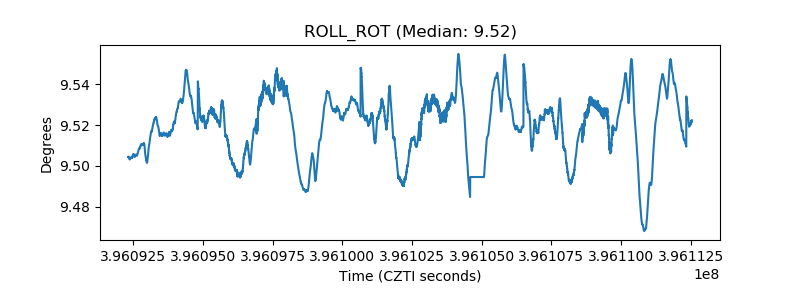 |
| _Roll_DEC |  |
| _Roll_RA | 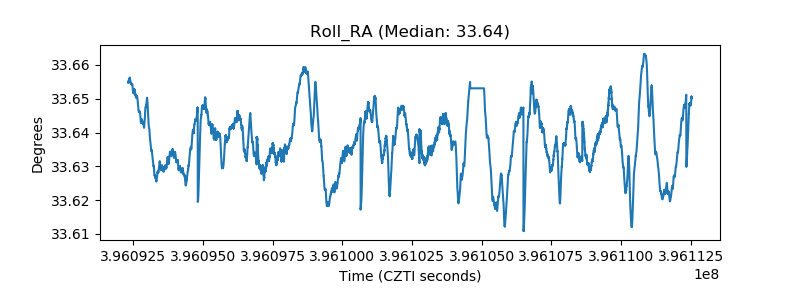 |
| Veto Counter | 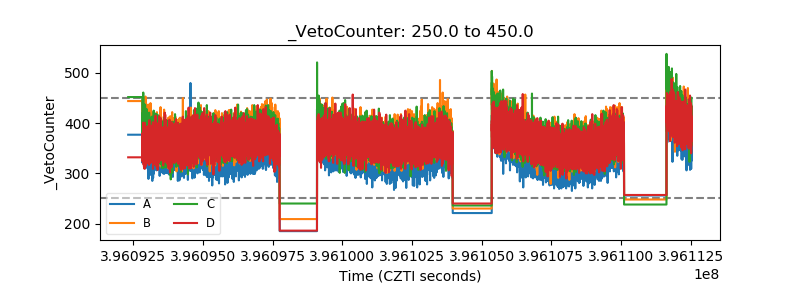 |