| Param | Original file | Final file |
|---|---|---|
| Filename | modeM0/AS1A11_075T01_9000005244_36835cztM0_level2.evt | modeM0/AS1A11_075T01_9000005244_36835cztM0_level2_quad_clean.evt |
| Size (bytes) | 754,093,440 | 52,770,240 |
| Size | 719.2 MB | 50.3 MB |
| Events in quadrant A | 2,786,178 | 371,700 |
| Events in quadrant B | 13,685,030 | 106,129 |
| Events in quadrant C | 2,901,880 | 371,511 |
| Events in quadrant D | 3,087,932 | 357,318 |
| Mode SS | |||
|---|---|---|---|
| Quadrant | BADHDUFLAG | Total packets | Discarded packets |
| A | 0 | 112 | 0 |
| B | 0 | 112 | 0 |
| C | 0 | 112 | 0 |
| D | 0 | 112 | 0 |
| Mode M0 | |||
|---|---|---|---|
| Quadrant | BADHDUFLAG | Total packets | Discarded packets |
| A | 0 | 11948 | 3 |
| B | 0 | 44445 | 2 |
| C | 0 | 12009 | 2 |
| D | 0 | 12952 | 2 |
| Mode M9 | |||
|---|---|---|---|
| Quadrant | BADHDUFLAG | Total packets | Discarded packets |
| A | 0 | 16 | 0 |
| B | 0 | 16 | 0 |
| C | 0 | 16 | 0 |
| D | 0 | 17 | 0 |
| Quadrant | Total seconds | Saturated seconds | Saturation percentage |
|---|---|---|---|
| A | 5569 | 20 | 0.359131% |
| B | 5569 | 5047 | 90.626683% |
| C | 5569 | 47 | 0.843958% |
| D | 5569 | 72 | 1.292871% |
Noise dominated data is calculated using 1-second bins in cleaned event files. If a bin has >2000 counts, and if more than 50% of those come from <1% of pixels, then it is considered to be noise-dominated and hence unusable.
| Quadrant | # 1 sec bins | Bins with >0 counts | Bins with >2000 counts | High rate bins dominated by noise | Noise dominated (total time) | Noise dominated (detector-on time) | Marked lightcurve |
|---|---|---|---|---|---|---|---|
| A | 7182 | 5570 | 8 | 8 | 0.11% | 0.14% | 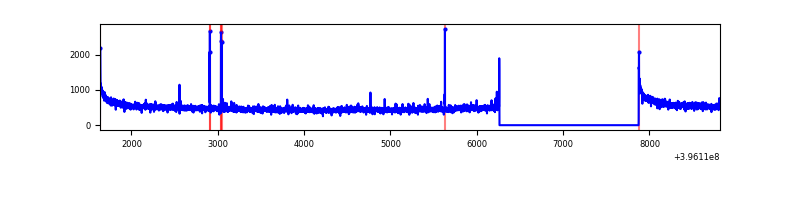 |
| B | 7181 | 5568 | 4891 | 4891 | 68.11% | 87.84% | 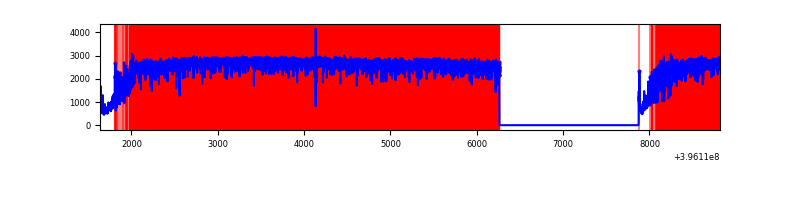 |
| C | 7182 | 5570 | 30 | 30 | 0.42% | 0.54% | 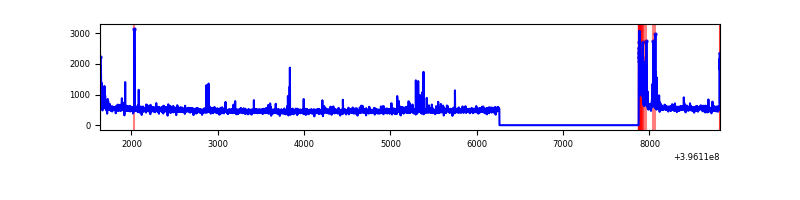 |
| D | 7182 | 5570 | 71 | 71 | 0.99% | 1.27% | 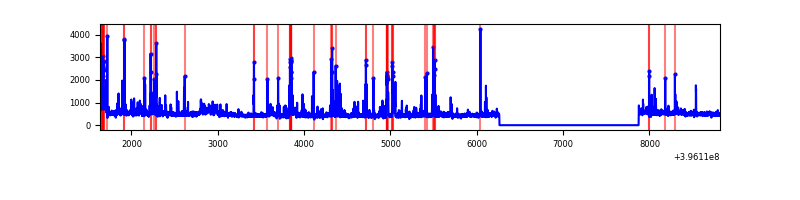 |
Top three noisy pixels from each quadrant. If the there are fewer than three noisy pixels in the level2.evt file, extra rows are filled as -1
| Pixel properties | Quadrant properties | ||||||
|---|---|---|---|---|---|---|---|
| Quadrant | DetID | PixID | Counts | Sigma | Mean | Median | Sigma |
| A | 10 | 83 | 250177 | 1919.3 | 642 | 627 | 130.0 |
| A | 14 | 235 | 17718 | 131.44 | 642 | 627 | 130.0 |
| A | 13 | 6 | 14571 | 107.24 | 642 | 627 | 130.0 |
| B | 12 | 1 | 11926497 | 207777.77 | 293 | 286 | 57.4 |
| B | 5 | 172 | 205437 | 3574.13 | 293 | 286 | 57.4 |
| B | 5 | 255 | 114977 | 1998.14 | 293 | 286 | 57.4 |
| C | 15 | 214 | 240438 | 1651.86 | 623 | 627 | 145.2 |
| C | 0 | 10 | 154510 | 1059.98 | 623 | 627 | 145.2 |
| C | 14 | 254 | 62219 | 424.26 | 623 | 627 | 145.2 |
| D | 13 | 249 | 184080 | 1196.24 | 624 | 607 | 153.4 |
| D | 12 | 233 | 143140 | 929.31 | 624 | 607 | 153.4 |
| D | 2 | 153 | 78018 | 504.72 | 624 | 607 | 153.4 |
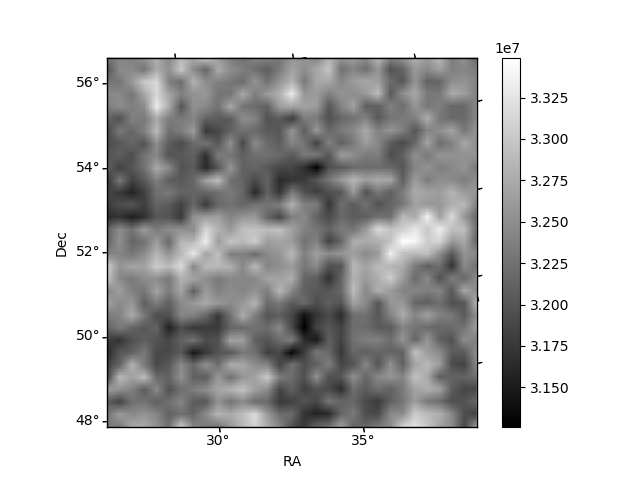
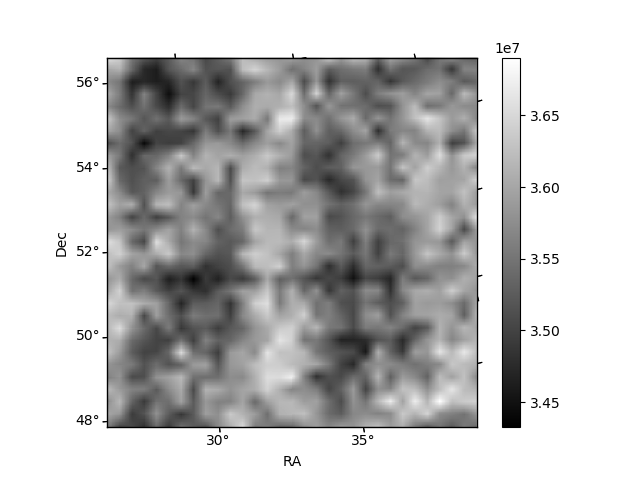
Histogram calculated using DETX and DETY for each event in the final _common_clean file
| Quadrant A | 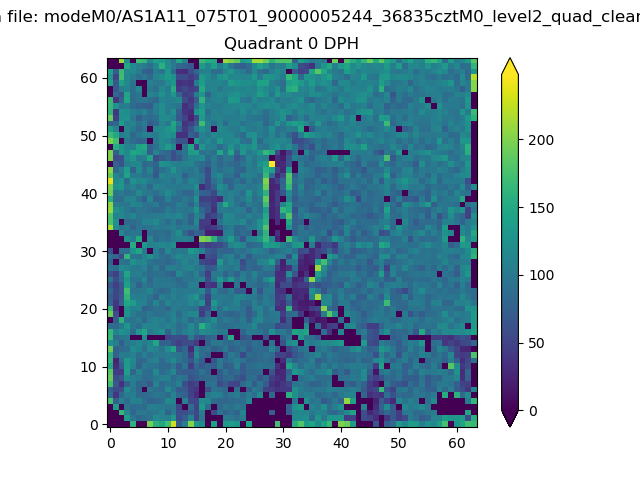 |
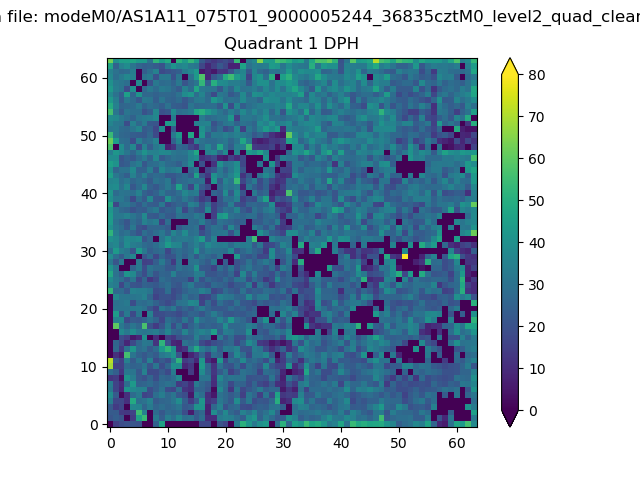 |
Quadrant B |
|---|---|---|---|
| Quadrant D |  |
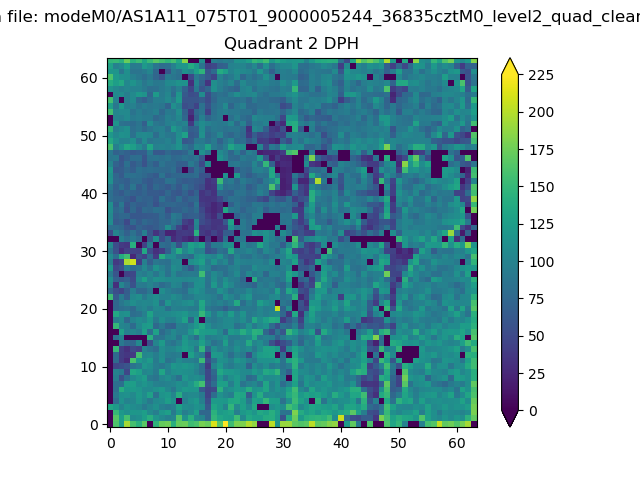 |
Quadrant C |
| Plot type | Count rate plots | Images |
|---|---|---|
| Comparison with Poisson distribution Blue bars denote a histogram of data divided into 1 sec bins. Red curve is a Poisson curve with rate = median count rate of data. |
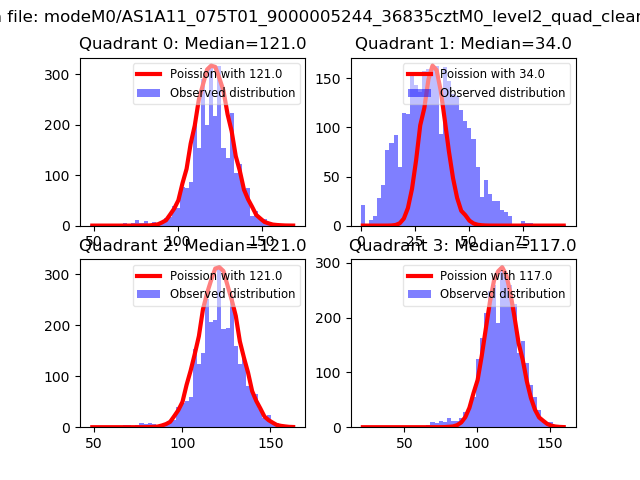 |
 |
| Quadrant-wise count rates Data is divided into 100 sec bins |
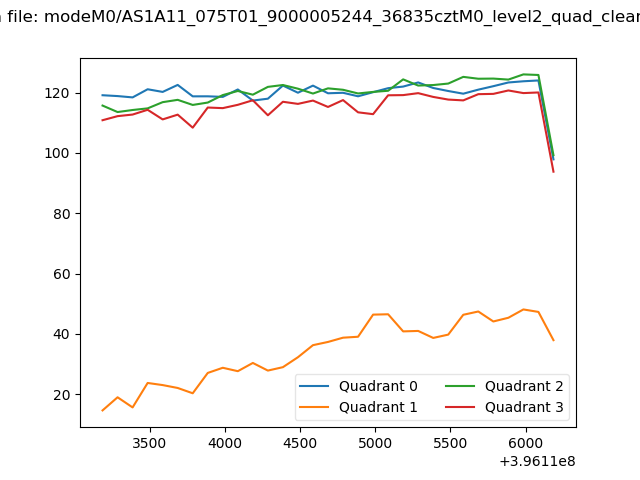 |
|
| Module-wise count rates for Quadrant A Data is divided into 100 sec bins |
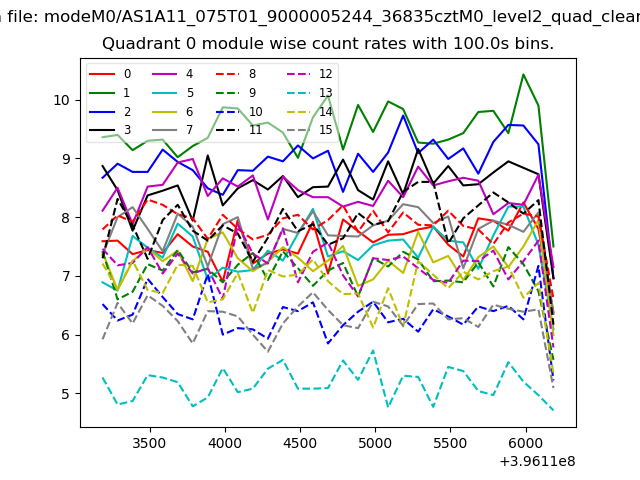 |
 |
| Module-wise count rates for Quadrant B Data is divided into 100 sec bins |
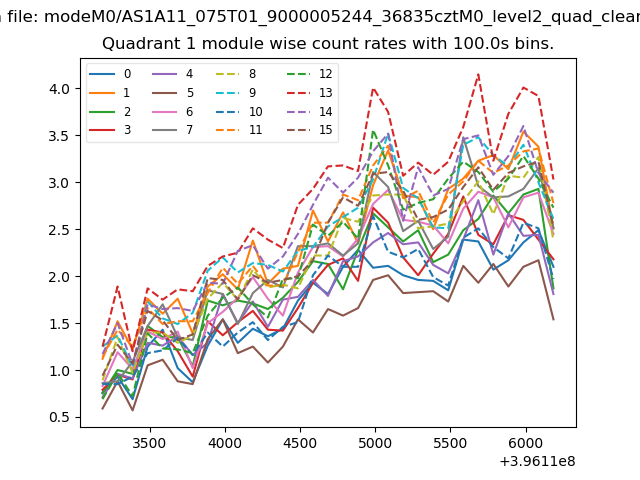 |
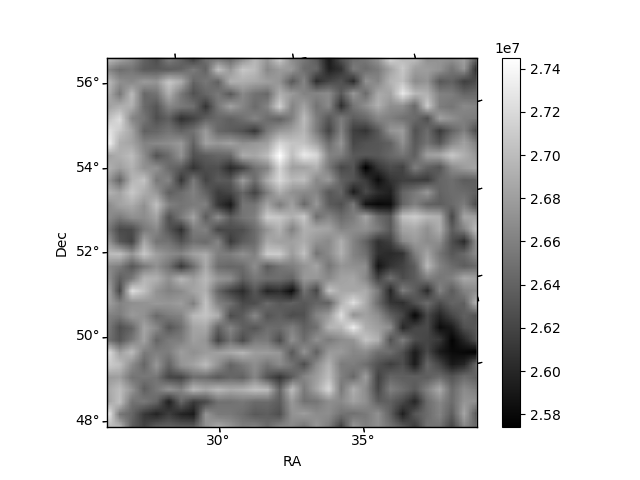 |
| Module-wise count rates for Quadrant C Data is divided into 100 sec bins |
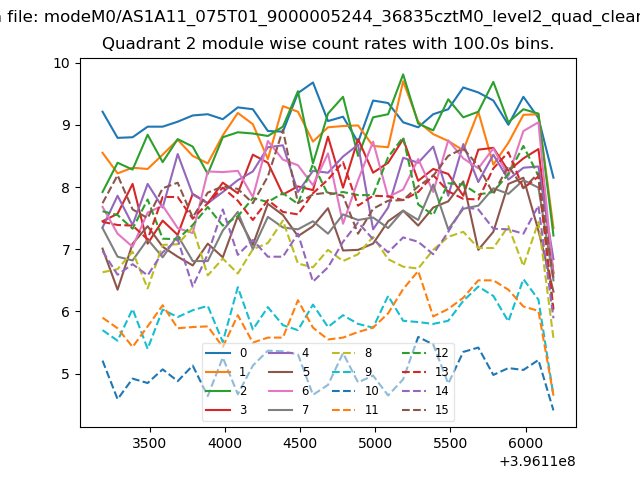 |
 |
| Module-wise count rates for Quadrant D Data is divided into 100 sec bins |
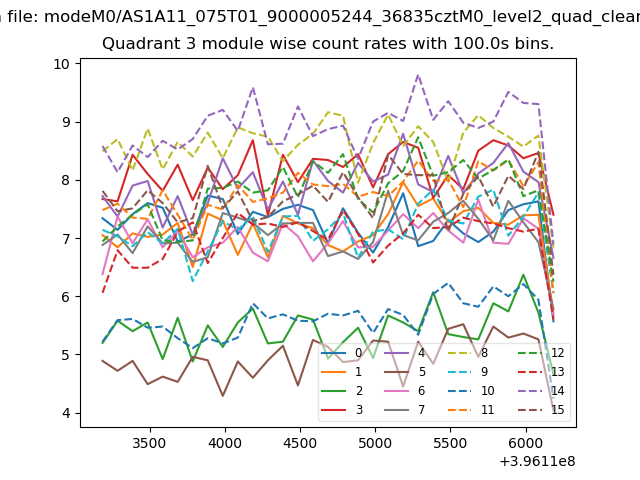 |
 |
| Parameter | Plot |
|---|---|
| CZT HV Monitor | 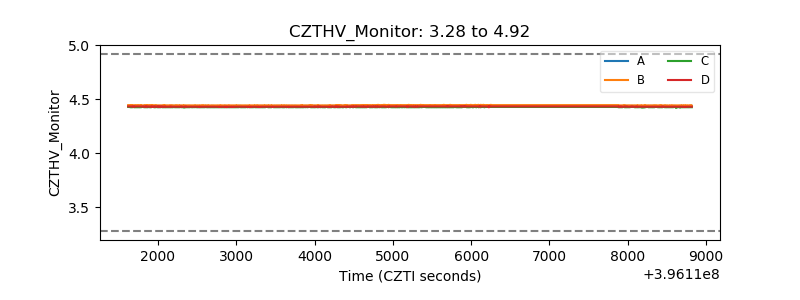 |
| D_VDD | 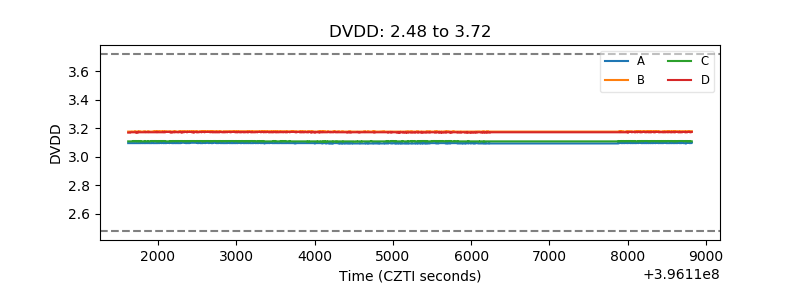 |
| Temperature 1 | 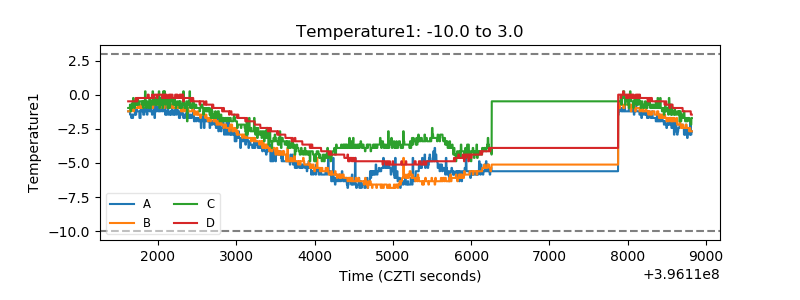 |
| Veto HV Monitor |  |
| Veto LLD | 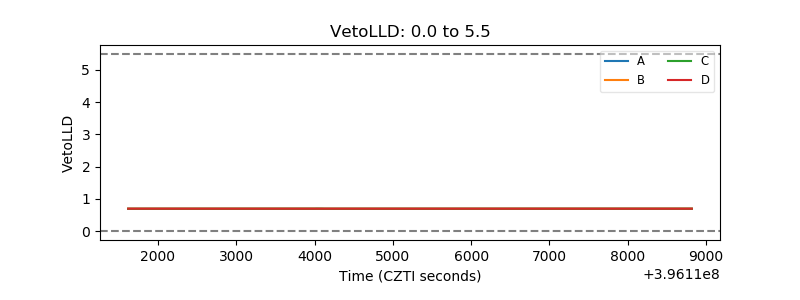 |
| Alpha Counter | 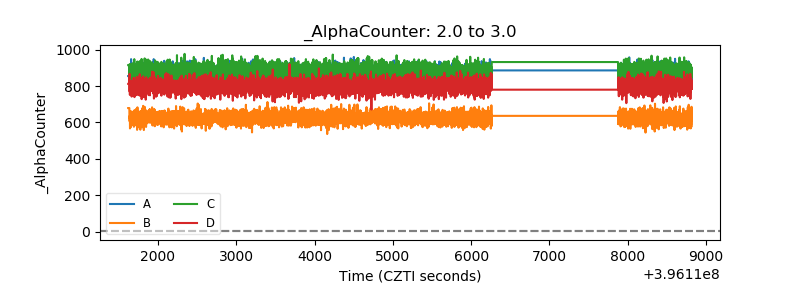 |
| _CPM_Rate | 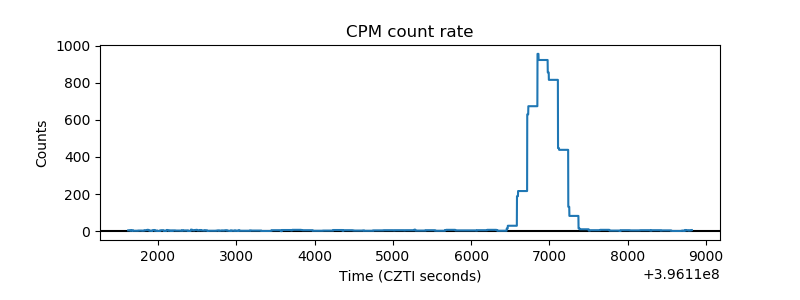 |
| CZT Counter |  |
| +2.5 Volts monitor |  |
| +5 Volts monitor |  |
| _ROLL_ROT | 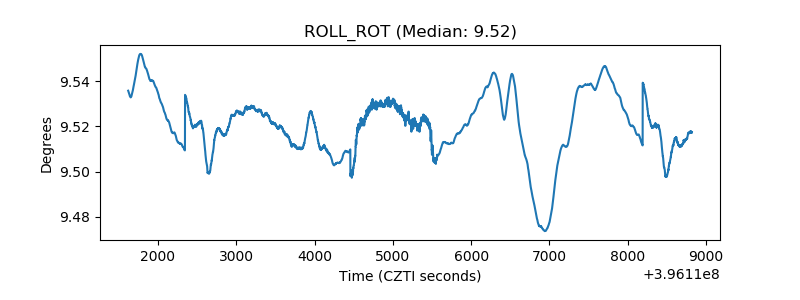 |
| _Roll_DEC |  |
| _Roll_RA |  |
| Veto Counter | 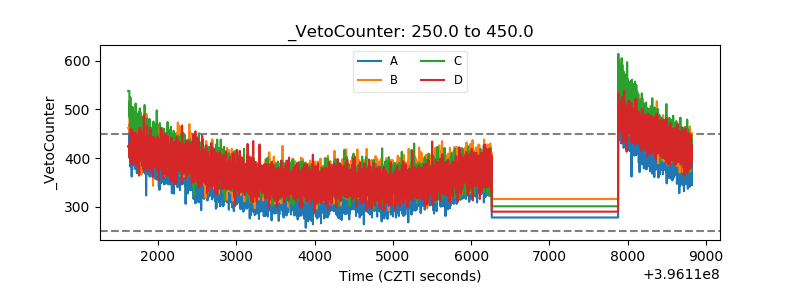 |