| Param | Original file | Final file |
|---|---|---|
| Filename | modeM0/AS1A11_075T01_9000005244_36837cztM0_level2.evt | modeM0/AS1A11_075T01_9000005244_36837cztM0_level2_quad_clean.evt |
| Size (bytes) | 730,025,280 | 66,746,880 |
| Size | 696.2 MB | 63.7 MB |
| Events in quadrant A | 2,865,054 | 490,601 |
| Events in quadrant B | 12,746,488 | 204,205 |
| Events in quadrant C | 2,983,468 | 474,484 |
| Events in quadrant D | 3,151,574 | 475,567 |
| Mode SS | |||
|---|---|---|---|
| Quadrant | BADHDUFLAG | Total packets | Discarded packets |
| A | 0 | 108 | 0 |
| B | 0 | 108 | 0 |
| C | 0 | 108 | 0 |
| D | 0 | 108 | 0 |
| Mode M0 | |||
|---|---|---|---|
| Quadrant | BADHDUFLAG | Total packets | Discarded packets |
| A | 0 | 12061 | 3 |
| B | 0 | 41481 | 2 |
| C | 0 | 12152 | 2 |
| D | 0 | 12910 | 2 |
| Mode M9 | |||
|---|---|---|---|
| Quadrant | BADHDUFLAG | Total packets | Discarded packets |
| A | 0 | 26 | 0 |
| B | 0 | 26 | 0 |
| C | 0 | 26 | 0 |
| D | 0 | 27 | 0 |
| Quadrant | Total seconds | Saturated seconds | Saturation percentage |
|---|---|---|---|
| A | 5354 | 24 | 0.448263% |
| B | 5354 | 4834 | 90.287635% |
| C | 5354 | 69 | 1.288756% |
| D | 5354 | 92 | 1.718341% |
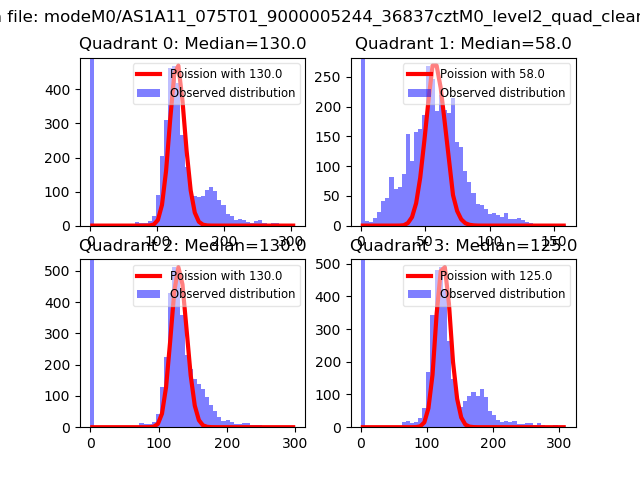
Noise dominated data is calculated using 1-second bins in cleaned event files. If a bin has >2000 counts, and if more than 50% of those come from <1% of pixels, then it is considered to be noise-dominated and hence unusable.
| Quadrant | # 1 sec bins | Bins with >0 counts | Bins with >2000 counts | High rate bins dominated by noise | Noise dominated (total time) | Noise dominated (detector-on time) | Marked lightcurve |
|---|---|---|---|---|---|---|---|
| A | 7117 | 5355 | 4 | 4 | 0.06% | 0.07% | 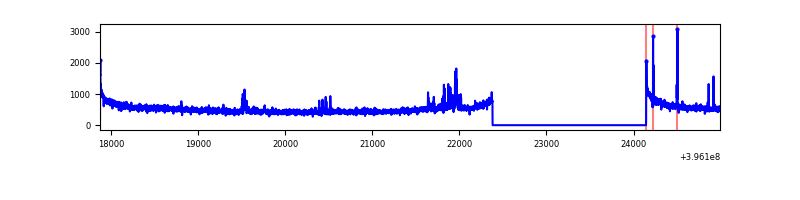 |
| B | 7116 | 5353 | 4596 | 4596 | 64.59% | 85.86% | 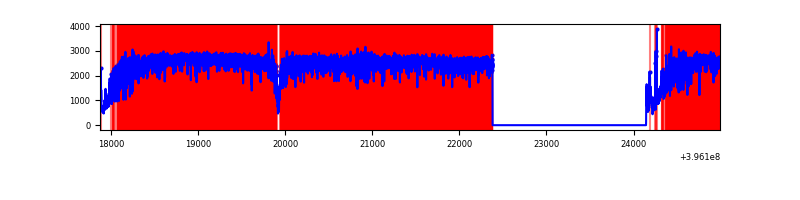 |
| C | 7117 | 5355 | 45 | 45 | 0.63% | 0.84% | 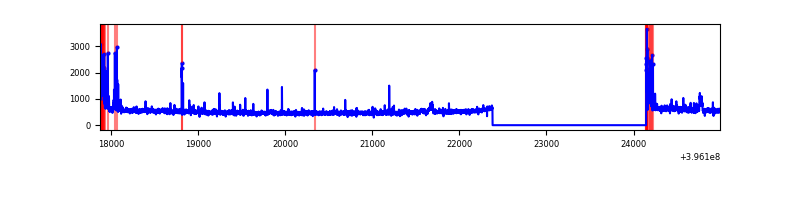 |
| D | 7117 | 5355 | 83 | 83 | 1.17% | 1.55% | 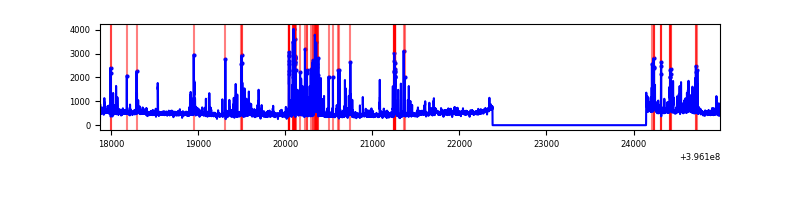 |
Top three noisy pixels from each quadrant. If the there are fewer than three noisy pixels in the level2.evt file, extra rows are filled as -1
| Pixel properties | Quadrant properties | ||||||
|---|---|---|---|---|---|---|---|
| Quadrant | DetID | PixID | Counts | Sigma | Mean | Median | Sigma |
| A | 10 | 83 | 244767 | 1856.99 | 645 | 634 | 131.5 |
| A | 7 | 3 | 85401 | 644.78 | 645 | 634 | 131.5 |
| A | 13 | 248 | 20722 | 152.8 | 645 | 634 | 131.5 |
| B | 12 | 1 | 10775024 | 155752.86 | 359 | 350 | 69.2 |
| B | 5 | 200 | 115423 | 1663.43 | 359 | 350 | 69.2 |
| B | 5 | 172 | 100201 | 1443.39 | 359 | 350 | 69.2 |
| C | 15 | 214 | 244374 | 1686.96 | 624 | 630 | 144.5 |
| C | 0 | 10 | 206966 | 1428.06 | 624 | 630 | 144.5 |
| C | 14 | 254 | 41145 | 280.41 | 624 | 630 | 144.5 |
| D | 12 | 233 | 148114 | 948.07 | 632 | 616 | 155.6 |
| D | 2 | 153 | 142442 | 911.62 | 632 | 616 | 155.6 |
| D | 2 | 250 | 136701 | 874.71 | 632 | 616 | 155.6 |
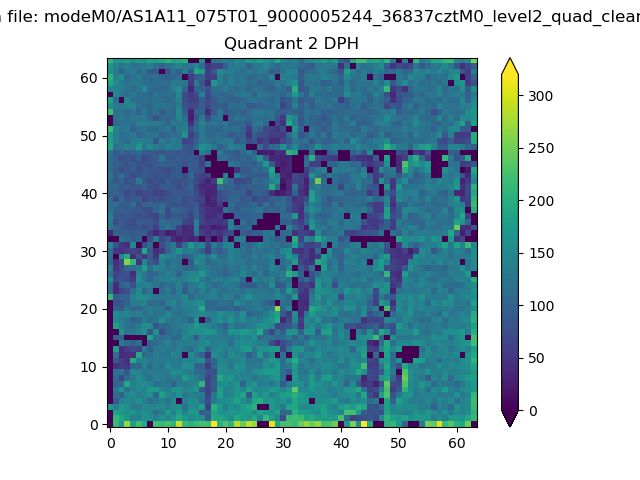
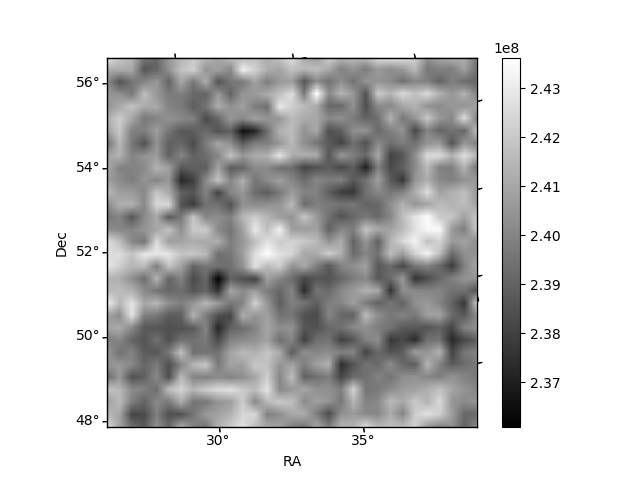
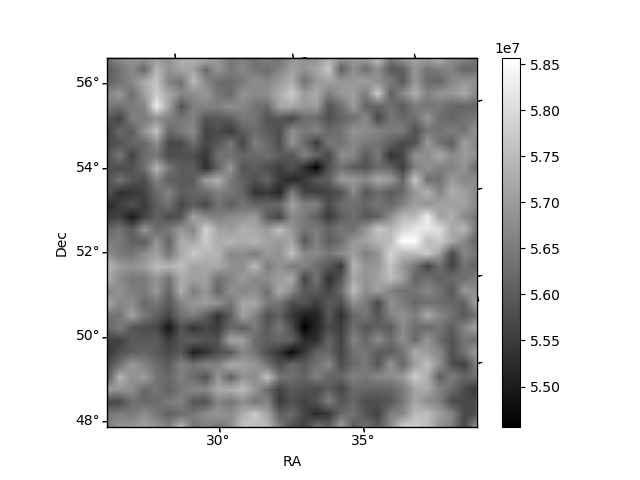
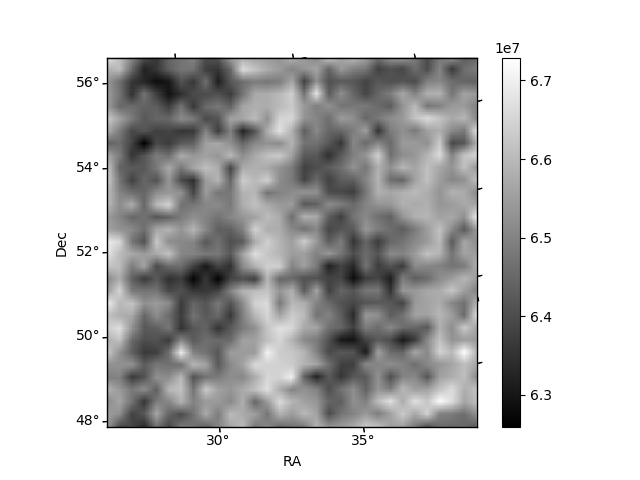
Histogram calculated using DETX and DETY for each event in the final _common_clean file
| Quadrant A | 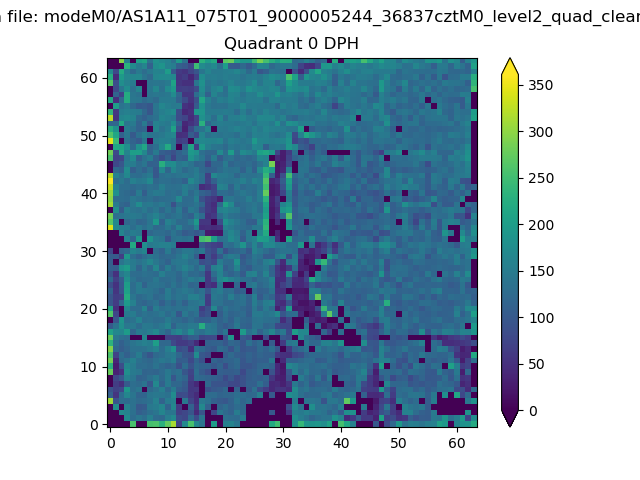 |
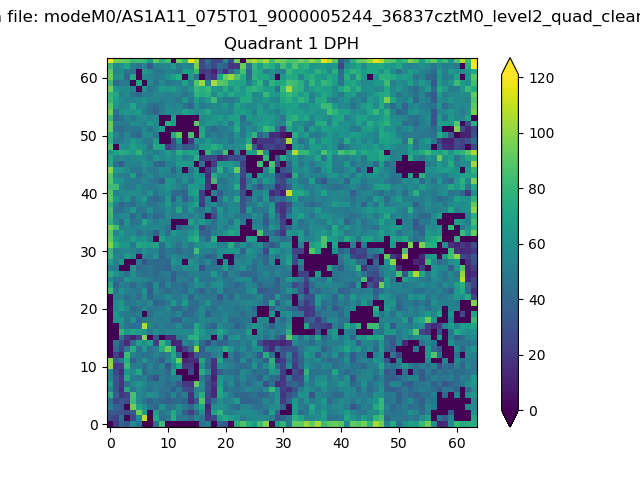 |
Quadrant B |
|---|---|---|---|
| Quadrant D | 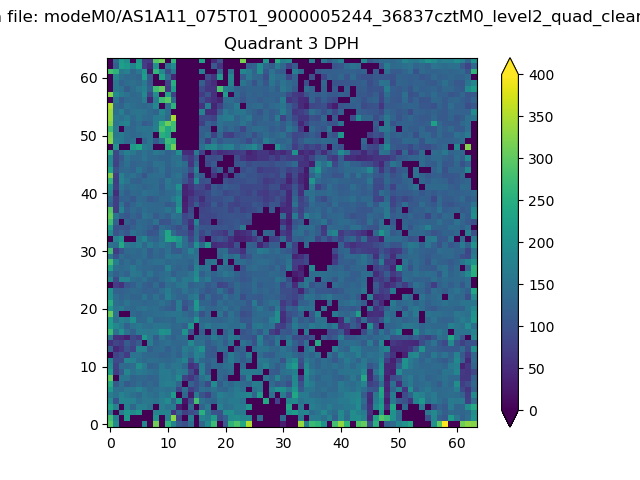 |
 |
Quadrant C |
| Plot type | Count rate plots | Images |
|---|---|---|
| Comparison with Poisson distribution Blue bars denote a histogram of data divided into 1 sec bins. Red curve is a Poisson curve with rate = median count rate of data. |
 |
 |
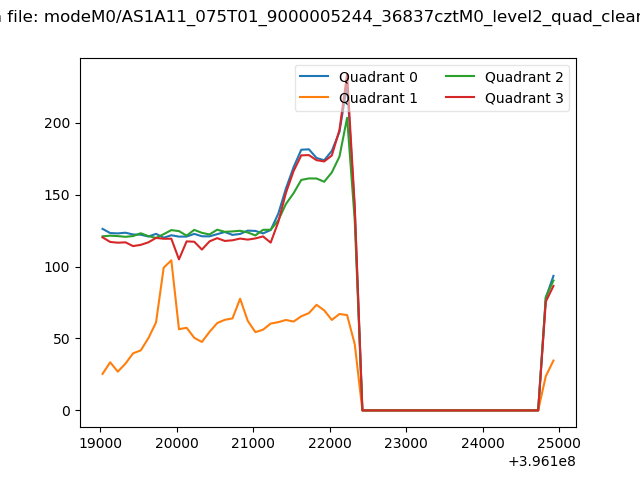
| Quadrant-wise count rates Data is divided into 100 sec bins |
 |
|
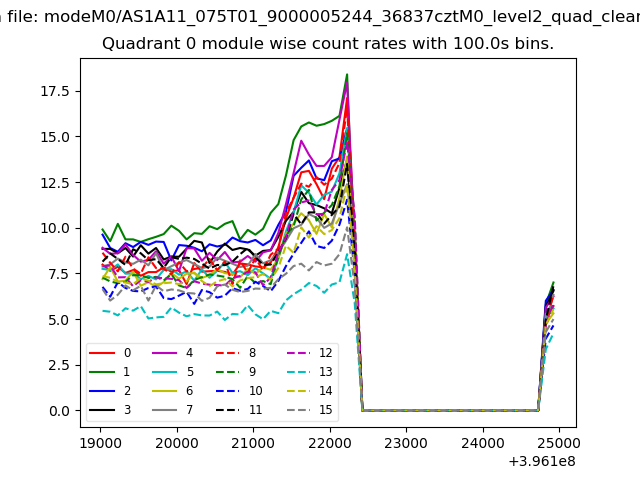
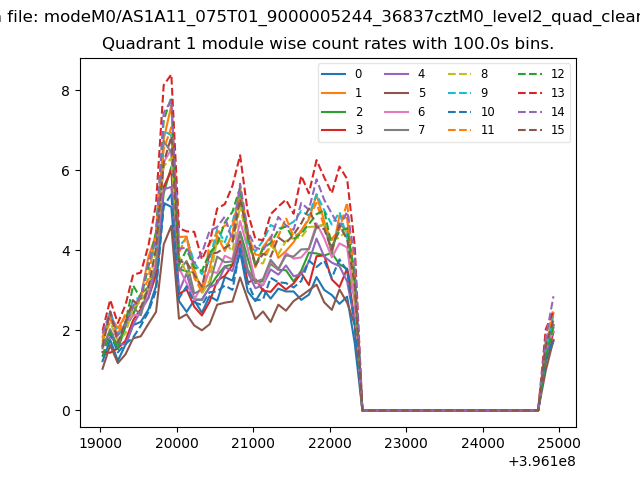
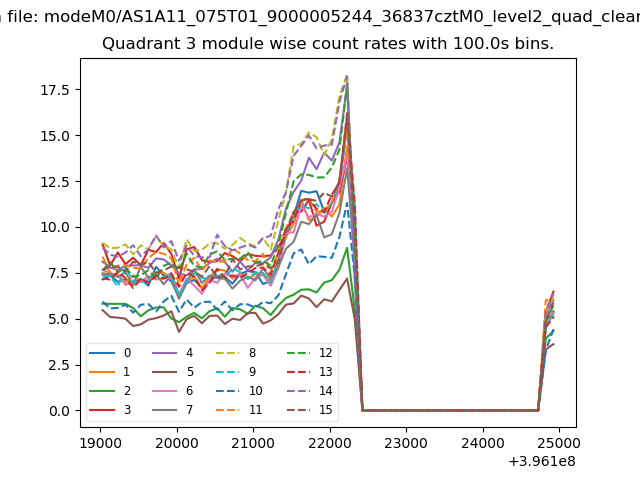
| Module-wise count rates for Quadrant A Data is divided into 100 sec bins |
 |
 |
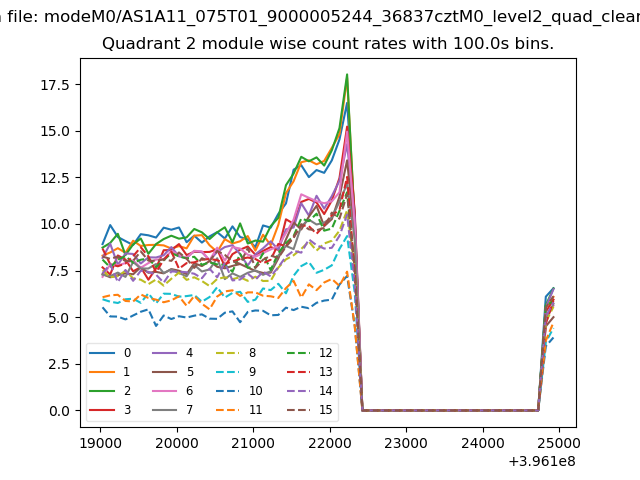
| Module-wise count rates for Quadrant B Data is divided into 100 sec bins |
 |
 |
| Module-wise count rates for Quadrant C Data is divided into 100 sec bins |
 |
 |
| Module-wise count rates for Quadrant D Data is divided into 100 sec bins |
 |
 |
| Parameter | Plot |
|---|---|
| CZT HV Monitor | 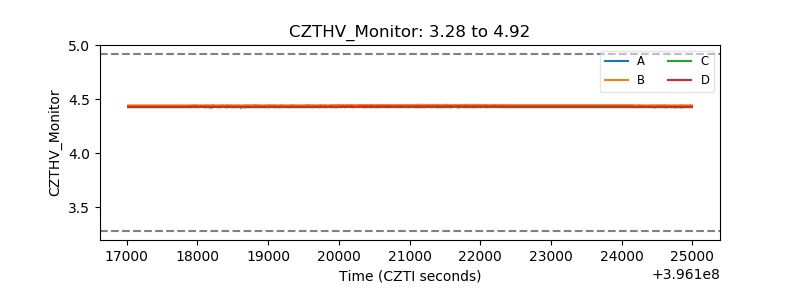 |
| D_VDD | 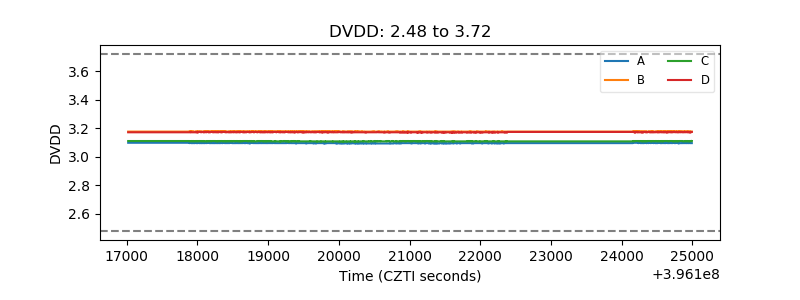 |
| Temperature 1 | 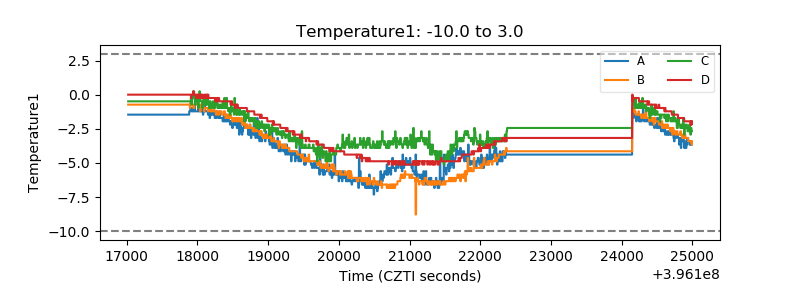 |
| Veto HV Monitor | 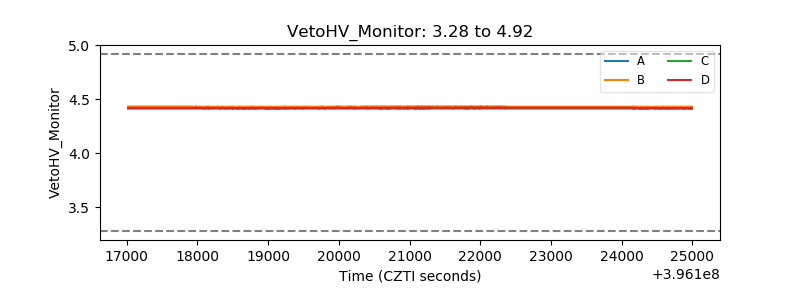 |
| Veto LLD | 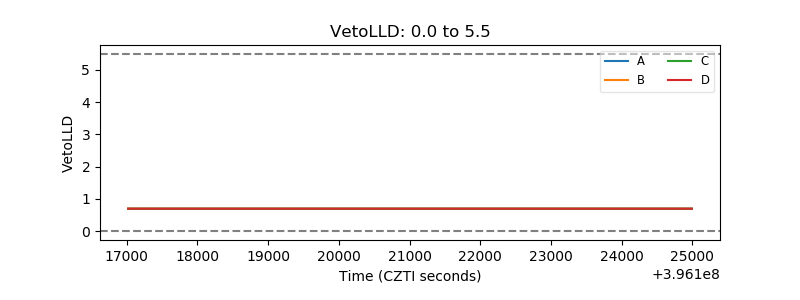 |
| Alpha Counter | 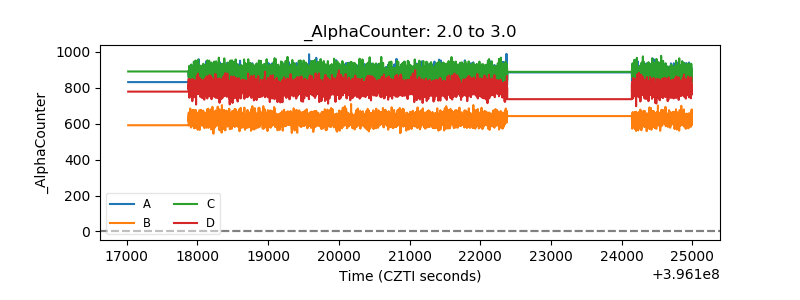 |
| _CPM_Rate | 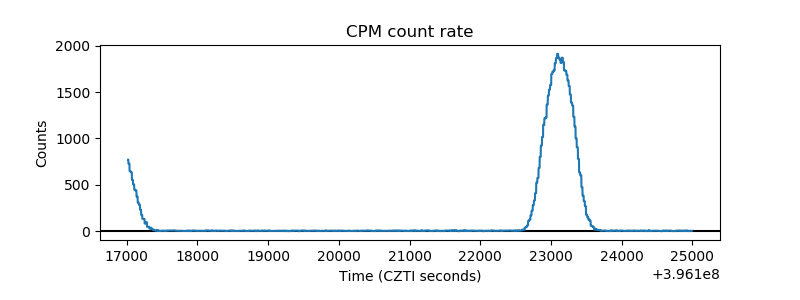 |
| CZT Counter | 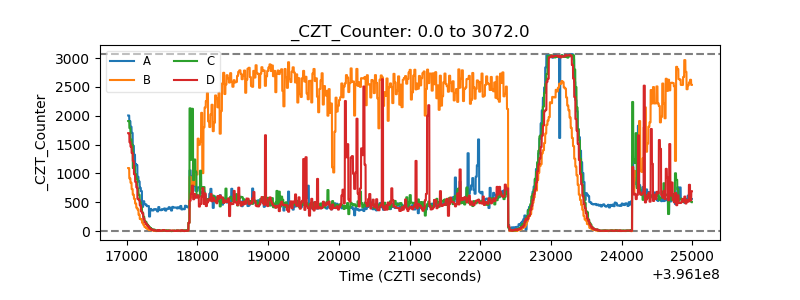 |
| +2.5 Volts monitor |  |
| +5 Volts monitor |  |
| _ROLL_ROT | 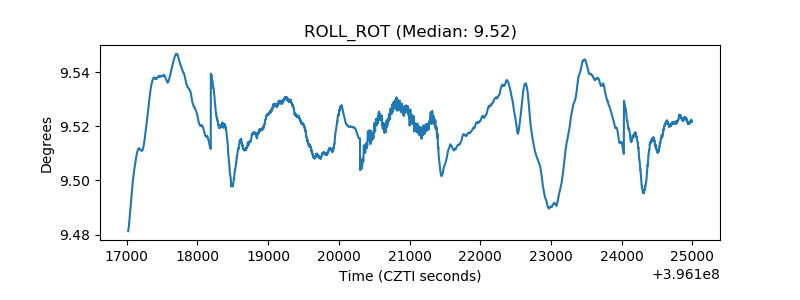 |
| _Roll_DEC |  |
| _Roll_RA | 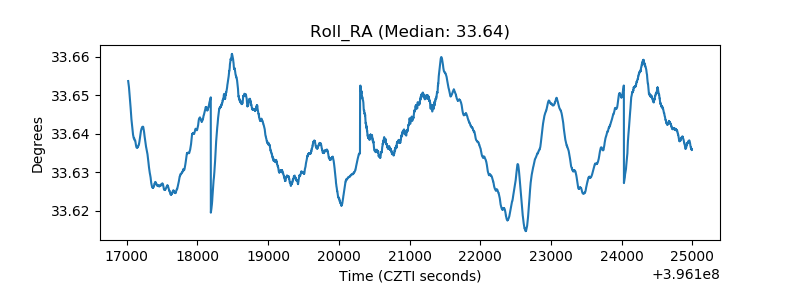 |
| Veto Counter | 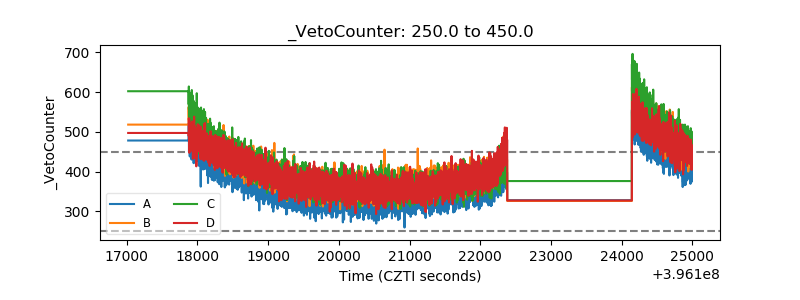 |