| Param | Original file | Final file |
|---|---|---|
| Filename | modeM0/AS1A11_075T01_9000005244_36838cztM0_level2.evt | modeM0/AS1A11_075T01_9000005244_36838cztM0_level2_quad_clean.evt |
| Size (bytes) | 688,176,000 | 75,787,200 |
| Size | 656.3 MB | 72.3 MB |
| Events in quadrant A | 2,907,377 | 541,509 |
| Events in quadrant B | 11,716,339 | 313,053 |
| Events in quadrant C | 2,844,430 | 552,017 |
| Events in quadrant D | 3,023,577 | 524,846 |
| Mode SS | |||
|---|---|---|---|
| Quadrant | BADHDUFLAG | Total packets | Discarded packets |
| A | 0 | 106 | 0 |
| B | 0 | 106 | 0 |
| C | 0 | 106 | 0 |
| D | 0 | 106 | 0 |
| Mode M0 | |||
|---|---|---|---|
| Quadrant | BADHDUFLAG | Total packets | Discarded packets |
| A | 0 | 12023 | 3 |
| B | 0 | 38316 | 2 |
| C | 0 | 11672 | 2 |
| D | 0 | 12414 | 2 |
| Mode M9 | |||
|---|---|---|---|
| Quadrant | BADHDUFLAG | Total packets | Discarded packets |
| A | 0 | 34 | 0 |
| B | 0 | 34 | 0 |
| C | 0 | 34 | 0 |
| D | 0 | 35 | 0 |
| Quadrant | Total seconds | Saturated seconds | Saturation percentage |
|---|---|---|---|
| A | 5159 | 37 | 0.717193% |
| B | 5159 | 4396 | 85.210312% |
| C | 5159 | 71 | 1.376236% |
| D | 5159 | 86 | 1.666990% |
Noise dominated data is calculated using 1-second bins in cleaned event files. If a bin has >2000 counts, and if more than 50% of those come from <1% of pixels, then it is considered to be noise-dominated and hence unusable.
| Quadrant | # 1 sec bins | Bins with >0 counts | Bins with >2000 counts | High rate bins dominated by noise | Noise dominated (total time) | Noise dominated (detector-on time) | Marked lightcurve |
|---|---|---|---|---|---|---|---|
| A | 7042 | 5160 | 14 | 14 | 0.20% | 0.27% | 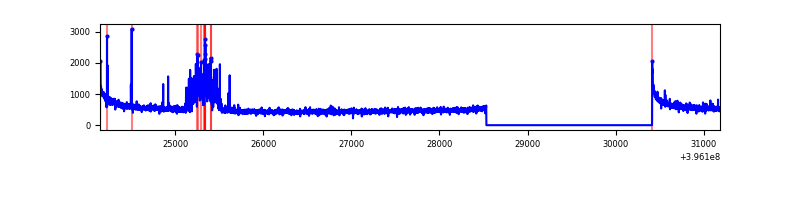 |
| B | 7042 | 5159 | 4113 | 4113 | 58.41% | 79.72% | 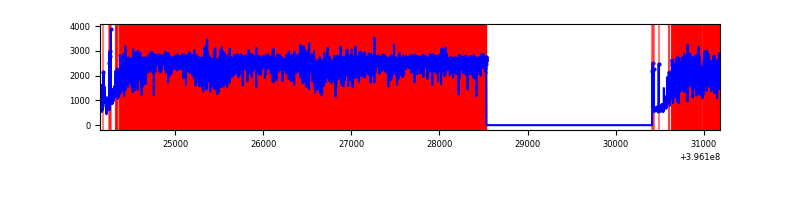 |
| C | 7042 | 5160 | 47 | 47 | 0.67% | 0.91% | 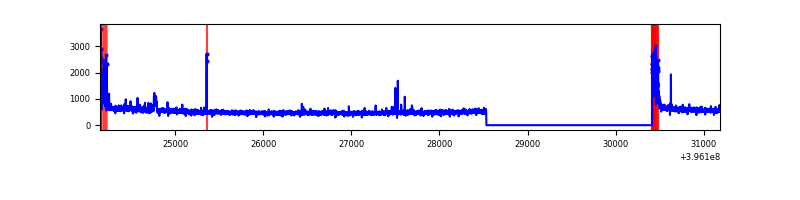 |
| D | 7042 | 5160 | 71 | 71 | 1.01% | 1.38% | 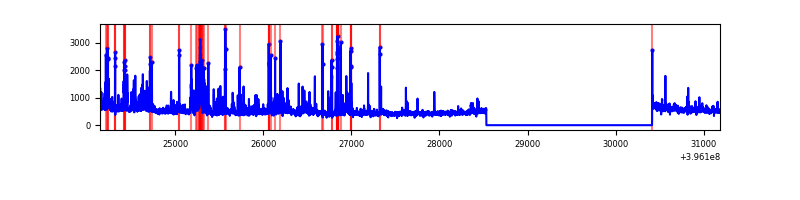 |
Top three noisy pixels from each quadrant. If the there are fewer than three noisy pixels in the level2.evt file, extra rows are filled as -1
| Pixel properties | Quadrant properties | ||||||
|---|---|---|---|---|---|---|---|
| Quadrant | DetID | PixID | Counts | Sigma | Mean | Median | Sigma |
| A | 7 | 3 | 270695 | 2203.12 | 611 | 601 | 122.6 |
| A | 10 | 83 | 234474 | 1907.67 | 611 | 601 | 122.6 |
| A | 13 | 248 | 21244 | 168.38 | 611 | 601 | 122.6 |
| B | 12 | 1 | 9548814 | 119227.36 | 422 | 412 | 80.1 |
| B | 5 | 200 | 97322 | 1210.08 | 422 | 412 | 80.1 |
| B | 5 | 255 | 89149 | 1108.03 | 422 | 412 | 80.1 |
| C | 15 | 214 | 235549 | 1676.44 | 603 | 608 | 140.1 |
| C | 0 | 10 | 188090 | 1337.79 | 603 | 608 | 140.1 |
| C | 14 | 254 | 34631 | 242.77 | 603 | 608 | 140.1 |
| D | 12 | 233 | 270029 | 1839.1 | 602 | 586 | 146.5 |
| D | 13 | 249 | 82601 | 559.8 | 602 | 586 | 146.5 |
| D | 2 | 250 | 75554 | 511.7 | 602 | 586 | 146.5 |
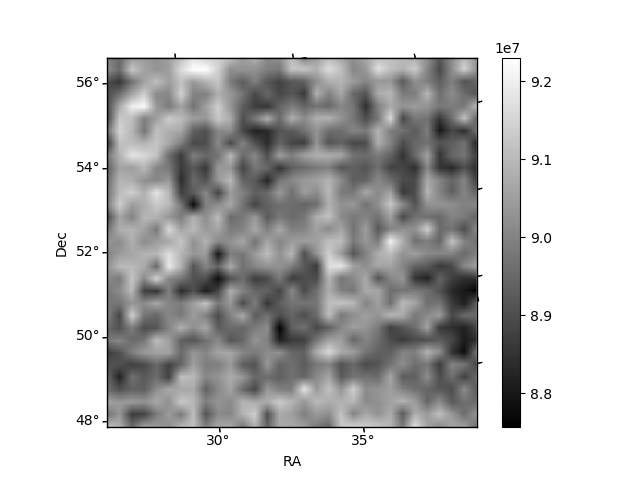
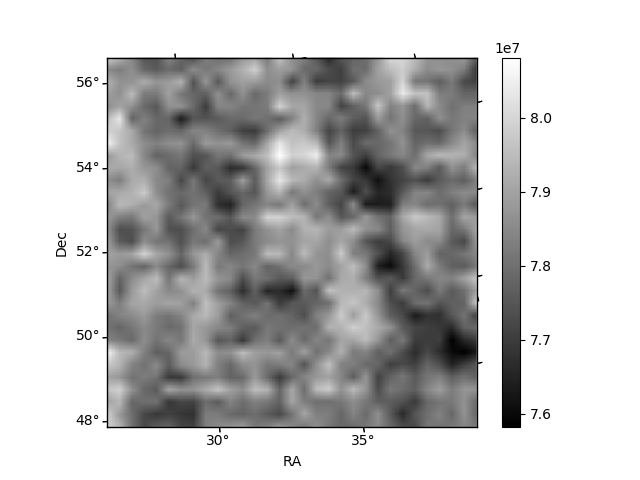
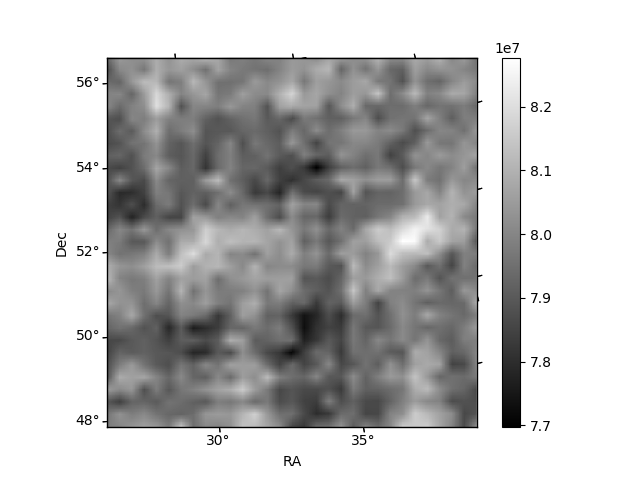
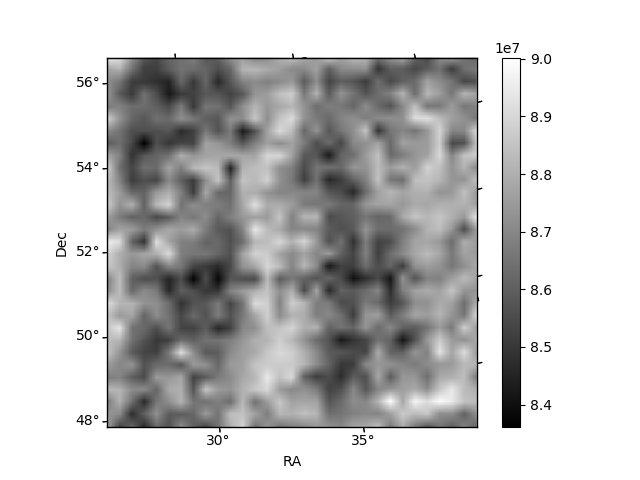
Histogram calculated using DETX and DETY for each event in the final _common_clean file
| Quadrant A | 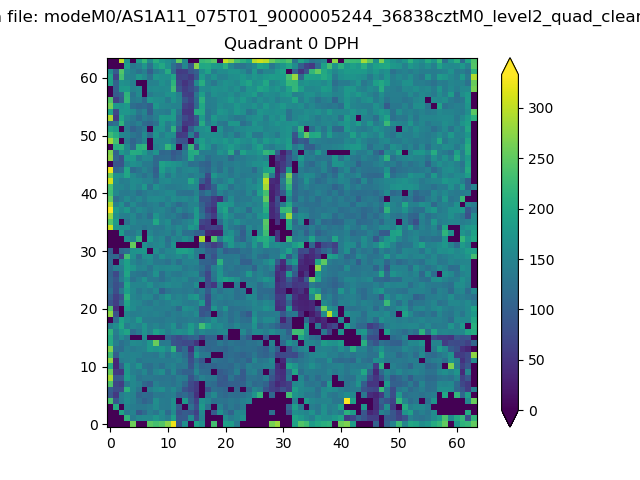 |
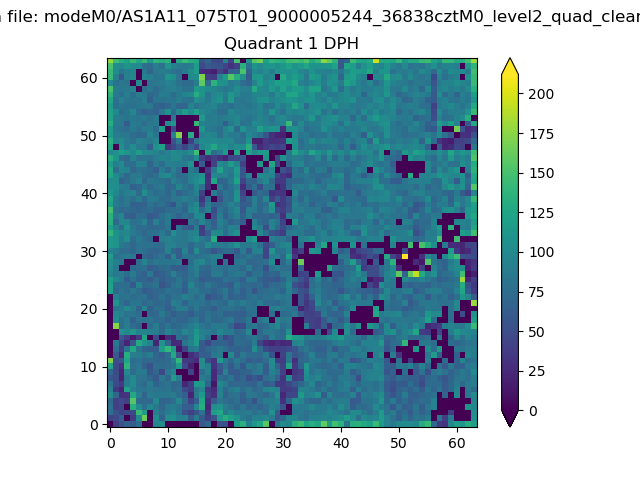 |
Quadrant B |
|---|---|---|---|
| Quadrant D | 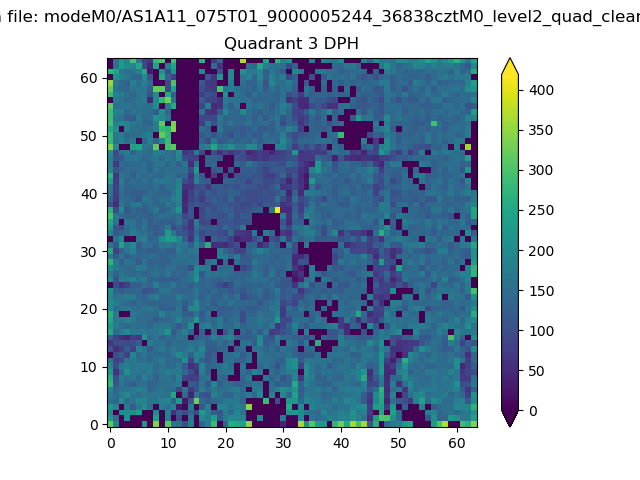 |
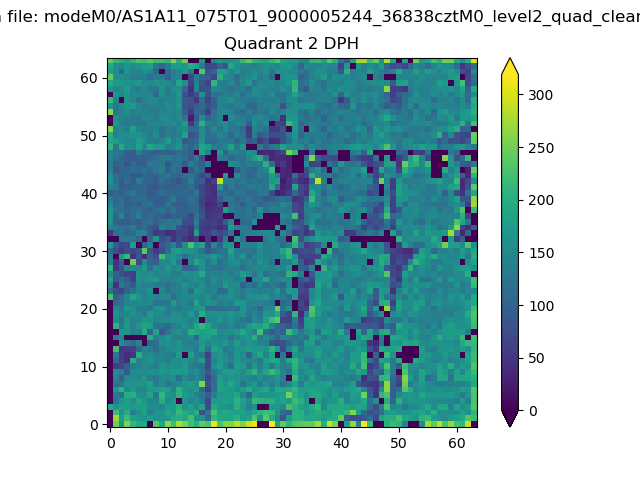 |
Quadrant C |
| Plot type | Count rate plots | Images |
|---|---|---|
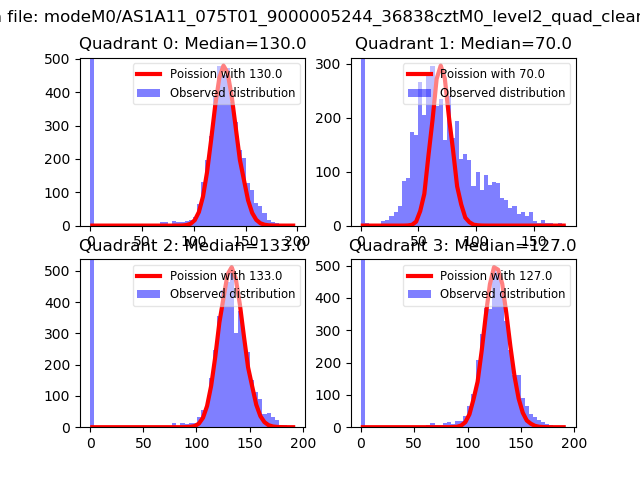
| Comparison with Poisson distribution Blue bars denote a histogram of data divided into 1 sec bins. Red curve is a Poisson curve with rate = median count rate of data. |
 |
 |
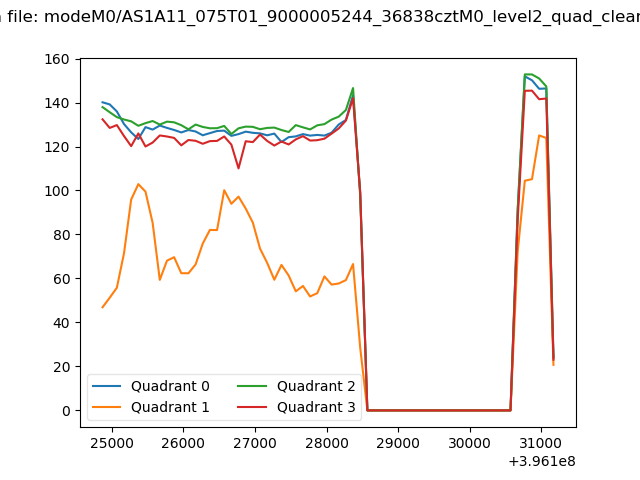
| Quadrant-wise count rates Data is divided into 100 sec bins |
 |
|
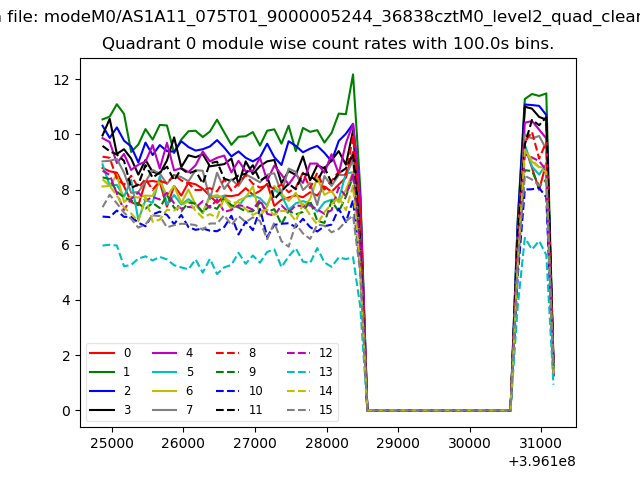
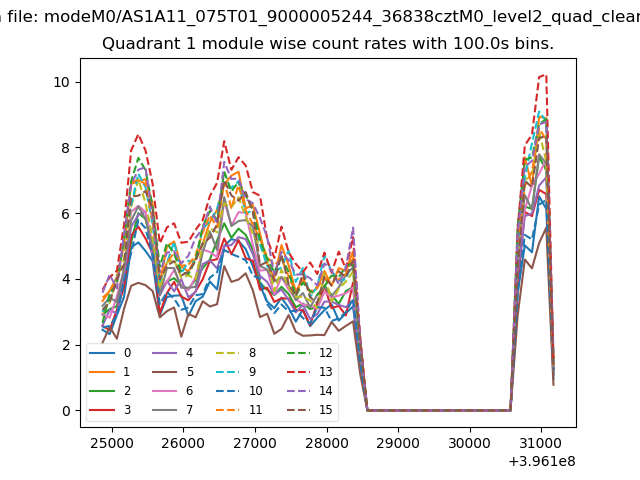
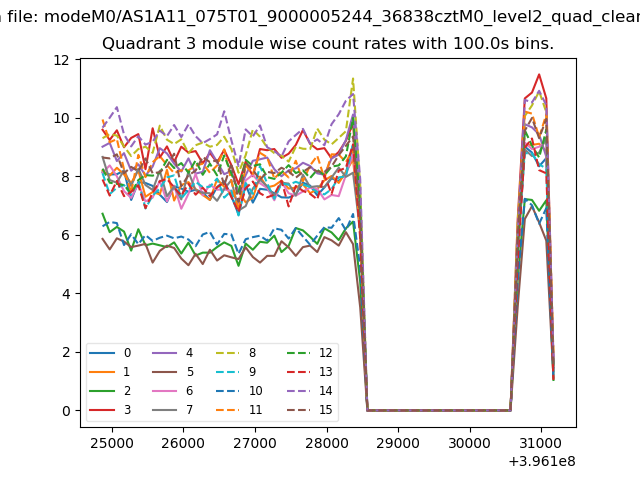
| Module-wise count rates for Quadrant A Data is divided into 100 sec bins |
 |
 |
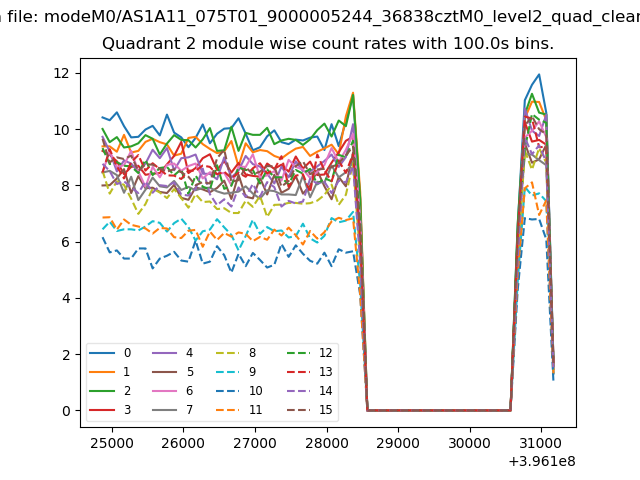
| Module-wise count rates for Quadrant B Data is divided into 100 sec bins |
 |
 |
| Module-wise count rates for Quadrant C Data is divided into 100 sec bins |
 |
 |
| Module-wise count rates for Quadrant D Data is divided into 100 sec bins |
 |
 |
| Parameter | Plot |
|---|---|
| CZT HV Monitor | 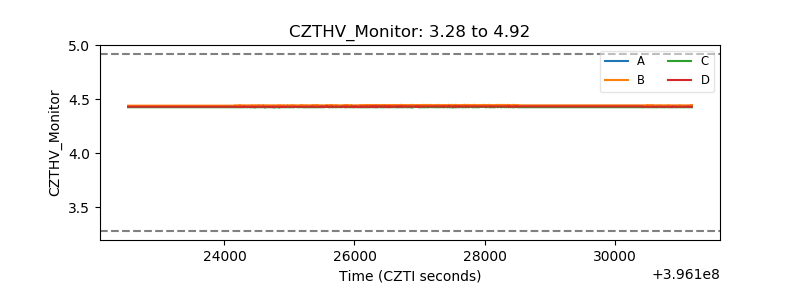 |
| D_VDD | 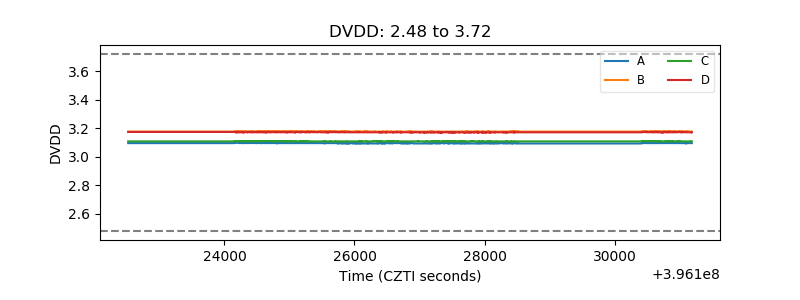 |
| Temperature 1 | 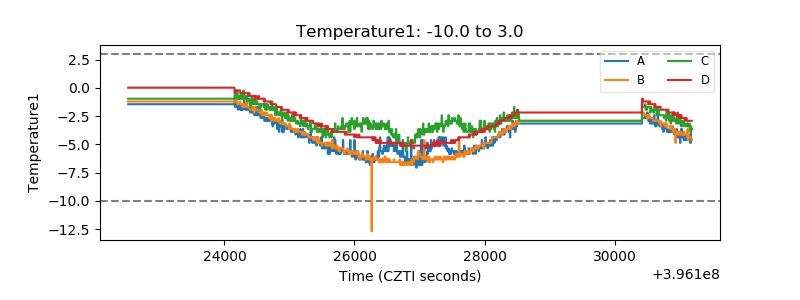 |
| Veto HV Monitor | 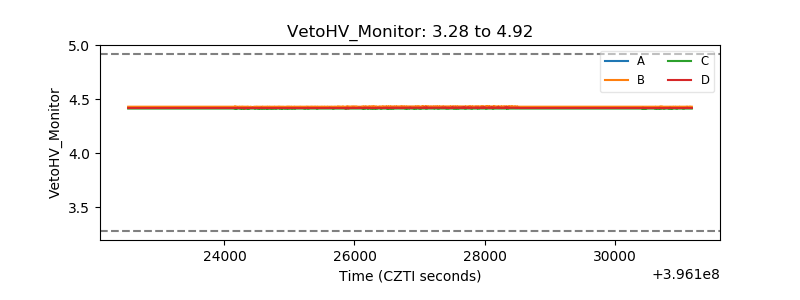 |
| Veto LLD | 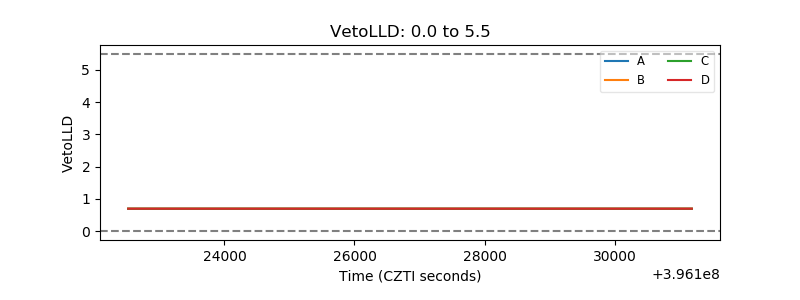 |
| Alpha Counter | 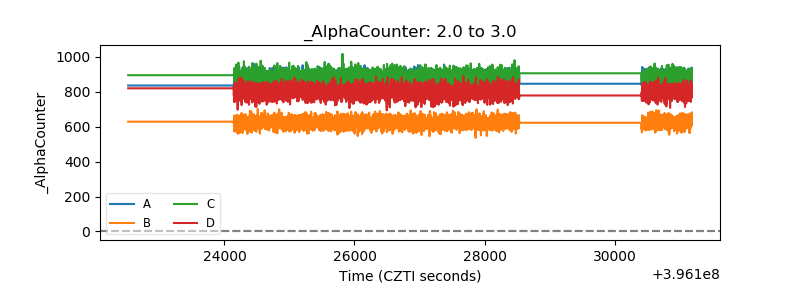 |
| _CPM_Rate | 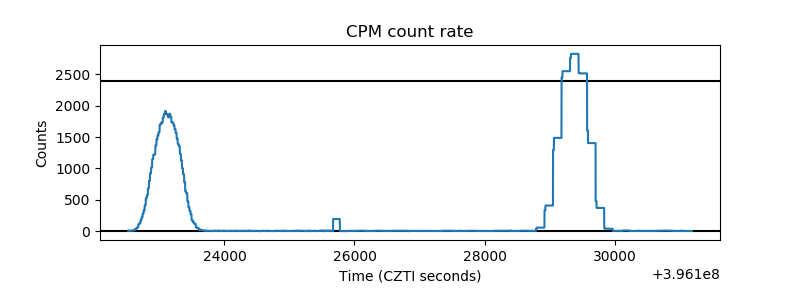 |
| CZT Counter | 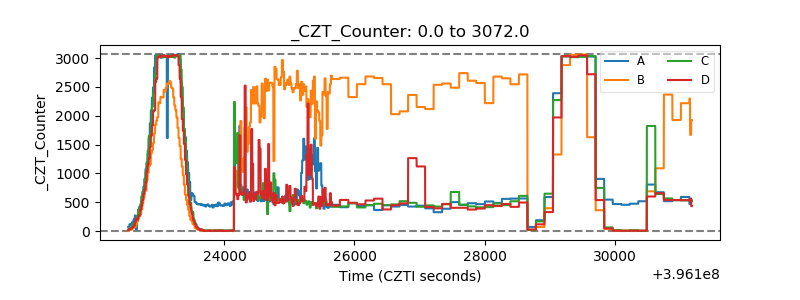 |
| +2.5 Volts monitor | 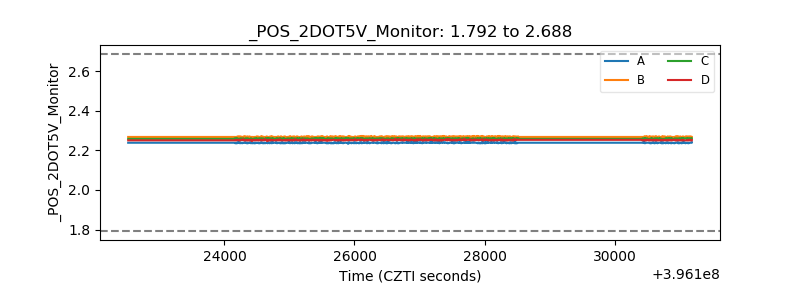 |
| +5 Volts monitor |  |
| _ROLL_ROT | 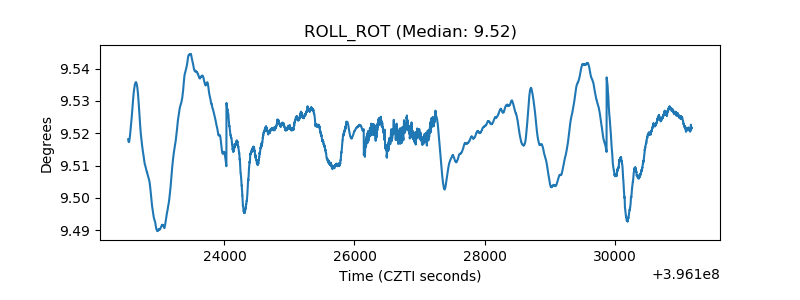 |
| _Roll_DEC | 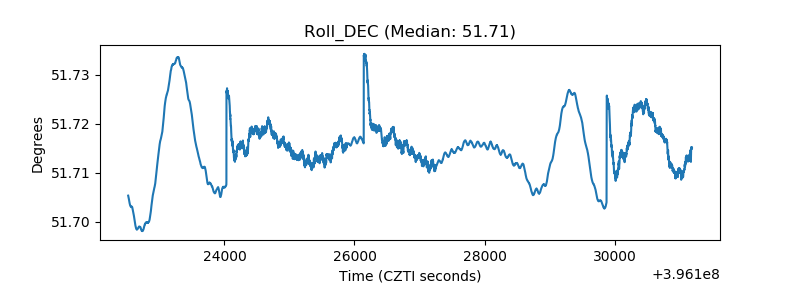 |
| _Roll_RA | 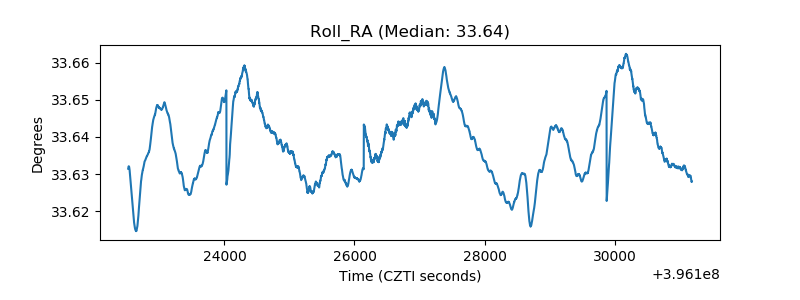 |
| Veto Counter | 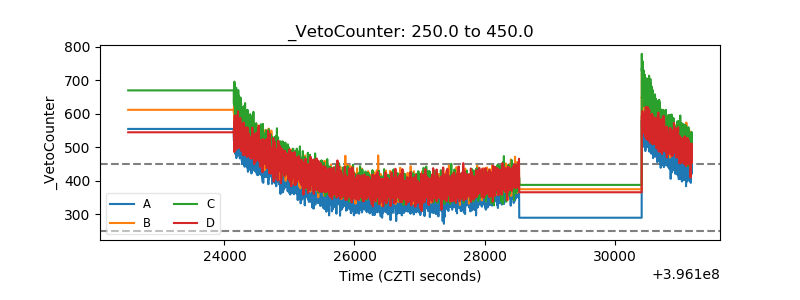 |