| Param | Original file | Final file |
|---|---|---|
| Filename | modeM0/AS1A11_075T01_9000005244_36839cztM0_level2.evt | modeM0/AS1A11_075T01_9000005244_36839cztM0_level2_quad_clean.evt |
| Size (bytes) | 581,872,320 | 92,998,080 |
| Size | 554.9 MB | 88.7 MB |
| Events in quadrant A | 2,601,041 | 635,773 |
| Events in quadrant B | 8,916,582 | 558,830 |
| Events in quadrant C | 2,859,083 | 652,219 |
| Events in quadrant D | 2,902,522 | 614,032 |
| Mode SS | |||
|---|---|---|---|
| Quadrant | BADHDUFLAG | Total packets | Discarded packets |
| A | 0 | 104 | 0 |
| B | 0 | 104 | 0 |
| C | 0 | 104 | 0 |
| D | 0 | 104 | 0 |
| Mode M0 | |||
|---|---|---|---|
| Quadrant | BADHDUFLAG | Total packets | Discarded packets |
| A | 0 | 10926 | 3 |
| B | 0 | 30015 | 2 |
| C | 0 | 11551 | 2 |
| D | 0 | 12025 | 2 |
| Mode M9 | |||
|---|---|---|---|
| Quadrant | BADHDUFLAG | Total packets | Discarded packets |
| A | 0 | 24 | 0 |
| B | 0 | 24 | 0 |
| C | 0 | 24 | 0 |
| D | 0 | 25 | 0 |
| Quadrant | Total seconds | Saturated seconds | Saturation percentage |
|---|---|---|---|
| A | 5055 | 18 | 0.356083% |
| B | 5055 | 2415 | 47.774481% |
| C | 5055 | 88 | 1.740851% |
| D | 5055 | 74 | 1.463897% |
Noise dominated data is calculated using 1-second bins in cleaned event files. If a bin has >2000 counts, and if more than 50% of those come from <1% of pixels, then it is considered to be noise-dominated and hence unusable.
| Quadrant | # 1 sec bins | Bins with >0 counts | Bins with >2000 counts | High rate bins dominated by noise | Noise dominated (total time) | Noise dominated (detector-on time) | Marked lightcurve |
|---|---|---|---|---|---|---|---|
| A | 7058 | 5056 | 5 | 5 | 0.07% | 0.10% |  |
| B | 7058 | 5056 | 2271 | 2271 | 32.18% | 44.92% |  |
| C | 7058 | 5056 | 68 | 68 | 0.96% | 1.34% |  |
| D | 7058 | 5056 | 75 | 75 | 1.06% | 1.48% |  |
Top three noisy pixels from each quadrant. If the there are fewer than three noisy pixels in the level2.evt file, extra rows are filled as -1
| Pixel properties | Quadrant properties | ||||||
|---|---|---|---|---|---|---|---|
| Quadrant | DetID | PixID | Counts | Sigma | Mean | Median | Sigma |
| A | 10 | 83 | 223009 | 1814.3 | 604 | 595 | 122.6 |
| A | 9 | 143 | 17351 | 136.68 | 604 | 595 | 122.6 |
| A | 13 | 6 | 15386 | 120.65 | 604 | 595 | 122.6 |
| B | 12 | 1 | 6149640 | 59620.57 | 554 | 542 | 103.1 |
| B | 5 | 255 | 217814 | 2106.63 | 554 | 542 | 103.1 |
| B | 0 | 221 | 98009 | 945.02 | 554 | 542 | 103.1 |
| C | 0 | 10 | 249021 | 1807.46 | 599 | 605 | 137.4 |
| C | 15 | 214 | 230084 | 1669.68 | 599 | 605 | 137.4 |
| C | 14 | 254 | 37067 | 265.3 | 599 | 605 | 137.4 |
| D | 12 | 217 | 115127 | 797.04 | 594 | 578 | 143.7 |
| D | 12 | 17 | 96755 | 669.21 | 594 | 578 | 143.7 |
| D | 2 | 250 | 69036 | 476.34 | 594 | 578 | 143.7 |
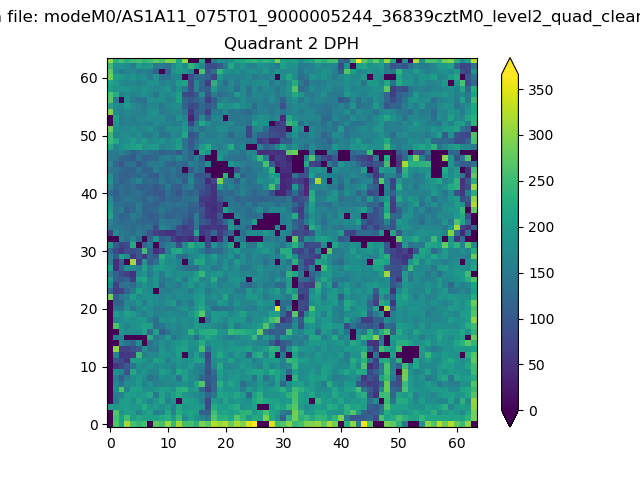
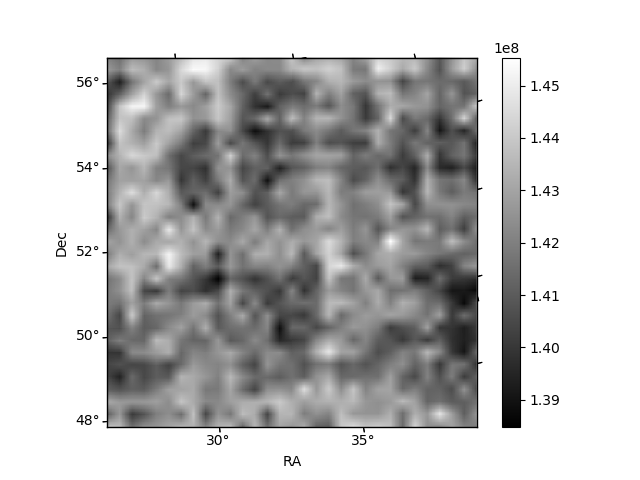
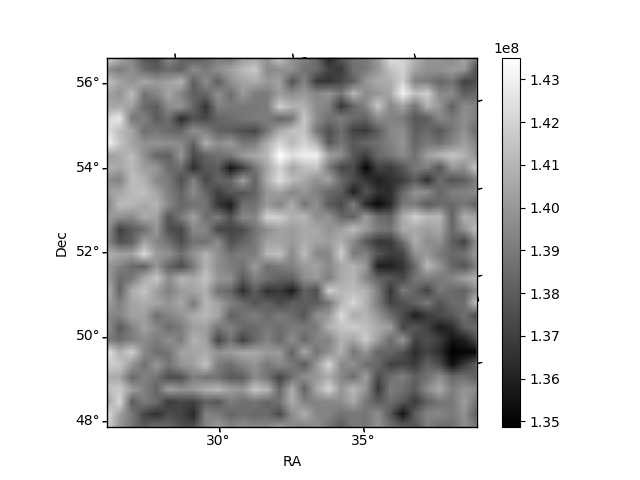
Histogram calculated using DETX and DETY for each event in the final _common_clean file
| Quadrant A | 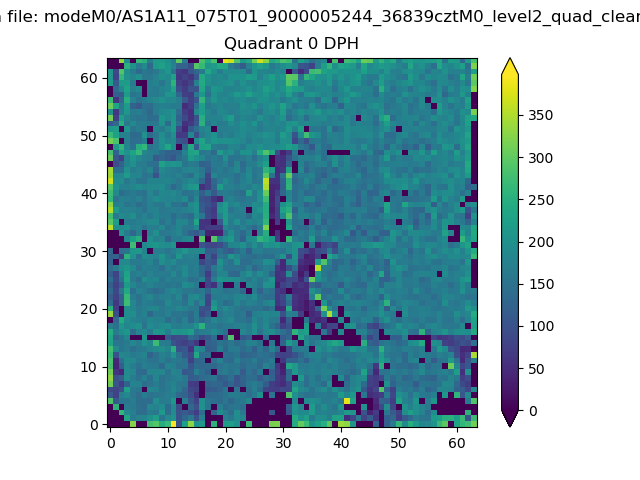 |
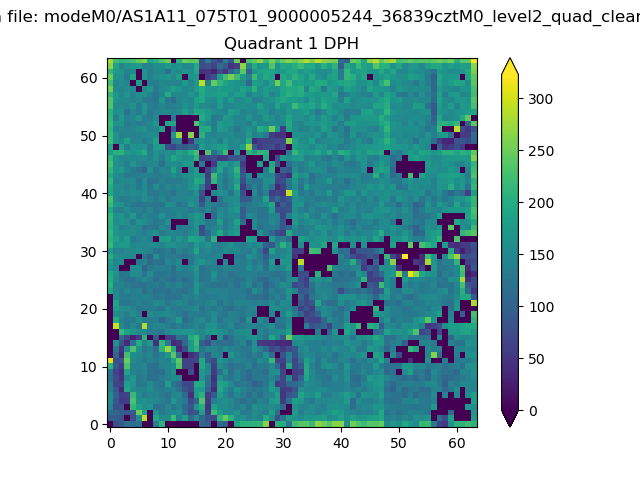 |
Quadrant B |
|---|---|---|---|
| Quadrant D | 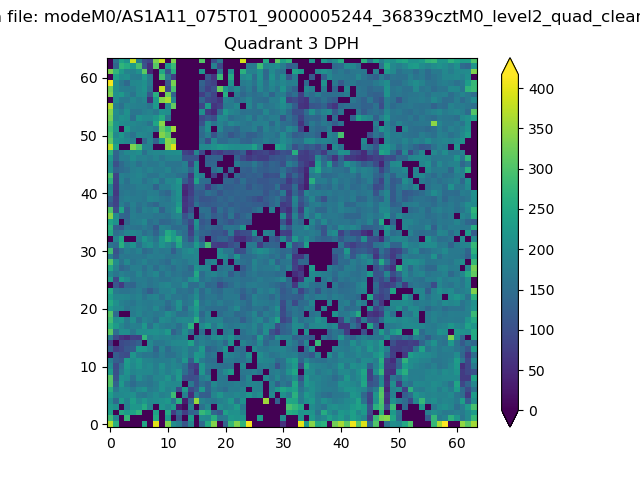 |
 |
Quadrant C |
| Plot type | Count rate plots | Images |
|---|---|---|
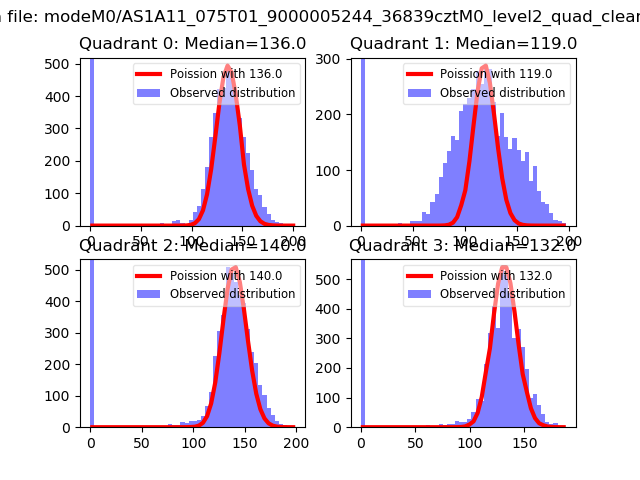
| Comparison with Poisson distribution Blue bars denote a histogram of data divided into 1 sec bins. Red curve is a Poisson curve with rate = median count rate of data. |
 |
 |
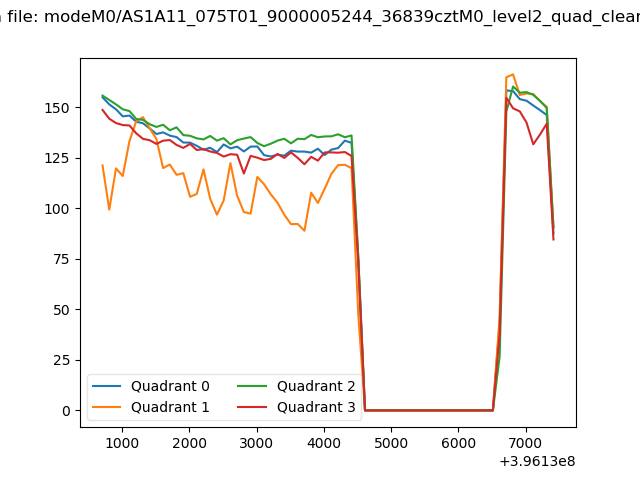
| Quadrant-wise count rates Data is divided into 100 sec bins |
 |
|
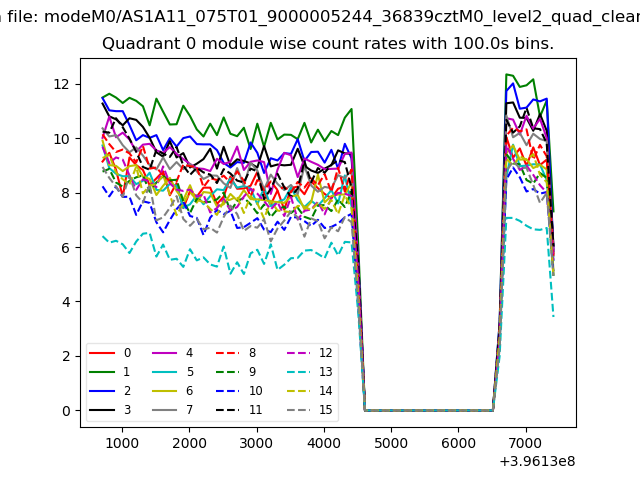
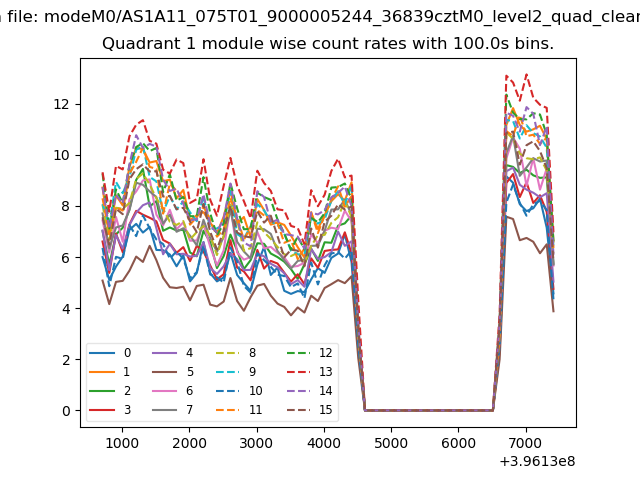
| Module-wise count rates for Quadrant A Data is divided into 100 sec bins |
 |
 |
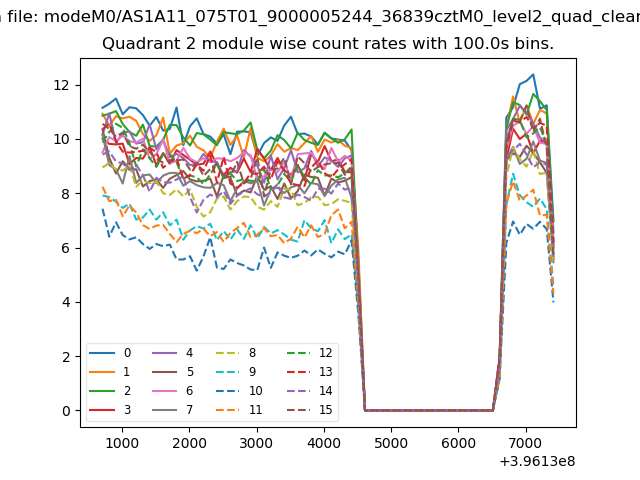
| Module-wise count rates for Quadrant B Data is divided into 100 sec bins |
 |
 |
| Module-wise count rates for Quadrant C Data is divided into 100 sec bins |
 |
 |
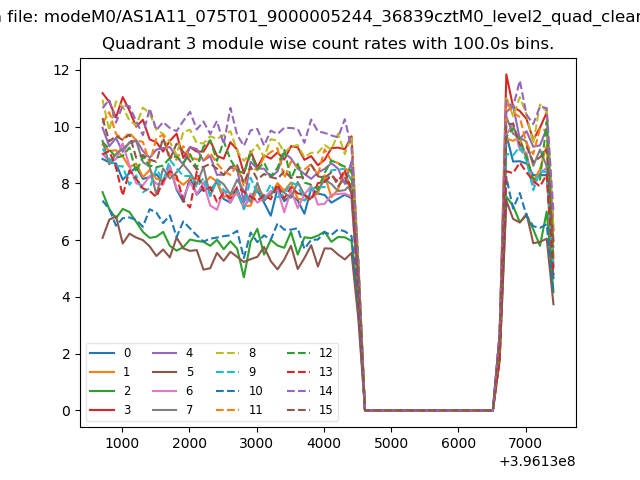
| Module-wise count rates for Quadrant D Data is divided into 100 sec bins |
 |
 |
| Parameter | Plot |
|---|---|
| CZT HV Monitor | 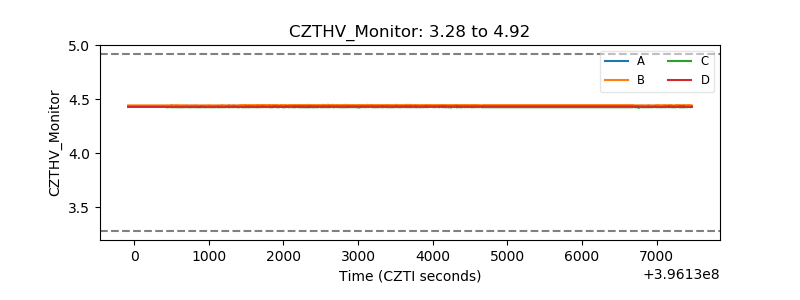 |
| D_VDD | 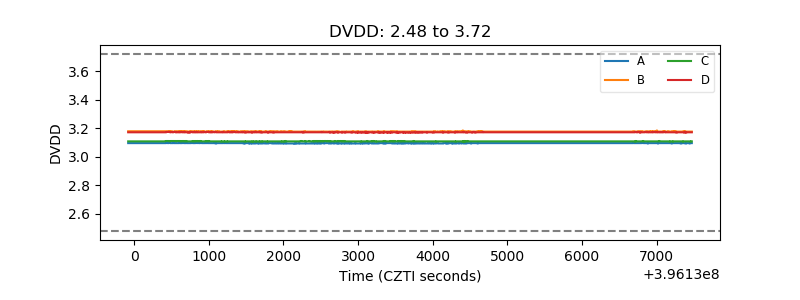 |
| Temperature 1 | 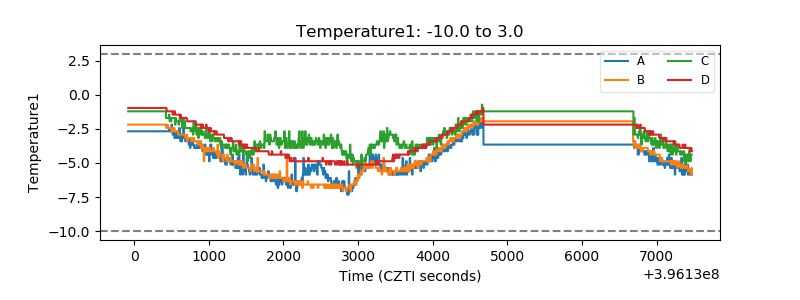 |
| Veto HV Monitor |  |
| Veto LLD | 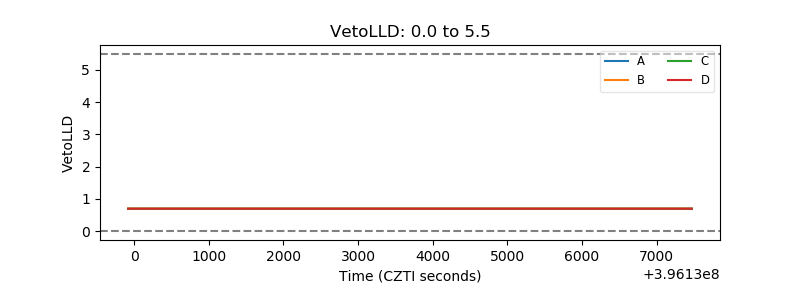 |
| Alpha Counter | 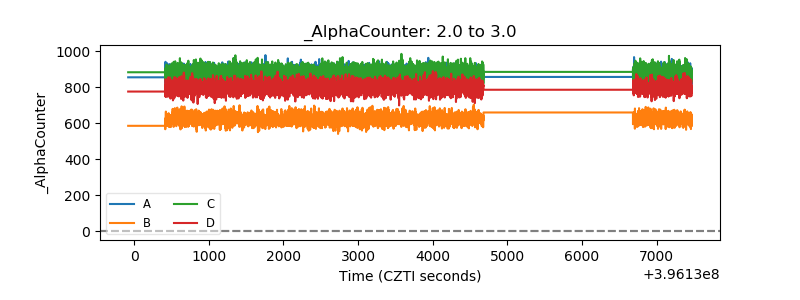 |
| _CPM_Rate | 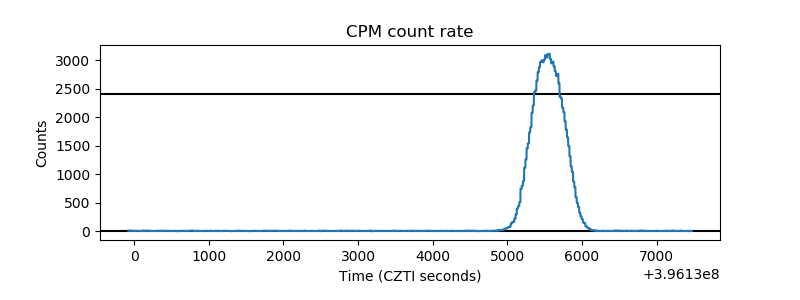 |
| CZT Counter | 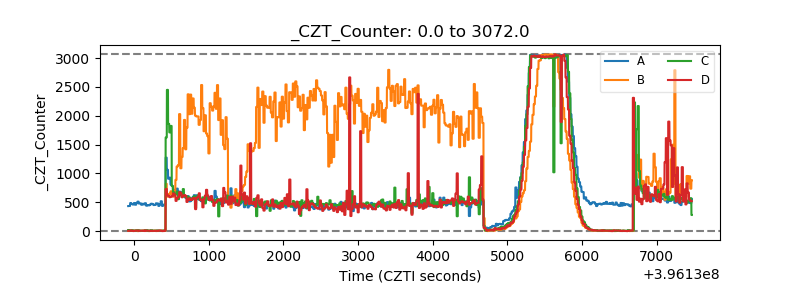 |
| +2.5 Volts monitor | 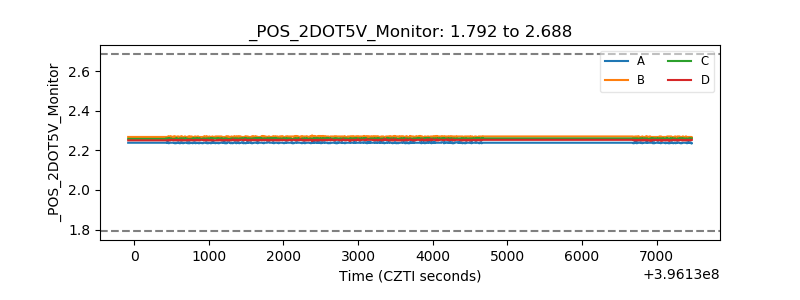 |
| +5 Volts monitor |  |
| _ROLL_ROT | 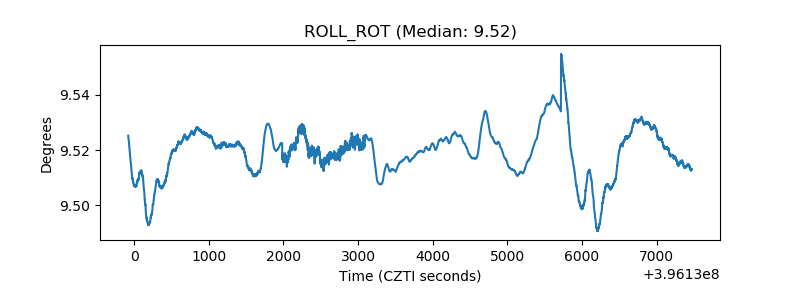 |
| _Roll_DEC | 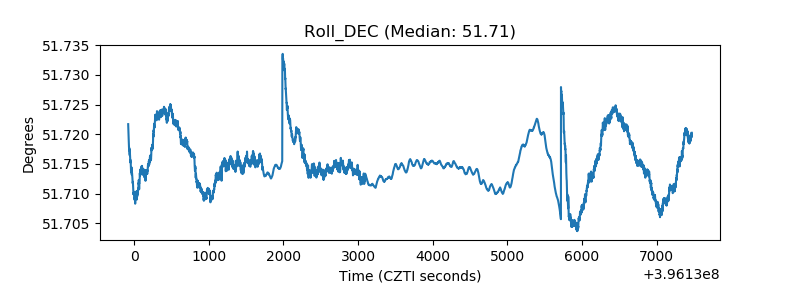 |
| _Roll_RA | 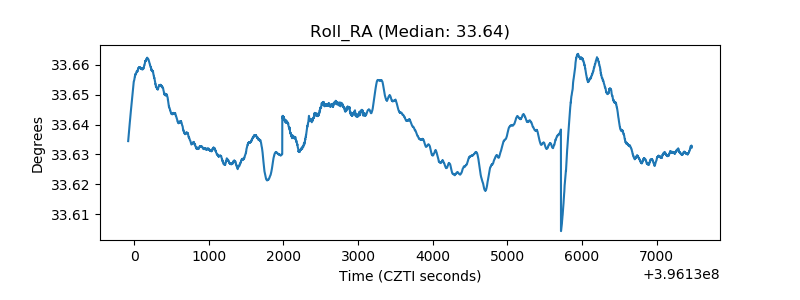 |
| Veto Counter | 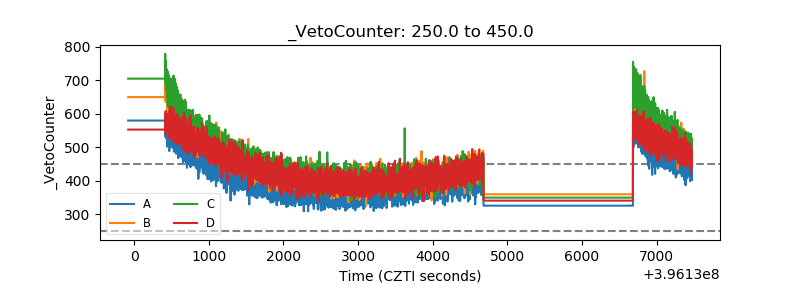 |