| Param | Original file | Final file |
|---|---|---|
| Filename | modeM0/AS1A11_075T01_9000005244_36840cztM0_level2.evt | modeM0/AS1A11_075T01_9000005244_36840cztM0_level2_quad_clean.evt |
| Size (bytes) | 551,183,040 | 93,248,640 |
| Size | 525.6 MB | 88.9 MB |
| Events in quadrant A | 2,619,576 | 627,361 |
| Events in quadrant B | 6,299,731 | 618,147 |
| Events in quadrant C | 3,008,731 | 643,101 |
| Events in quadrant D | 4,417,462 | 575,322 |
| Mode SS | |||
|---|---|---|---|
| Quadrant | BADHDUFLAG | Total packets | Discarded packets |
| A | 0 | 108 | 0 |
| B | 0 | 108 | 0 |
| C | 0 | 108 | 0 |
| D | 0 | 108 | 0 |
| Mode M0 | |||
|---|---|---|---|
| Quadrant | BADHDUFLAG | Total packets | Discarded packets |
| A | 0 | 11004 | 3 |
| B | 0 | 22262 | 2 |
| C | 0 | 11927 | 2 |
| D | 0 | 16545 | 2 |
| Mode M9 | |||
|---|---|---|---|
| Quadrant | BADHDUFLAG | Total packets | Discarded packets |
| A | 0 | 41 | 0 |
| B | 0 | 41 | 0 |
| C | 0 | 41 | 0 |
| D | 0 | 41 | 0 |
| Quadrant | Total seconds | Saturated seconds | Saturation percentage |
|---|---|---|---|
| A | 5131 | 10 | 0.194894% |
| B | 5131 | 490 | 9.549795% |
| C | 5131 | 67 | 1.305788% |
| D | 5131 | 498 | 9.705710% |
Noise dominated data is calculated using 1-second bins in cleaned event files. If a bin has >2000 counts, and if more than 50% of those come from <1% of pixels, then it is considered to be noise-dominated and hence unusable.
| Quadrant | # 1 sec bins | Bins with >0 counts | Bins with >2000 counts | High rate bins dominated by noise | Noise dominated (total time) | Noise dominated (detector-on time) | Marked lightcurve |
|---|---|---|---|---|---|---|---|
| A | 9228 | 5133 | 8 | 8 | 0.09% | 0.16% | 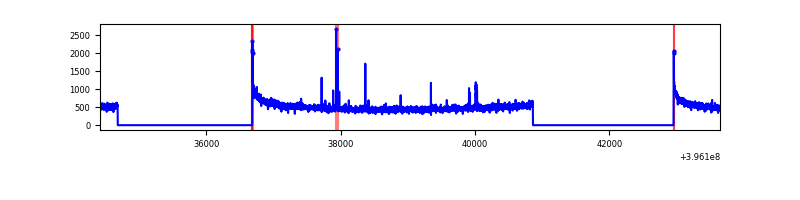 |
| B | 9228 | 5133 | 413 | 413 | 4.48% | 8.05% | 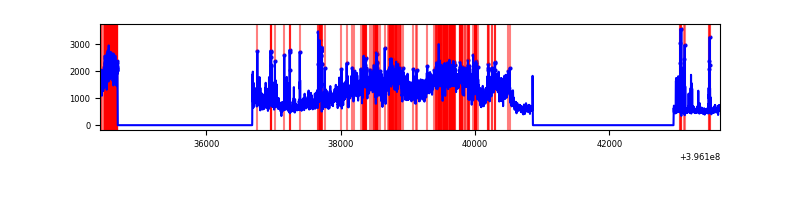 |
| C | 9228 | 5133 | 55 | 55 | 0.60% | 1.07% | 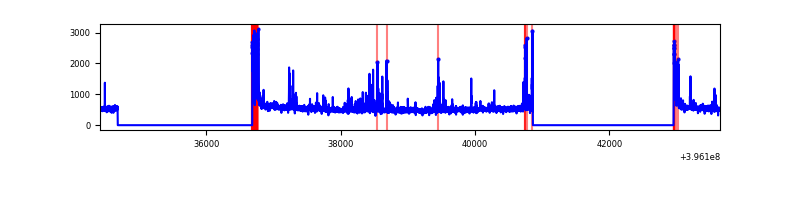 |
| D | 9228 | 5133 | 509 | 509 | 5.52% | 9.92% | 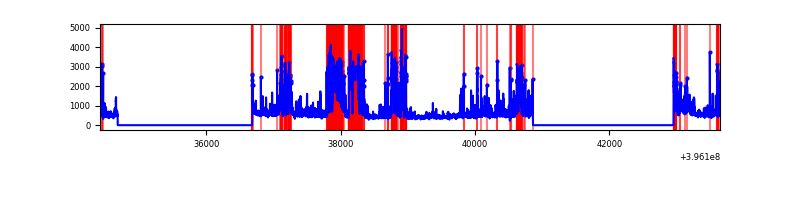 |
Top three noisy pixels from each quadrant. If the there are fewer than three noisy pixels in the level2.evt file, extra rows are filled as -1
| Pixel properties | Quadrant properties | ||||||
|---|---|---|---|---|---|---|---|
| Quadrant | DetID | PixID | Counts | Sigma | Mean | Median | Sigma |
| A | 10 | 83 | 216746 | 1767.29 | 608 | 597 | 122.3 |
| A | 9 | 143 | 28670 | 229.53 | 608 | 597 | 122.3 |
| A | 13 | 6 | 15372 | 120.8 | 608 | 597 | 122.3 |
| B | 12 | 1 | 3387627 | 29997.12 | 601 | 587 | 112.9 |
| B | 5 | 255 | 139036 | 1226.17 | 601 | 587 | 112.9 |
| B | 5 | 172 | 127958 | 1128.05 | 601 | 587 | 112.9 |
| C | 0 | 10 | 335635 | 2424.54 | 602 | 608 | 138.2 |
| C | 15 | 214 | 235096 | 1696.95 | 602 | 608 | 138.2 |
| C | 14 | 254 | 81508 | 585.46 | 602 | 608 | 138.2 |
| D | 12 | 17 | 1161692 | 8304.13 | 575 | 560 | 139.8 |
| D | 12 | 233 | 212716 | 1517.29 | 575 | 560 | 139.8 |
| D | 12 | 217 | 211307 | 1507.21 | 575 | 560 | 139.8 |
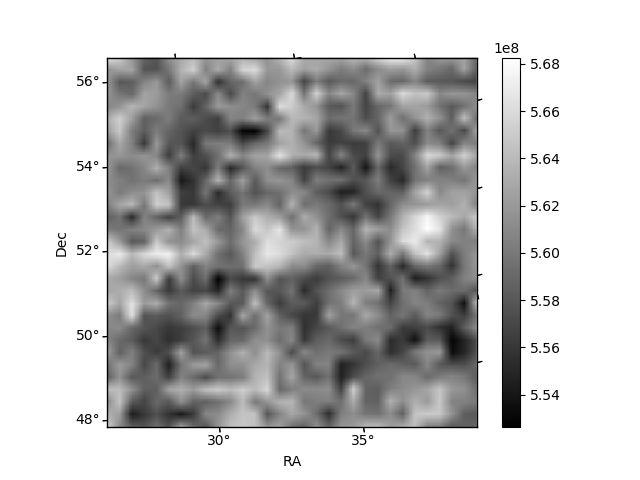
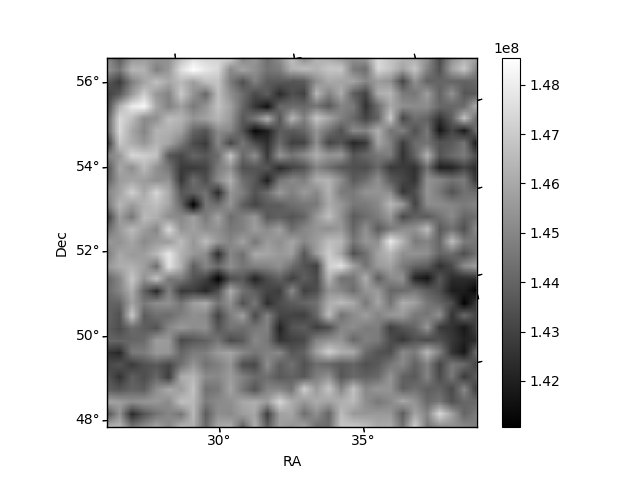
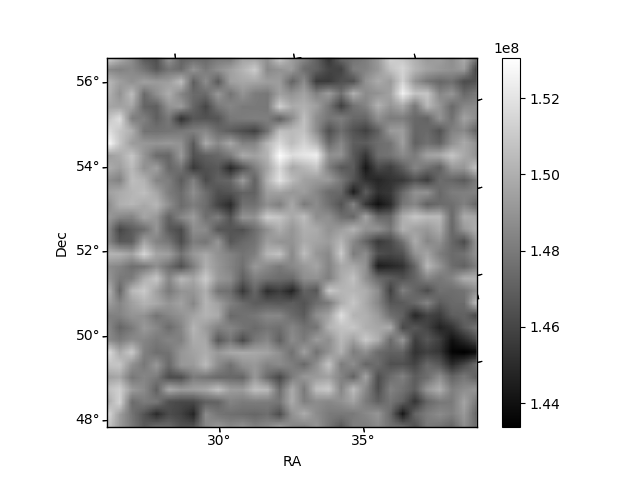
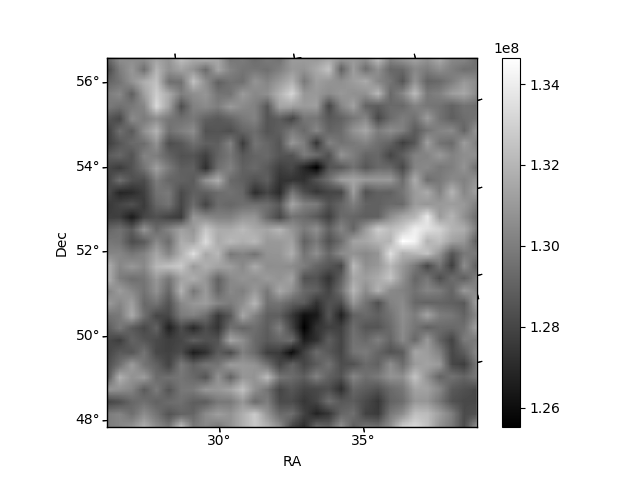
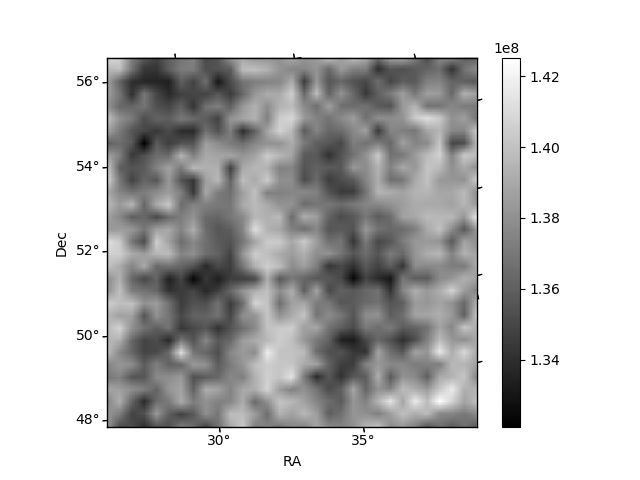
Histogram calculated using DETX and DETY for each event in the final _common_clean file
| Quadrant A | 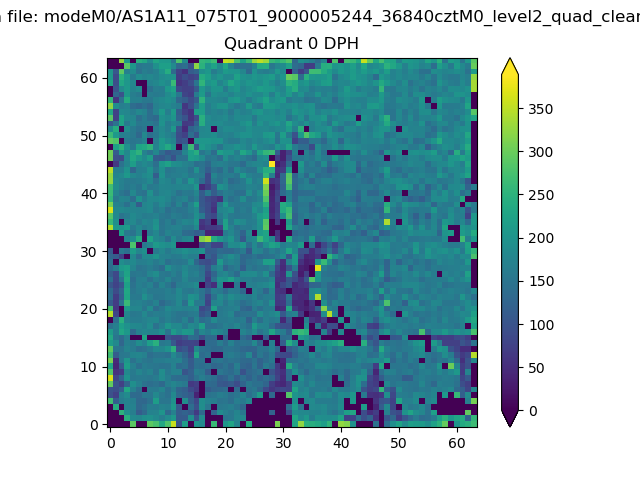 |
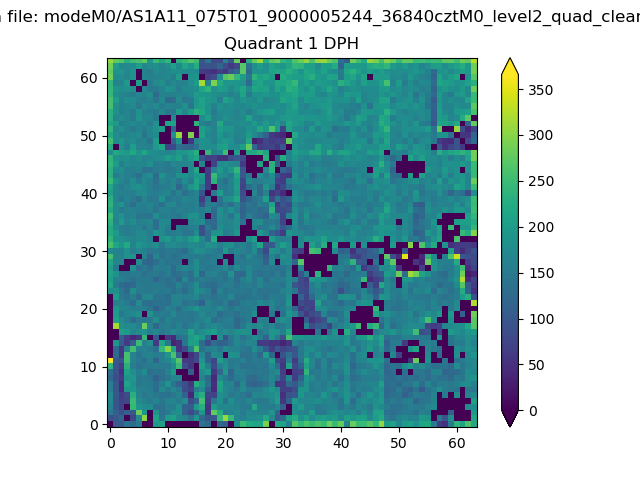 |
Quadrant B |
|---|---|---|---|
| Quadrant D | 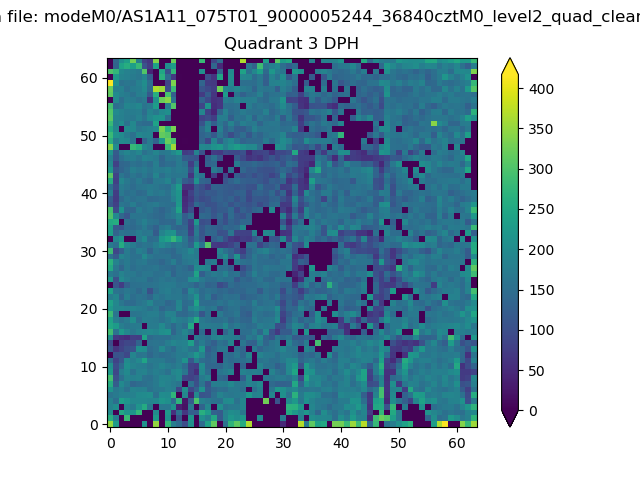 |
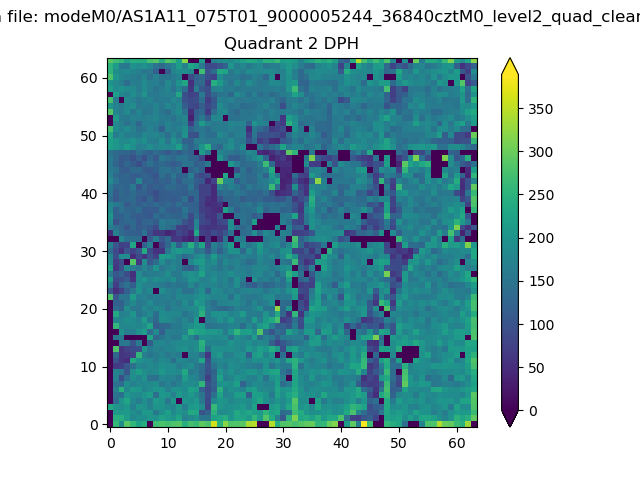 |
Quadrant C |
| Plot type | Count rate plots | Images |
|---|---|---|
| Comparison with Poisson distribution Blue bars denote a histogram of data divided into 1 sec bins. Red curve is a Poisson curve with rate = median count rate of data. |
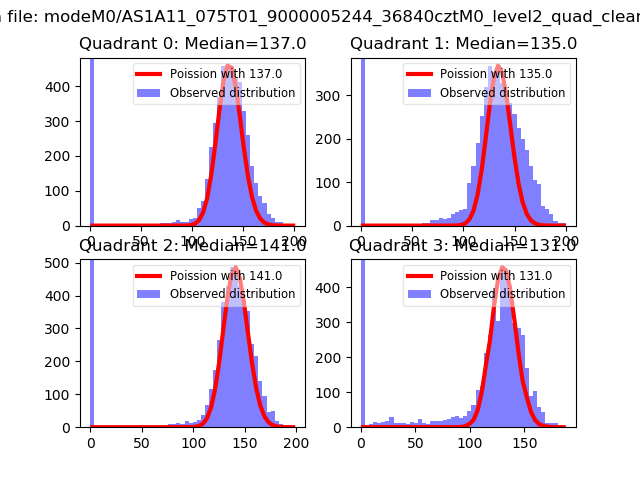 |
 |
| Quadrant-wise count rates Data is divided into 100 sec bins |
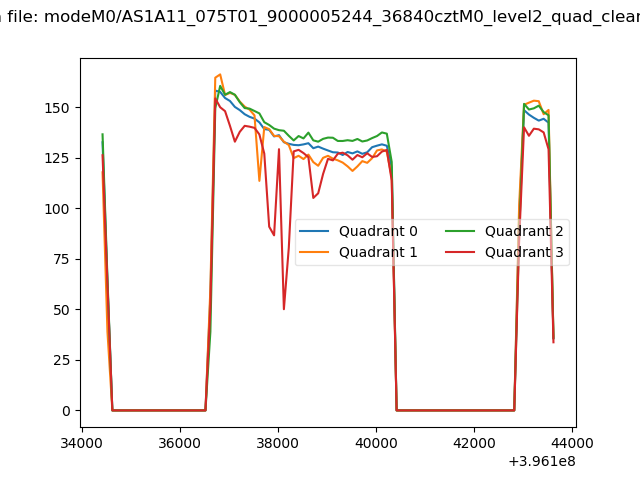 |
|
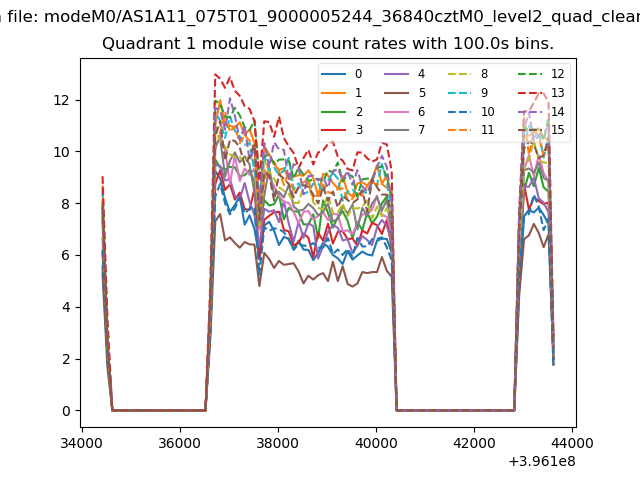
| Module-wise count rates for Quadrant A Data is divided into 100 sec bins |
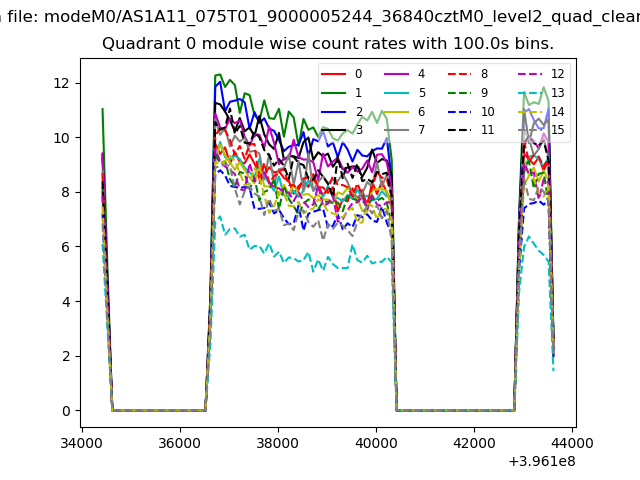 |
 |
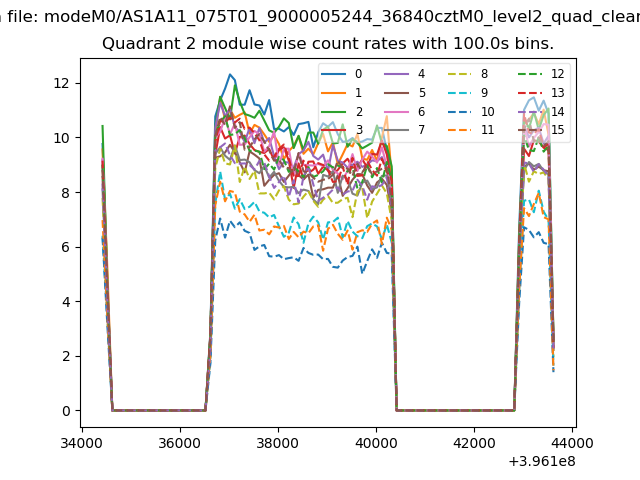
| Module-wise count rates for Quadrant B Data is divided into 100 sec bins |
 |
 |
| Module-wise count rates for Quadrant C Data is divided into 100 sec bins |
 |
 |
| Module-wise count rates for Quadrant D Data is divided into 100 sec bins |
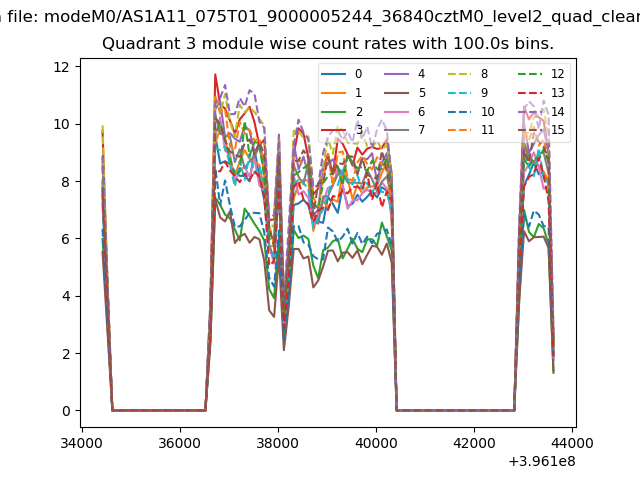 |
 |
| Parameter | Plot |
|---|---|
| CZT HV Monitor | 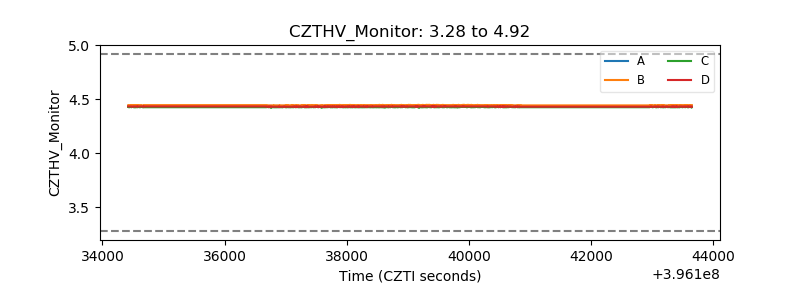 |
| D_VDD | 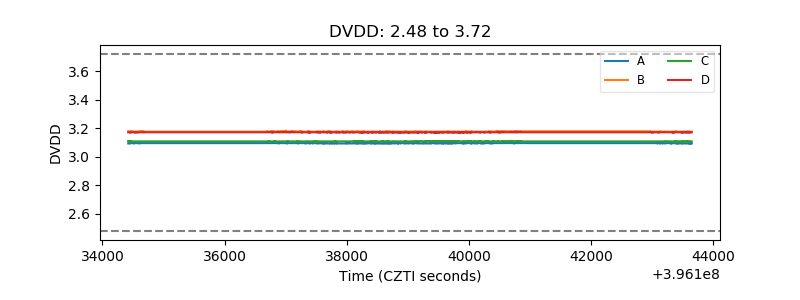 |
| Temperature 1 | 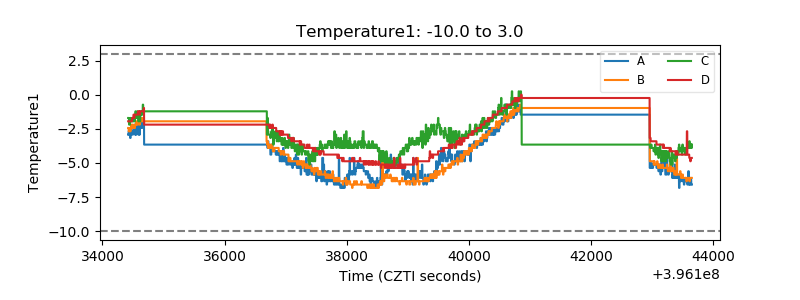 |
| Veto HV Monitor | 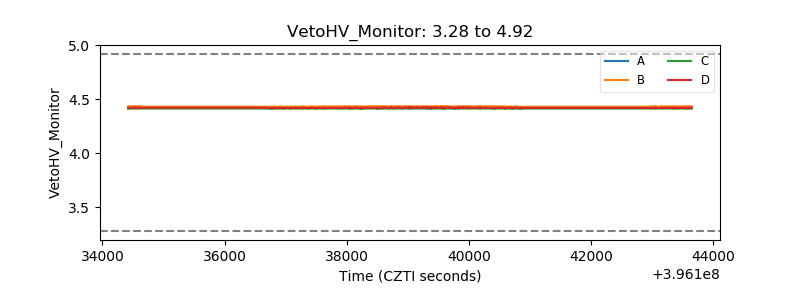 |
| Veto LLD | 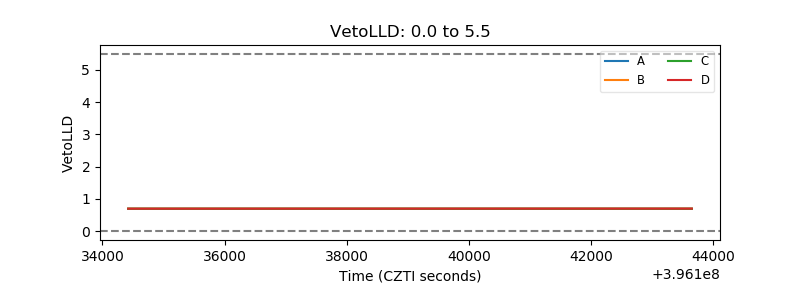 |
| Alpha Counter | 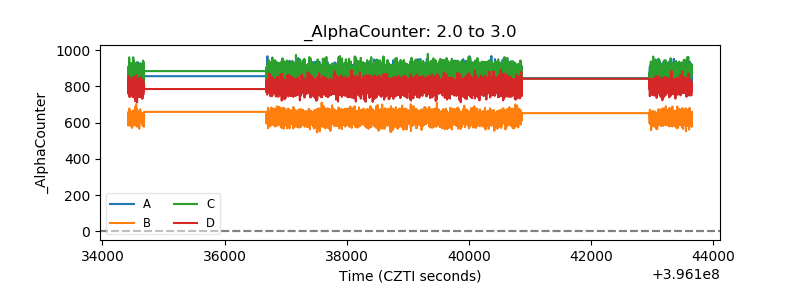 |
| _CPM_Rate | 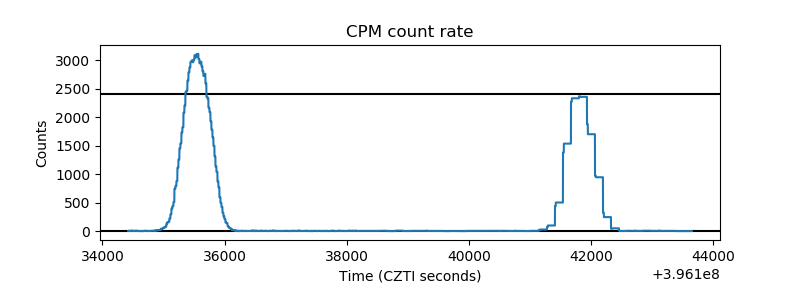 |
| CZT Counter | 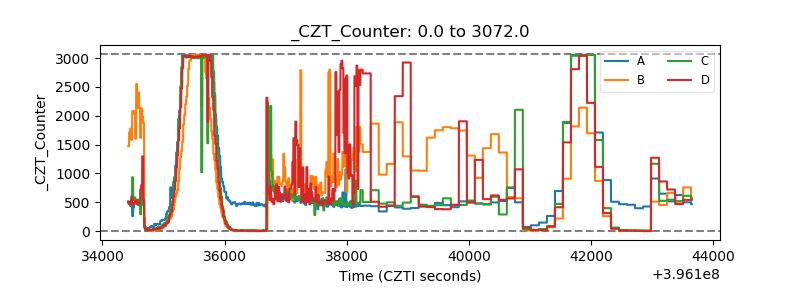 |
| +2.5 Volts monitor |  |
| +5 Volts monitor |  |
| _ROLL_ROT | 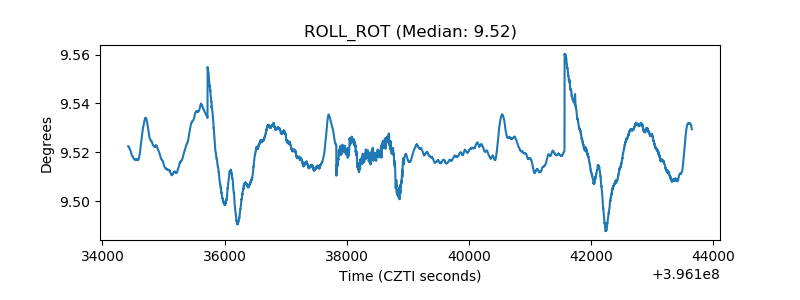 |
| _Roll_DEC |  |
| _Roll_RA | 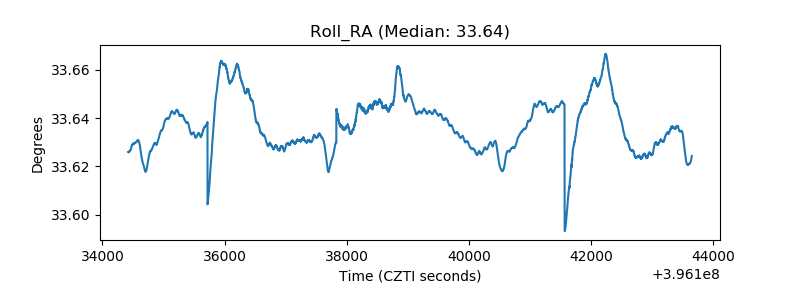 |
| Veto Counter | 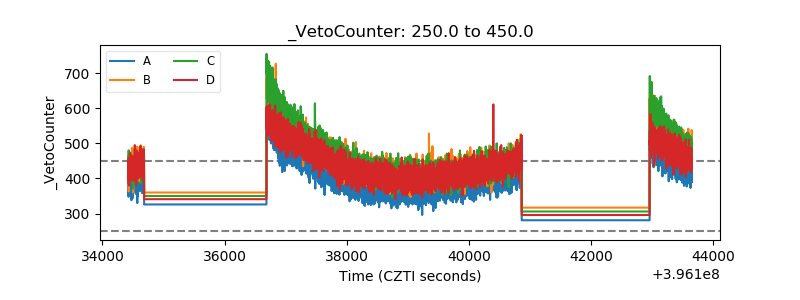 |