| Param | Original file | Final file |
|---|---|---|
| Filename | modeM0/AS1A11_075T01_9000005244_36841cztM0_level2.evt | modeM0/AS1A11_075T01_9000005244_36841cztM0_level2_quad_clean.evt |
| Size (bytes) | 479,424,960 | 83,073,600 |
| Size | 457.2 MB | 79.2 MB |
| Events in quadrant A | 2,509,161 | 541,914 |
| Events in quadrant B | 5,464,898 | 541,301 |
| Events in quadrant C | 2,868,382 | 555,734 |
| Events in quadrant D | 3,334,791 | 522,523 |
| Mode SS | |||
|---|---|---|---|
| Quadrant | BADHDUFLAG | Total packets | Discarded packets |
| A | 0 | 104 | 0 |
| B | 0 | 104 | 0 |
| C | 0 | 104 | 0 |
| D | 0 | 104 | 0 |
| Mode M0 | |||
|---|---|---|---|
| Quadrant | BADHDUFLAG | Total packets | Discarded packets |
| A | 0 | 10723 | 3 |
| B | 0 | 19704 | 2 |
| C | 0 | 11546 | 2 |
| D | 0 | 13354 | 2 |
| Mode M9 | |||
|---|---|---|---|
| Quadrant | BADHDUFLAG | Total packets | Discarded packets |
| A | 0 | 43 | 0 |
| B | 0 | 43 | 0 |
| C | 0 | 43 | 0 |
| D | 0 | 43 | 0 |
| Quadrant | Total seconds | Saturated seconds | Saturation percentage |
|---|---|---|---|
| A | 5055 | 7 | 0.138477% |
| B | 5055 | 426 | 8.427300% |
| C | 5055 | 93 | 1.839763% |
| D | 5055 | 108 | 2.136499% |
Noise dominated data is calculated using 1-second bins in cleaned event files. If a bin has >2000 counts, and if more than 50% of those come from <1% of pixels, then it is considered to be noise-dominated and hence unusable.
| Quadrant | # 1 sec bins | Bins with >0 counts | Bins with >2000 counts | High rate bins dominated by noise | Noise dominated (total time) | Noise dominated (detector-on time) | Marked lightcurve |
|---|---|---|---|---|---|---|---|
| A | 9272 | 5057 | 4 | 4 | 0.04% | 0.08% | 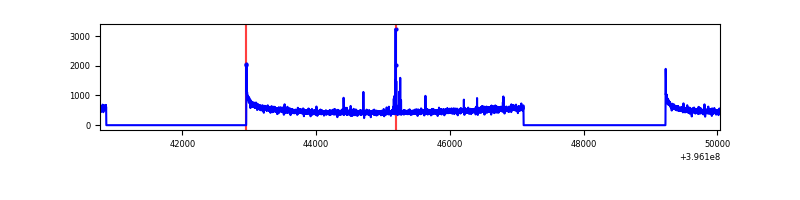 |
| B | 9272 | 5057 | 275 | 275 | 2.97% | 5.44% | 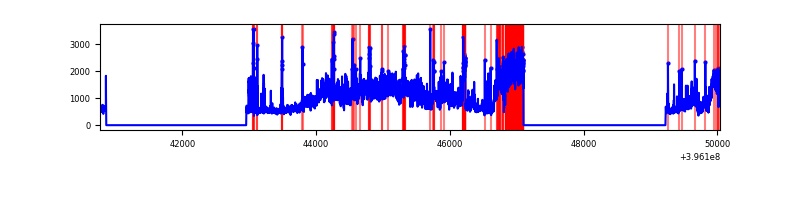 |
| C | 9272 | 5057 | 75 | 75 | 0.81% | 1.48% | 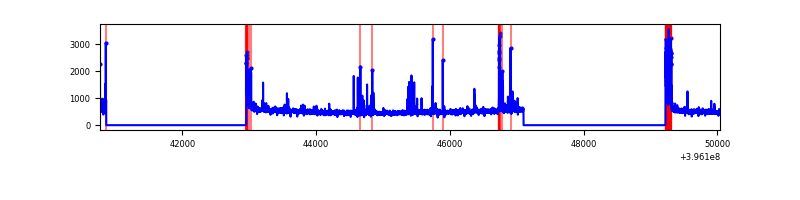 |
| D | 9272 | 5057 | 99 | 99 | 1.07% | 1.96% | 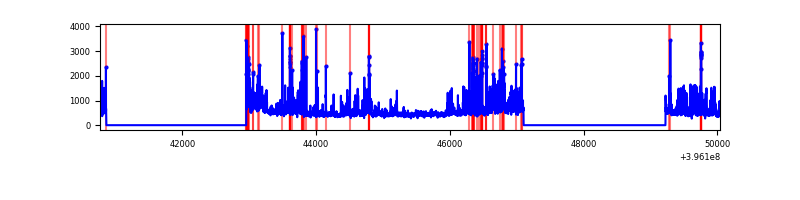 |
Top three noisy pixels from each quadrant. If the there are fewer than three noisy pixels in the level2.evt file, extra rows are filled as -1
| Pixel properties | Quadrant properties | ||||||
|---|---|---|---|---|---|---|---|
| Quadrant | DetID | PixID | Counts | Sigma | Mean | Median | Sigma |
| A | 10 | 83 | 214562 | 1824.07 | 581 | 570 | 117.3 |
| A | 13 | 6 | 14952 | 122.59 | 581 | 570 | 117.3 |
| A | 9 | 143 | 13857 | 113.26 | 581 | 570 | 117.3 |
| B | 12 | 1 | 2533917 | 23713.08 | 572 | 559 | 106.8 |
| B | 0 | 213 | 177242 | 1653.81 | 572 | 559 | 106.8 |
| B | 5 | 172 | 167552 | 1563.11 | 572 | 559 | 106.8 |
| C | 15 | 214 | 230580 | 1726.34 | 572 | 576 | 133.2 |
| C | 0 | 10 | 227943 | 1706.54 | 572 | 576 | 133.2 |
| C | 14 | 254 | 169902 | 1270.91 | 572 | 576 | 133.2 |
| D | 1 | 20 | 246670 | 1806.47 | 562 | 548 | 136.2 |
| D | 2 | 250 | 235723 | 1726.13 | 562 | 548 | 136.2 |
| D | 12 | 233 | 156780 | 1146.7 | 562 | 548 | 136.2 |
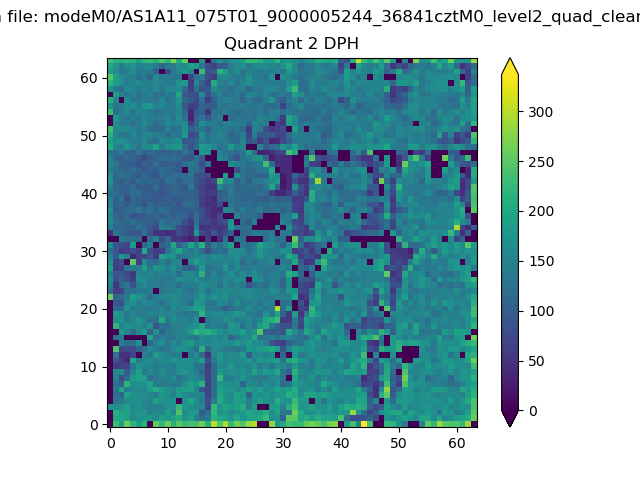
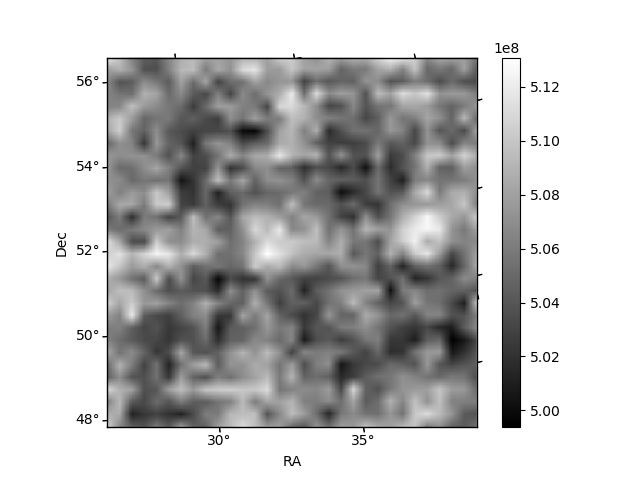
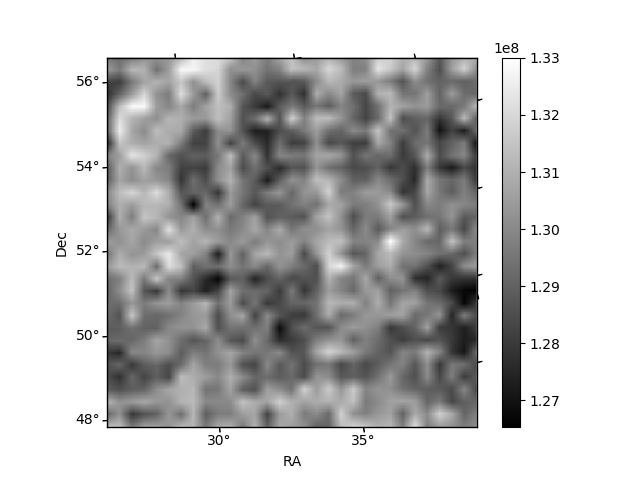
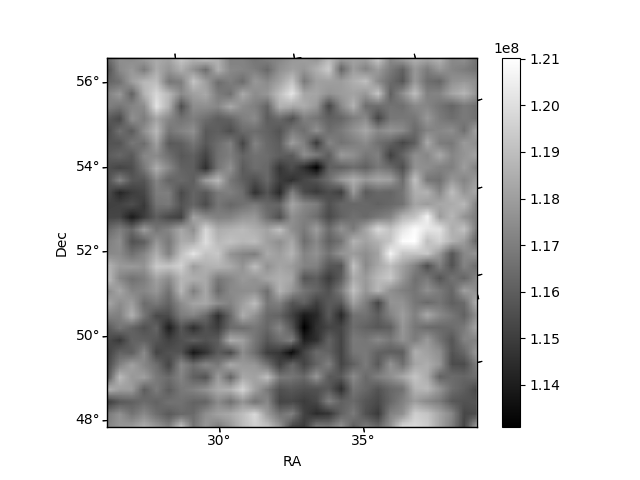
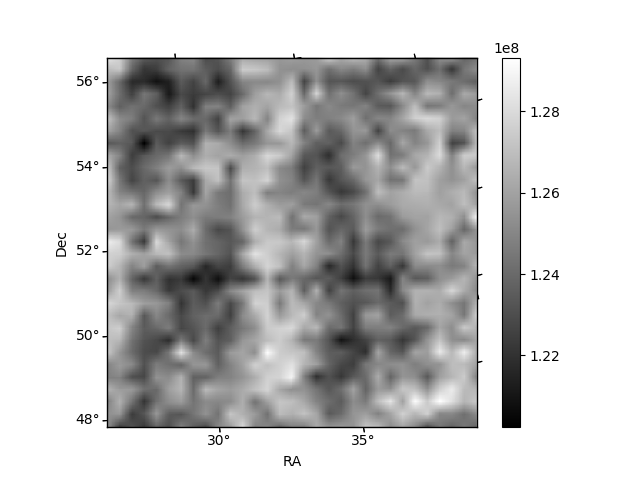
Histogram calculated using DETX and DETY for each event in the final _common_clean file
| Quadrant A | 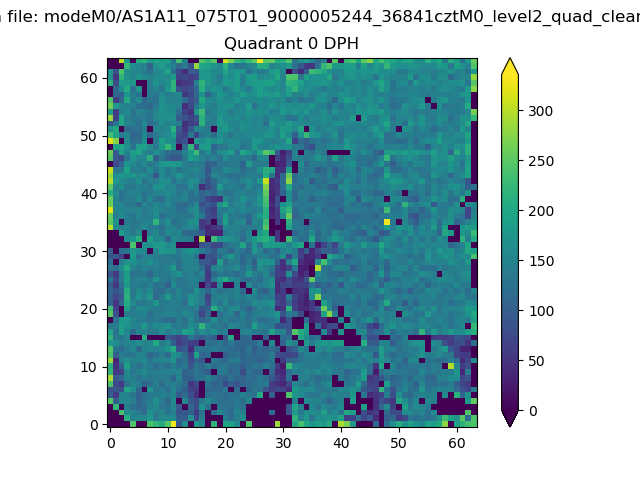 |
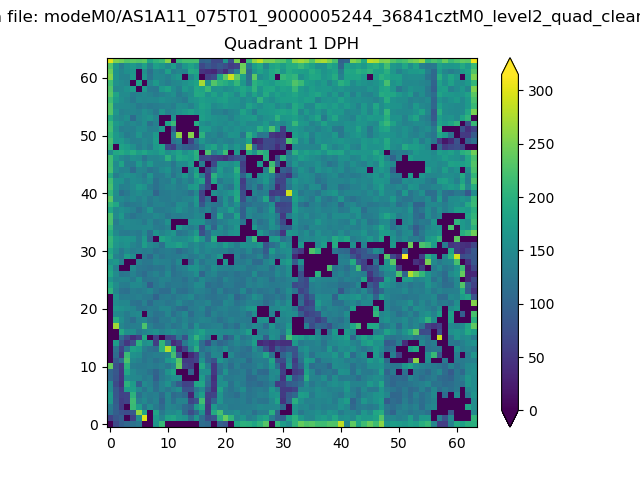 |
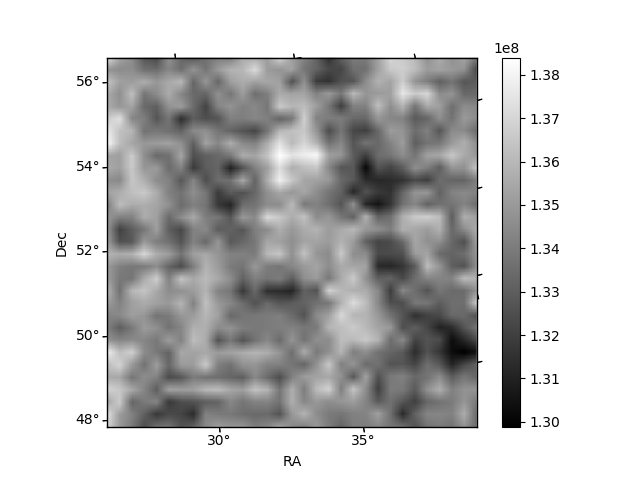
Quadrant B |
|---|---|---|---|
| Quadrant D | 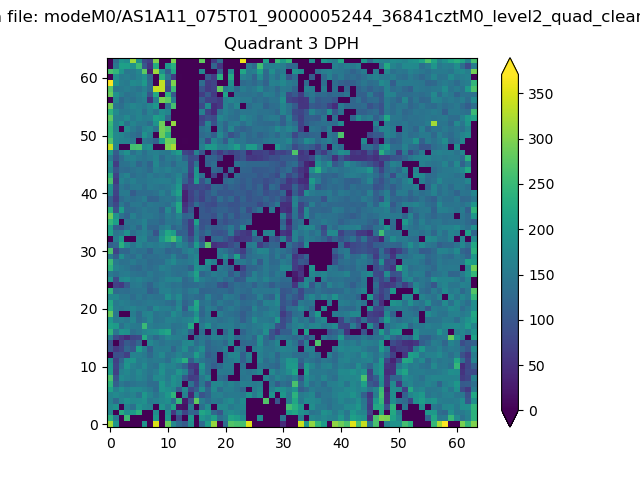 |
 |
Quadrant C |
| Plot type | Count rate plots | Images |
|---|---|---|
| Comparison with Poisson distribution Blue bars denote a histogram of data divided into 1 sec bins. Red curve is a Poisson curve with rate = median count rate of data. |
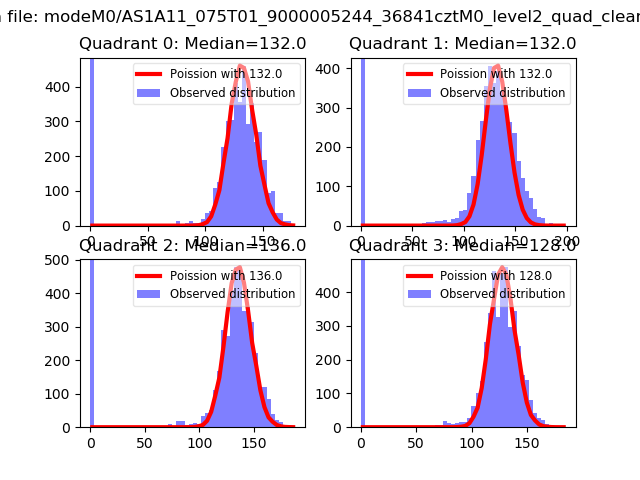 |
 |
| Quadrant-wise count rates Data is divided into 100 sec bins |
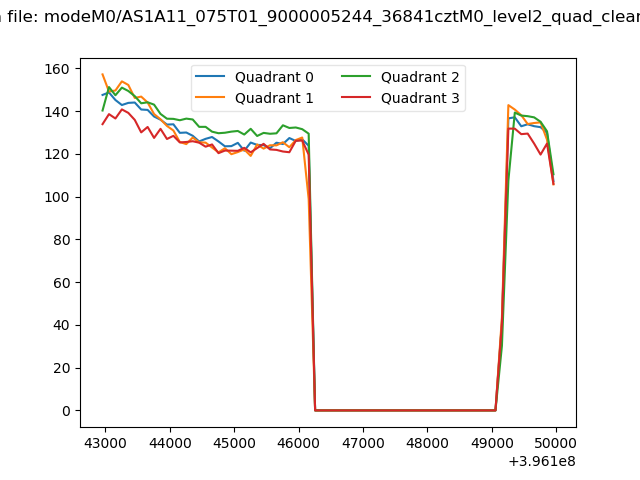 |
|
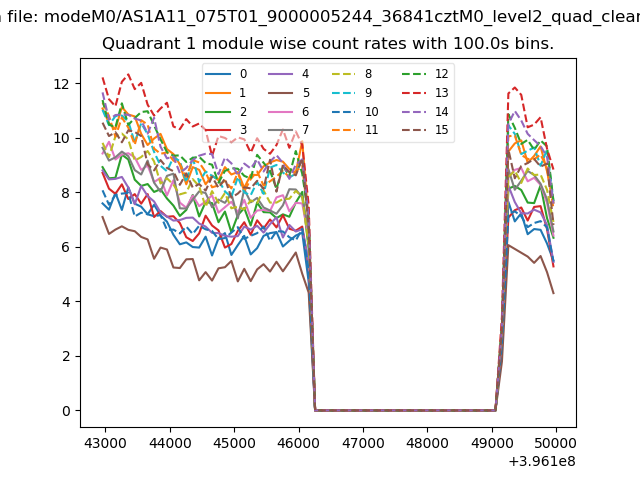
| Module-wise count rates for Quadrant A Data is divided into 100 sec bins |
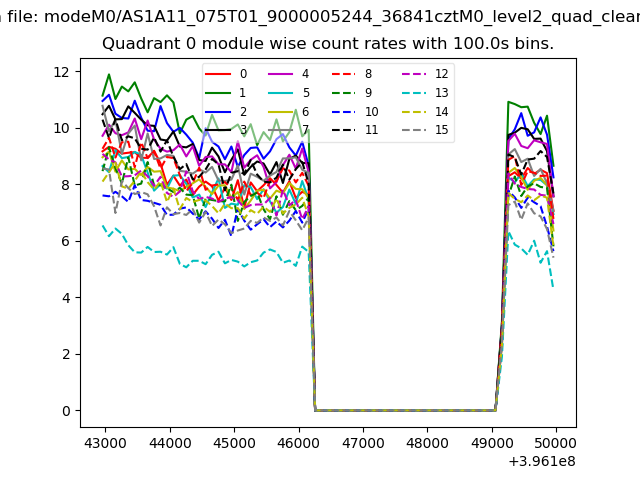 |
 |
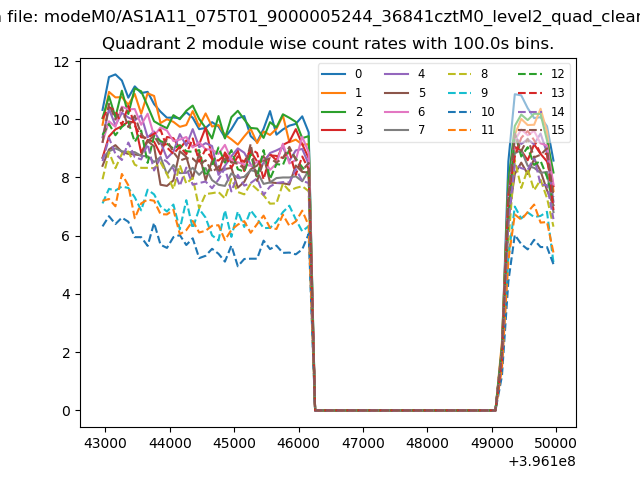
| Module-wise count rates for Quadrant B Data is divided into 100 sec bins |
 |
 |
| Module-wise count rates for Quadrant C Data is divided into 100 sec bins |
 |
 |
| Module-wise count rates for Quadrant D Data is divided into 100 sec bins |
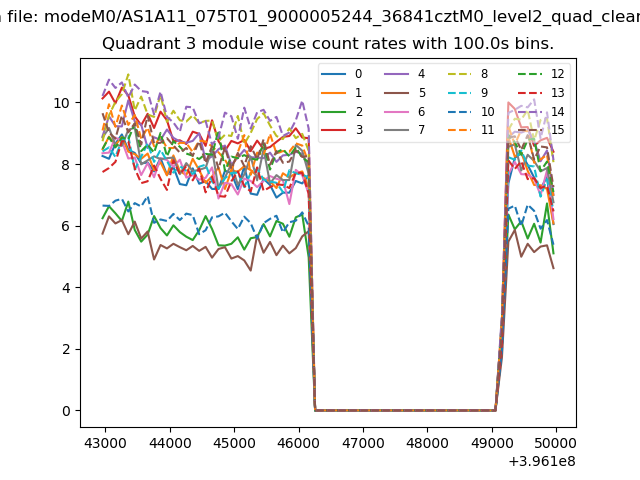 |
 |
| Parameter | Plot |
|---|---|
| CZT HV Monitor | 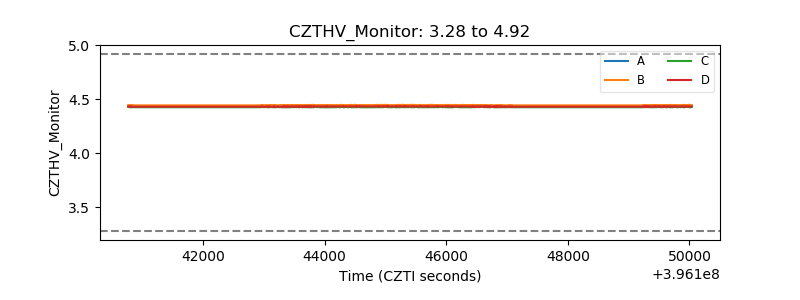 |
| D_VDD | 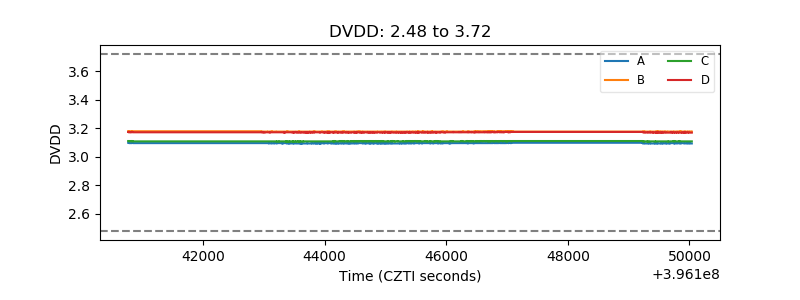 |
| Temperature 1 | 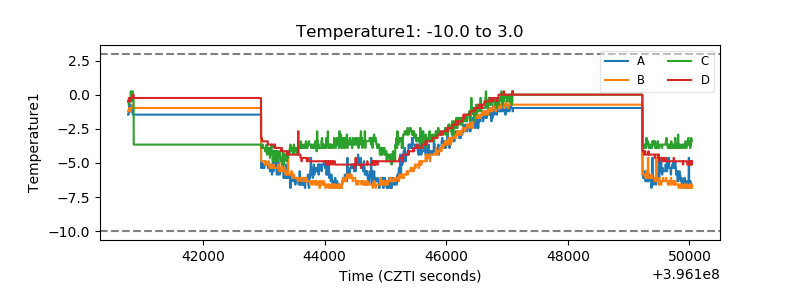 |
| Veto HV Monitor | 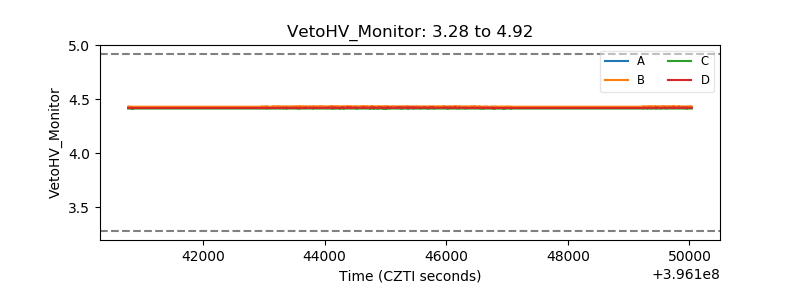 |
| Veto LLD | 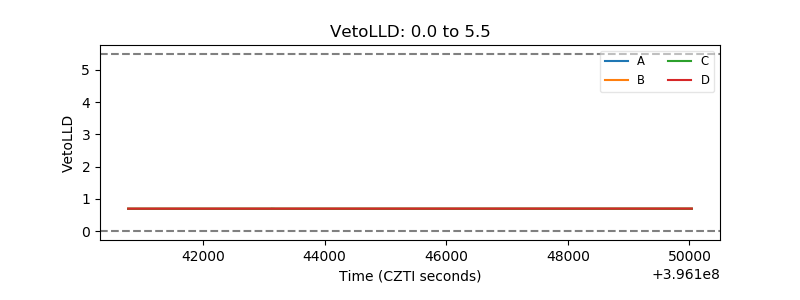 |
| Alpha Counter | 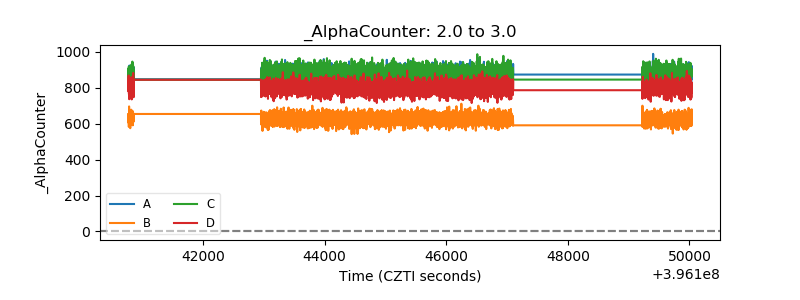 |
| _CPM_Rate | 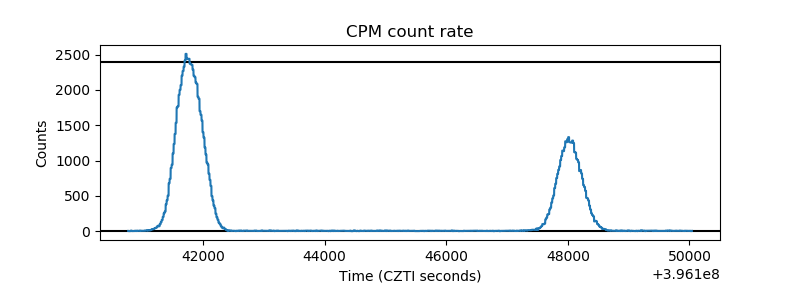 |
| CZT Counter | 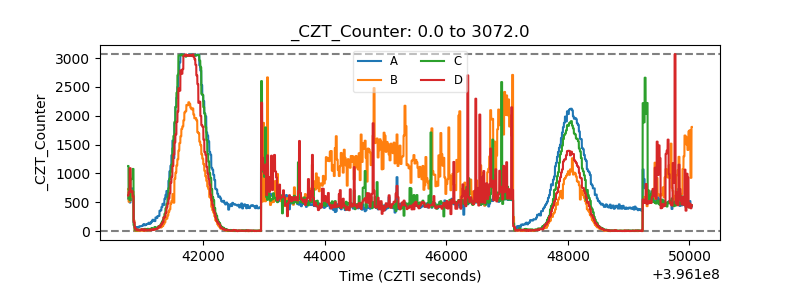 |
| +2.5 Volts monitor |  |
| +5 Volts monitor |  |
| _ROLL_ROT | 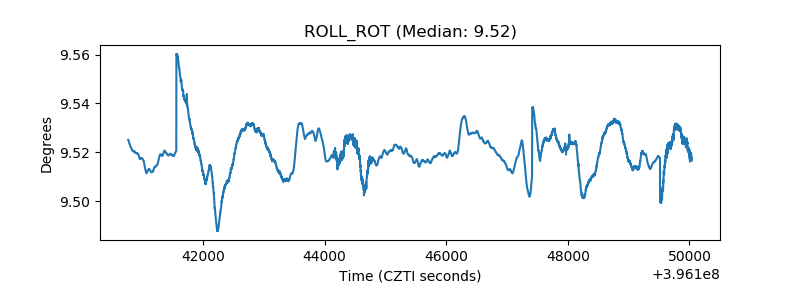 |
| _Roll_DEC | 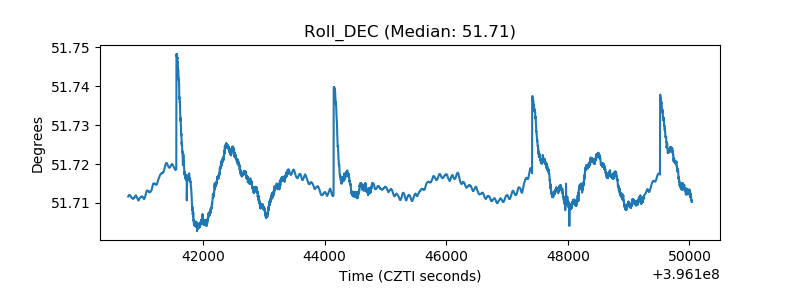 |
| _Roll_RA | 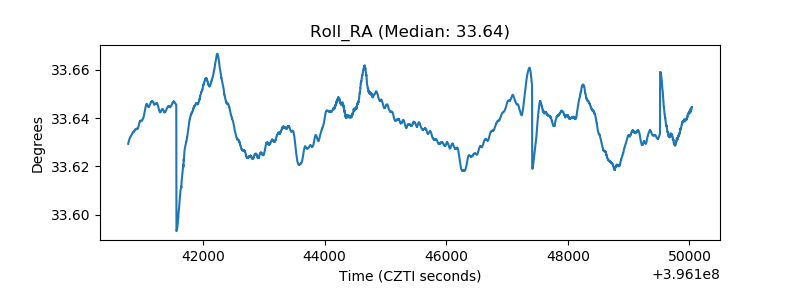 |
| Veto Counter |  |