| Param | Original file | Final file |
|---|---|---|
| Filename | modeM0/AS1A11_075T01_9000005244_36842cztM0_level2.evt | modeM0/AS1A11_075T01_9000005244_36842cztM0_level2_quad_clean.evt |
| Size (bytes) | 369,002,880 | 66,067,200 |
| Size | 351.9 MB | 63.0 MB |
| Events in quadrant A | 1,692,882 | 453,136 |
| Events in quadrant B | 5,265,202 | 393,957 |
| Events in quadrant C | 1,999,262 | 458,715 |
| Events in quadrant D | 1,971,620 | 438,448 |
| Mode SS | |||
|---|---|---|---|
| Quadrant | BADHDUFLAG | Total packets | Discarded packets |
| A | 0 | 84 | 12 |
| B | 0 | 83 | 11 |
| C | 0 | 84 | 14 |
| D | 0 | 84 | 12 |
| Mode M0 | |||
|---|---|---|---|
| Quadrant | BADHDUFLAG | Total packets | Discarded packets |
| A | 0 | 8758 | 1155 |
| B | 0 | 22746 | 4732 |
| C | 0 | 9515 | 1226 |
| D | 0 | 10113 | 1584 |
| Mode M9 | |||
|---|---|---|---|
| Quadrant | BADHDUFLAG | Total packets | Discarded packets |
| A | 0 | 27 | 2 |
| B | 0 | 26 | 1 |
| C | 0 | 26 | 2 |
| D | 0 | 26 | 0 |
| Quadrant | Total seconds | Saturated seconds | Saturation percentage |
|---|---|---|---|
| A | 3635 | 5 | 0.137552% |
| B | 3557 | 1225 | 34.439134% |
| C | 3633 | 121 | 3.330581% |
| D | 3634 | 28 | 0.770501% |
Noise dominated data is calculated using 1-second bins in cleaned event files. If a bin has >2000 counts, and if more than 50% of those come from <1% of pixels, then it is considered to be noise-dominated and hence unusable.
| Quadrant | # 1 sec bins | Bins with >0 counts | Bins with >2000 counts | High rate bins dominated by noise | Noise dominated (total time) | Noise dominated (detector-on time) | Marked lightcurve |
|---|---|---|---|---|---|---|---|
| A | 7284 | 3682 | 0 | 0 | 0.00% | 0.00% | 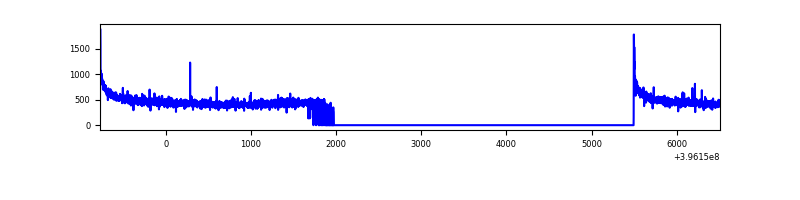 |
| B | 7284 | 3580 | 1201 | 1201 | 16.49% | 33.55% | 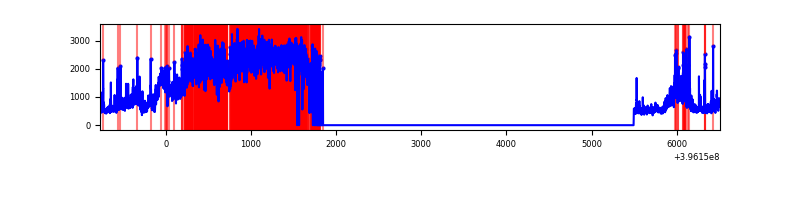 |
| C | 7284 | 3688 | 99 | 99 | 1.36% | 2.68% | 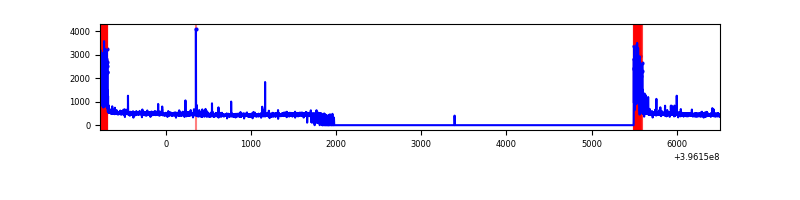 |
| D | 7284 | 3681 | 23 | 23 | 0.32% | 0.62% | 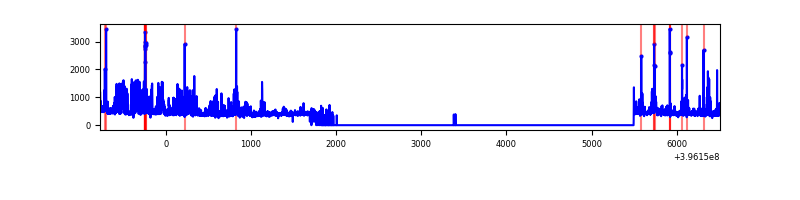 |
Top three noisy pixels from each quadrant. If the there are fewer than three noisy pixels in the level2.evt file, extra rows are filled as -1
| Pixel properties | Quadrant properties | ||||||
|---|---|---|---|---|---|---|---|
| Quadrant | DetID | PixID | Counts | Sigma | Mean | Median | Sigma |
| A | 10 | 83 | 181253 | 2284.69 | 386 | 379 | 79.2 |
| A | 13 | 6 | 6674 | 79.51 | 386 | 379 | 79.2 |
| A | 9 | 143 | 6621 | 78.85 | 386 | 379 | 79.2 |
| B | 12 | 1 | 3258071 | 48772.11 | 348 | 340 | 66.8 |
| B | 5 | 172 | 328545 | 4913.62 | 348 | 340 | 66.8 |
| B | 4 | 232 | 140871 | 2103.92 | 348 | 340 | 66.8 |
| C | 0 | 10 | 341679 | 3893.51 | 376 | 378 | 87.7 |
| C | 15 | 214 | 165894 | 1888.18 | 376 | 378 | 87.7 |
| C | 14 | 254 | 17112 | 190.9 | 376 | 378 | 87.7 |
| D | 1 | 20 | 262684 | 2899.81 | 372 | 363 | 90.5 |
| D | 2 | 250 | 114857 | 1265.67 | 372 | 363 | 90.5 |
| D | 13 | 249 | 77475 | 852.43 | 372 | 363 | 90.5 |
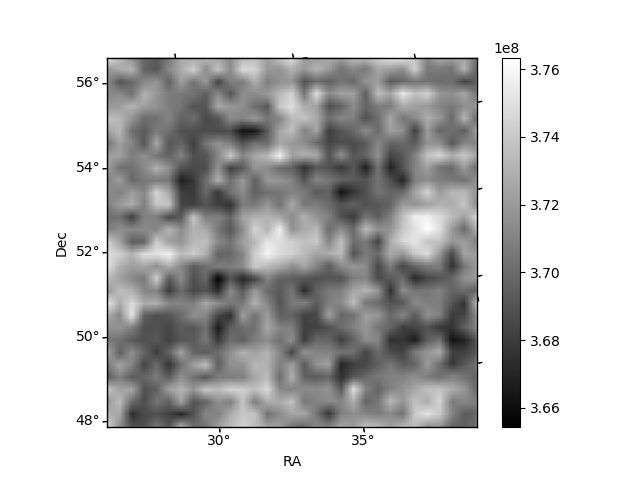
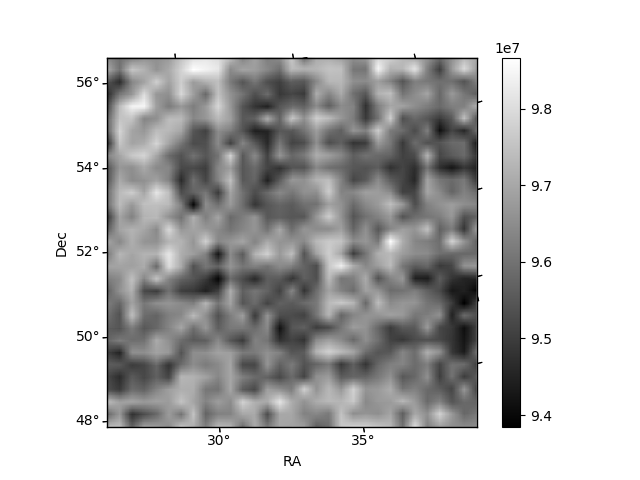
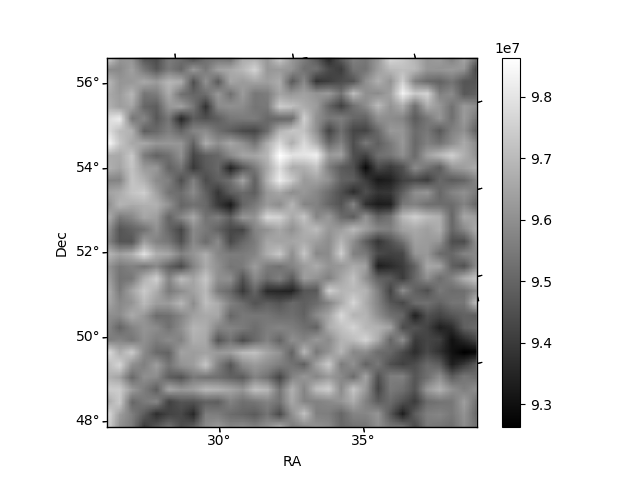
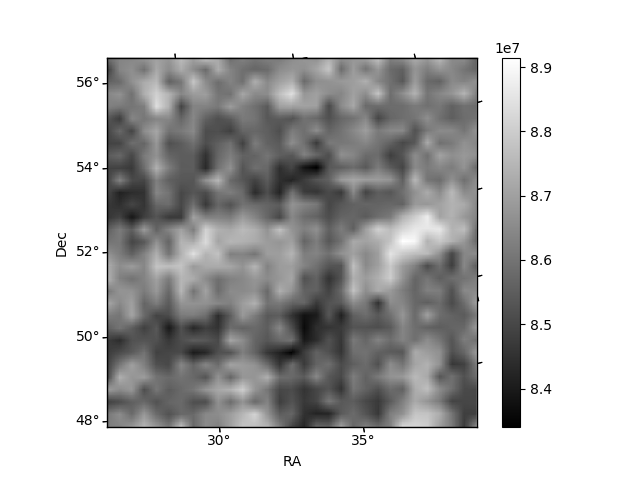
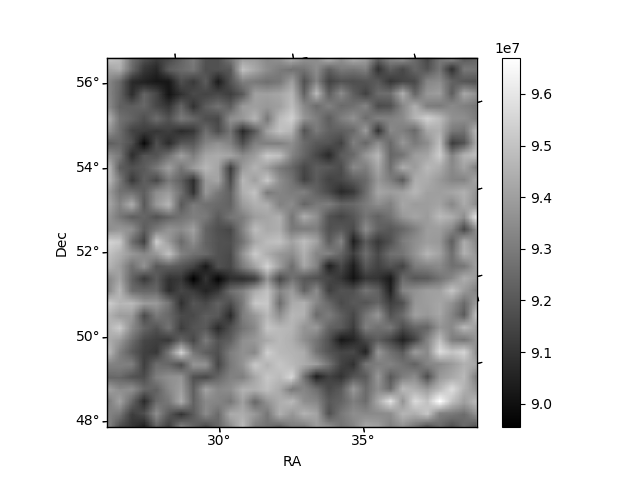
Histogram calculated using DETX and DETY for each event in the final _common_clean file
| Quadrant A | 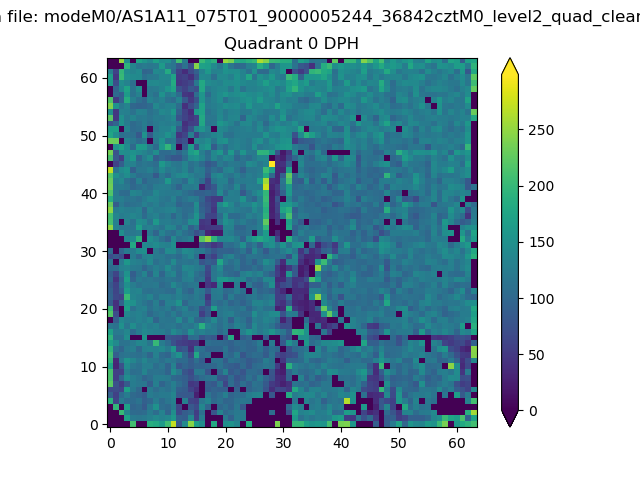 |
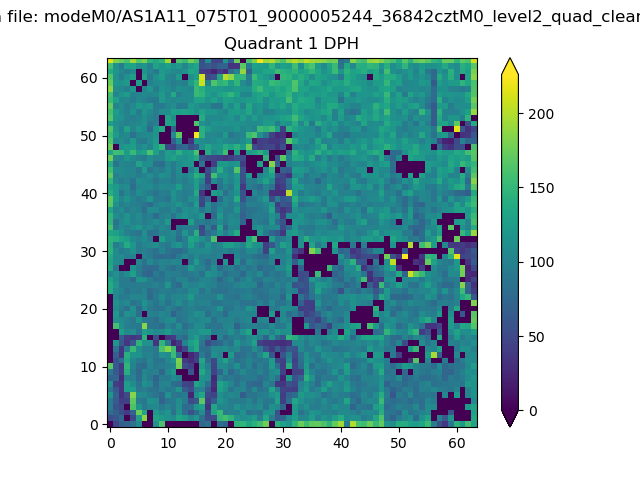 |
Quadrant B |
|---|---|---|---|
| Quadrant D | 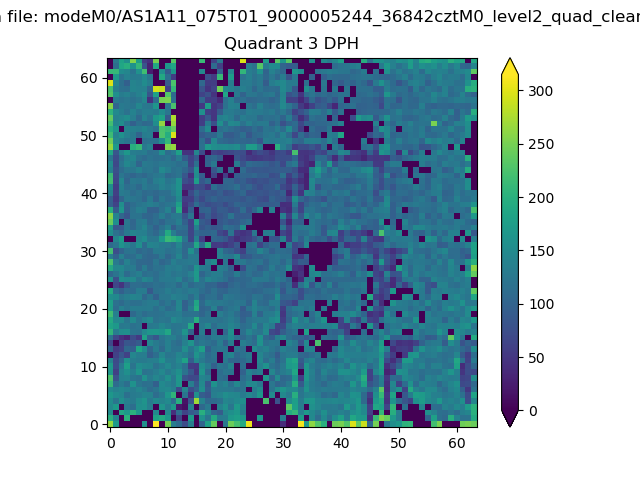 |
 |
Quadrant C |
| Plot type | Count rate plots | Images |
|---|---|---|
| Comparison with Poisson distribution Blue bars denote a histogram of data divided into 1 sec bins. Red curve is a Poisson curve with rate = median count rate of data. |
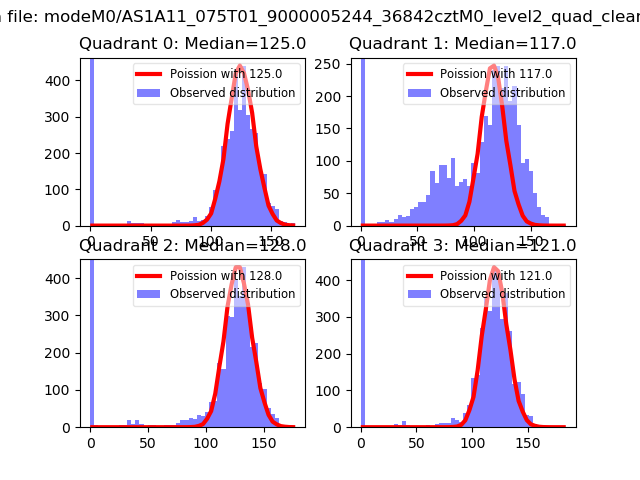 |
 |
| Quadrant-wise count rates Data is divided into 100 sec bins |
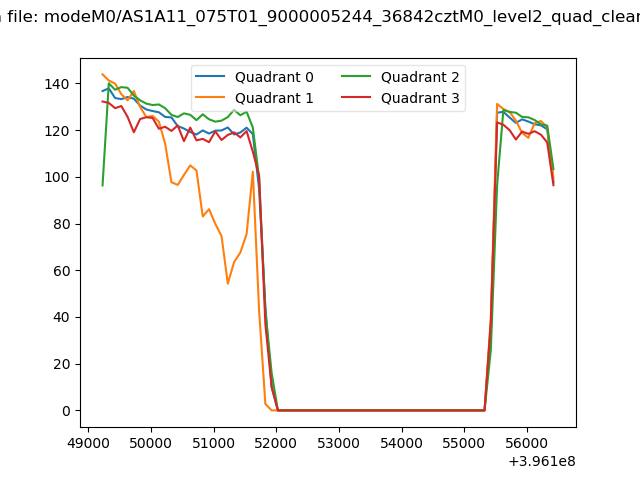 |
|
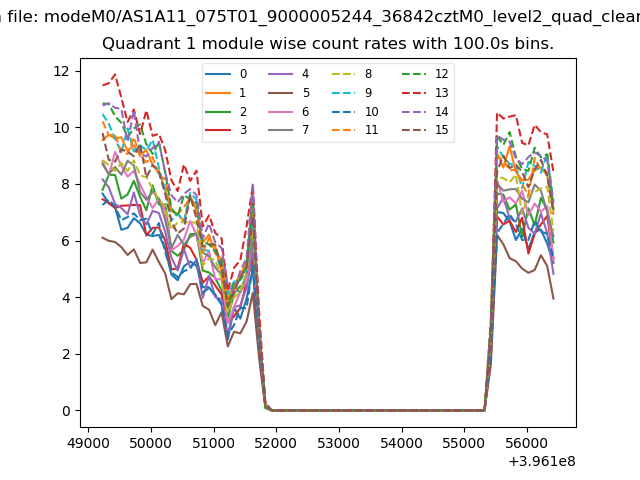
| Module-wise count rates for Quadrant A Data is divided into 100 sec bins |
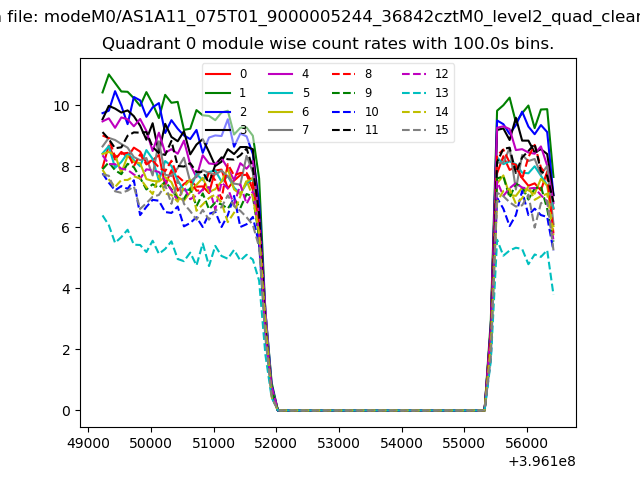 |
 |
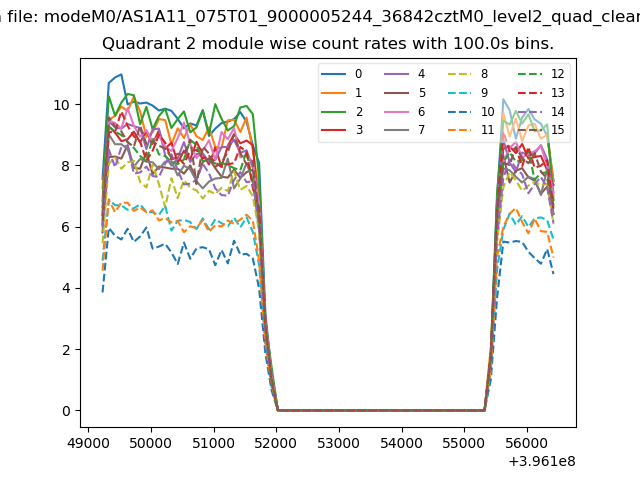
| Module-wise count rates for Quadrant B Data is divided into 100 sec bins |
 |
 |
| Module-wise count rates for Quadrant C Data is divided into 100 sec bins |
 |
 |
| Module-wise count rates for Quadrant D Data is divided into 100 sec bins |
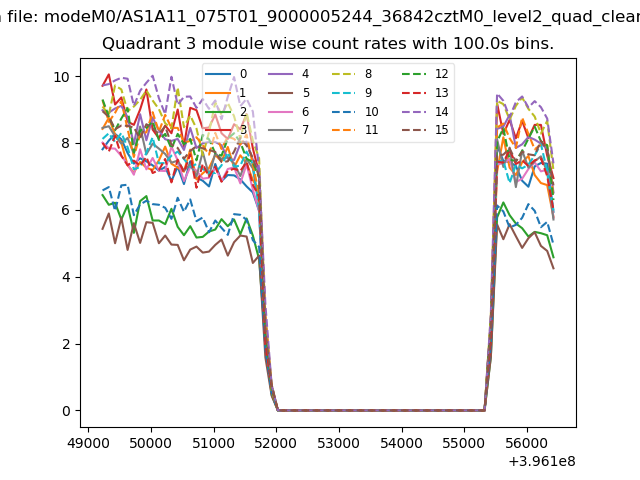 |
 |
| Parameter | Plot |
|---|---|
| CZT HV Monitor | 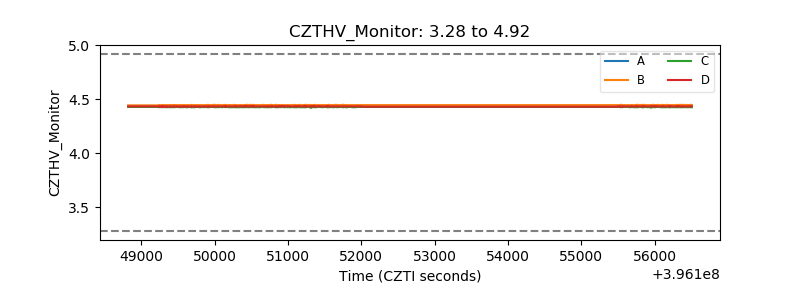 |
| D_VDD | 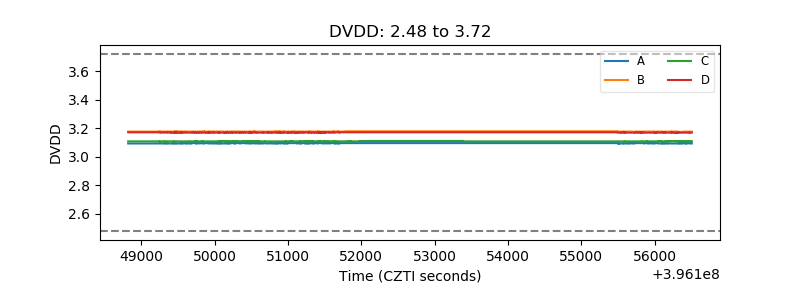 |
| Temperature 1 | 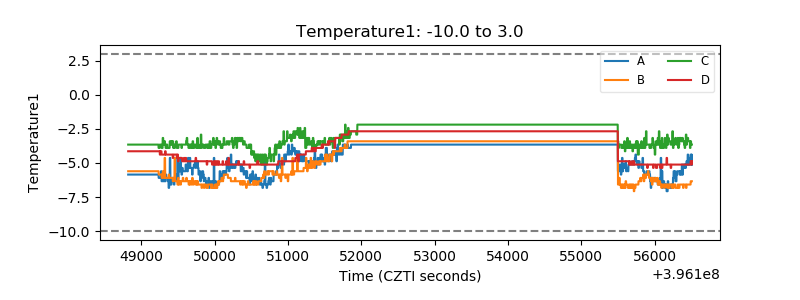 |
| Veto HV Monitor | 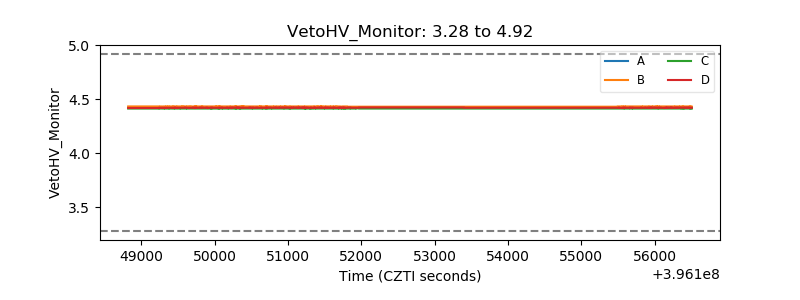 |
| Veto LLD | 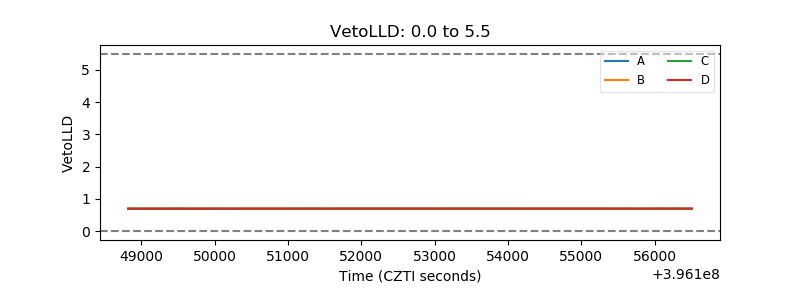 |
| Alpha Counter | 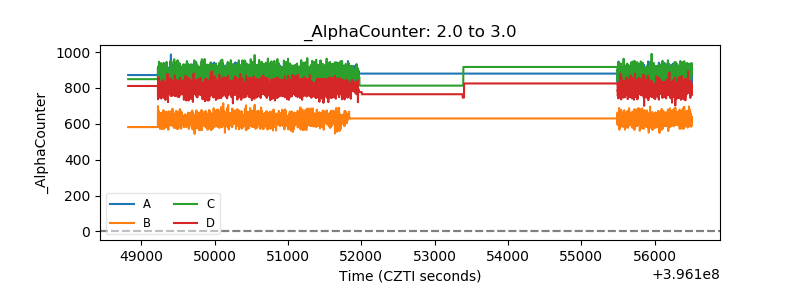 |
| _CPM_Rate | 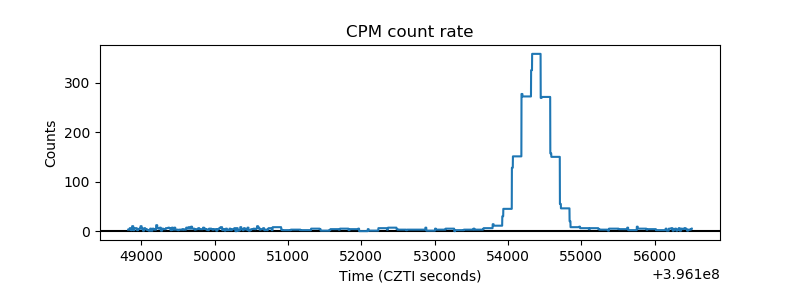 |
| CZT Counter | 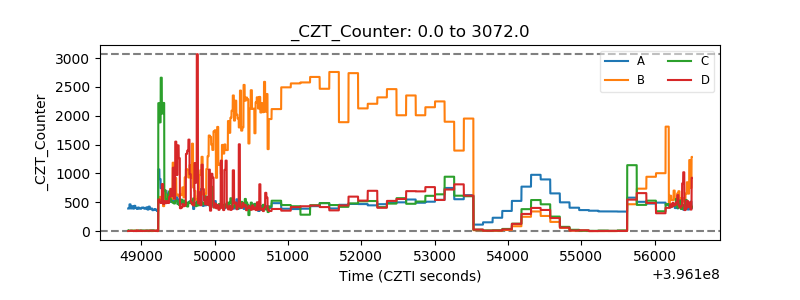 |
| +2.5 Volts monitor |  |
| +5 Volts monitor | 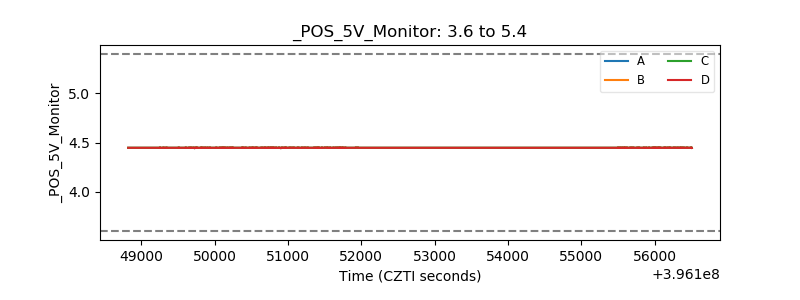 |
| _ROLL_ROT | 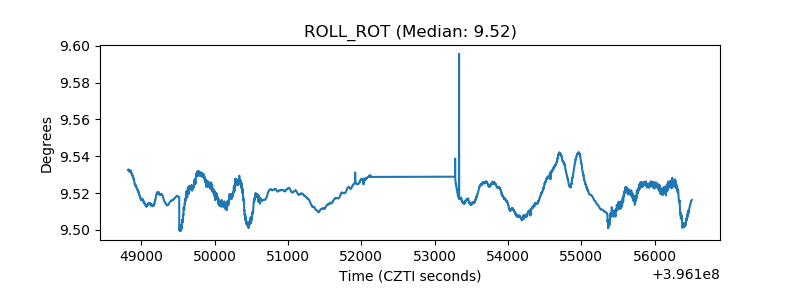 |
| _Roll_DEC |  |
| _Roll_RA | 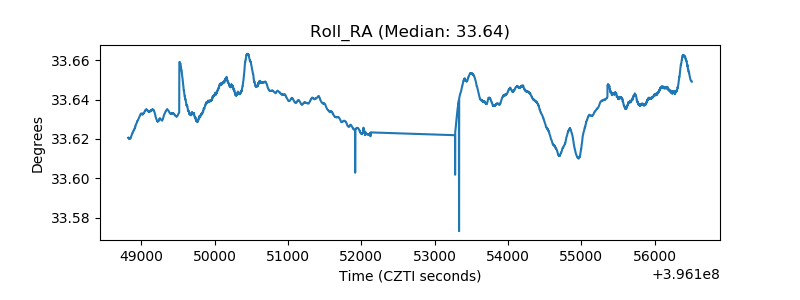 |
| Veto Counter | 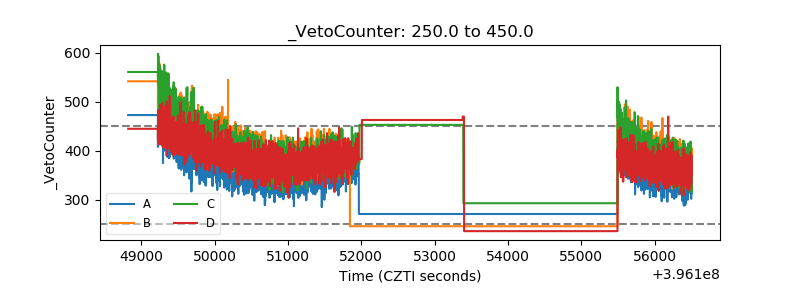 |