| Param | Original file | Final file |
|---|---|---|
| Filename | modeM0/AS1A11_075T01_9000005244_36843cztM0_level2.evt | modeM0/AS1A11_075T01_9000005244_36843cztM0_level2_quad_clean.evt |
| Size (bytes) | 541,192,320 | 59,086,080 |
| Size | 516.1 MB | 56.3 MB |
| Events in quadrant A | 2,381,448 | 364,816 |
| Events in quadrant B | 8,513,749 | 331,870 |
| Events in quadrant C | 2,481,132 | 377,856 |
| Events in quadrant D | 2,668,459 | 357,541 |
| Mode SS | |||
|---|---|---|---|
| Quadrant | BADHDUFLAG | Total packets | Discarded packets |
| A | 0 | 108 | 4 |
| B | 0 | 108 | 6 |
| C | 0 | 108 | 8 |
| D | 0 | 108 | 4 |
| Mode M0 | |||
|---|---|---|---|
| Quadrant | BADHDUFLAG | Total packets | Discarded packets |
| A | 0 | 11017 | 577 |
| B | 0 | 29912 | 1183 |
| C | 0 | 11189 | 571 |
| D | 0 | 12372 | 651 |
| Mode M9 | |||
|---|---|---|---|
| Quadrant | BADHDUFLAG | Total packets | Discarded packets |
| A | 0 | 19 | 0 |
| B | 0 | 19 | 0 |
| C | 0 | 19 | 0 |
| D | 0 | 19 | 0 |
| Quadrant | Total seconds | Saturated seconds | Saturation percentage |
|---|---|---|---|
| A | 5094 | 6 | 0.117786% |
| B | 5076 | 2345 | 46.197794% |
| C | 5102 | 10 | 0.196002% |
| D | 5089 | 34 | 0.668108% |
Noise dominated data is calculated using 1-second bins in cleaned event files. If a bin has >2000 counts, and if more than 50% of those come from <1% of pixels, then it is considered to be noise-dominated and hence unusable.
| Quadrant | # 1 sec bins | Bins with >0 counts | Bins with >2000 counts | High rate bins dominated by noise | Noise dominated (total time) | Noise dominated (detector-on time) | Marked lightcurve |
|---|---|---|---|---|---|---|---|
| A | 7234 | 5146 | 1 | 1 | 0.01% | 0.02% | 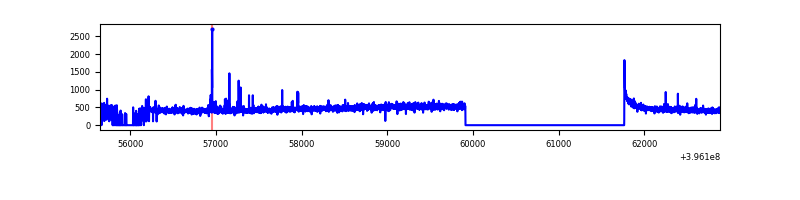 |
| B | 7234 | 5111 | 2148 | 2148 | 29.69% | 42.03% | 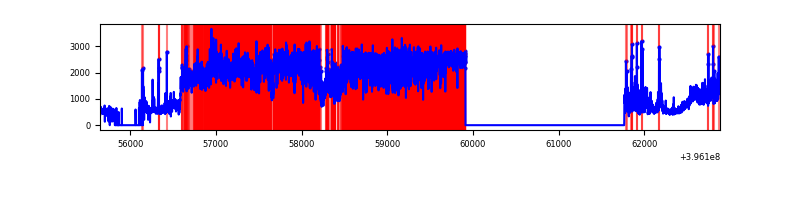 |
| C | 7234 | 5157 | 6 | 6 | 0.08% | 0.12% | 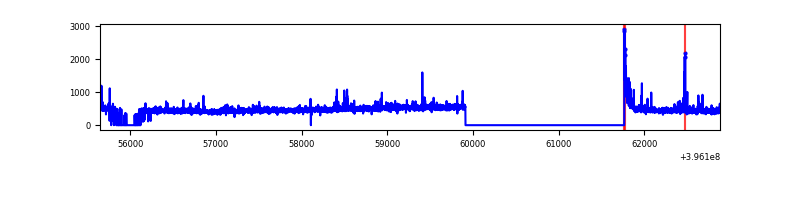 |
| D | 7234 | 5145 | 27 | 27 | 0.37% | 0.52% | 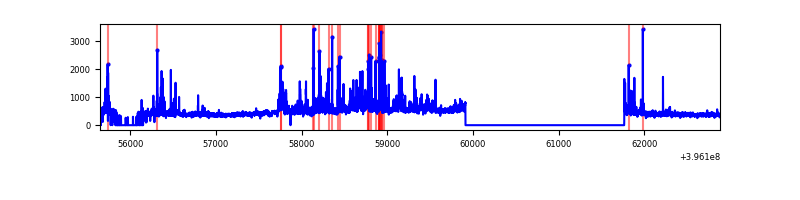 |
Top three noisy pixels from each quadrant. If the there are fewer than three noisy pixels in the level2.evt file, extra rows are filled as -1
| Pixel properties | Quadrant properties | ||||||
|---|---|---|---|---|---|---|---|
| Quadrant | DetID | PixID | Counts | Sigma | Mean | Median | Sigma |
| A | 10 | 83 | 174961 | 1530.03 | 559 | 548 | 114.0 |
| A | 9 | 143 | 30224 | 260.33 | 559 | 548 | 114.0 |
| A | 13 | 6 | 13035 | 109.54 | 559 | 548 | 114.0 |
| B | 12 | 1 | 5780979 | 64172.02 | 473 | 461 | 90.1 |
| B | 5 | 172 | 266563 | 2954.11 | 473 | 461 | 90.1 |
| B | 5 | 255 | 184571 | 2043.88 | 473 | 461 | 90.1 |
| C | 15 | 214 | 219524 | 1738.47 | 544 | 547 | 126.0 |
| C | 0 | 10 | 82781 | 652.86 | 544 | 547 | 126.0 |
| C | 14 | 254 | 40470 | 316.95 | 544 | 547 | 126.0 |
| D | 12 | 235 | 119772 | 904.89 | 541 | 526 | 131.8 |
| D | 2 | 250 | 107361 | 810.71 | 541 | 526 | 131.8 |
| D | 12 | 233 | 87233 | 657.97 | 541 | 526 | 131.8 |
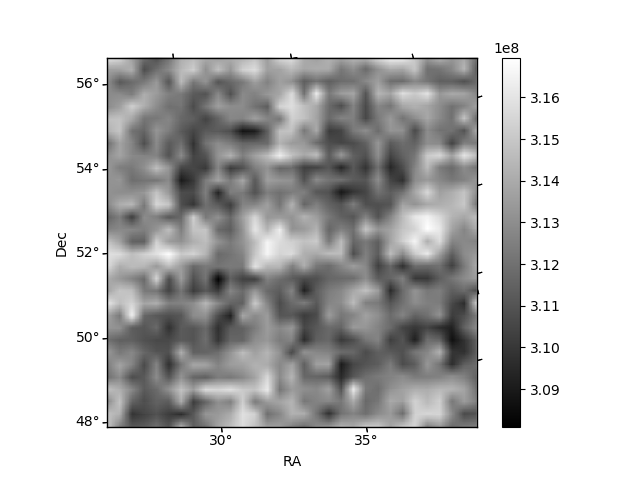
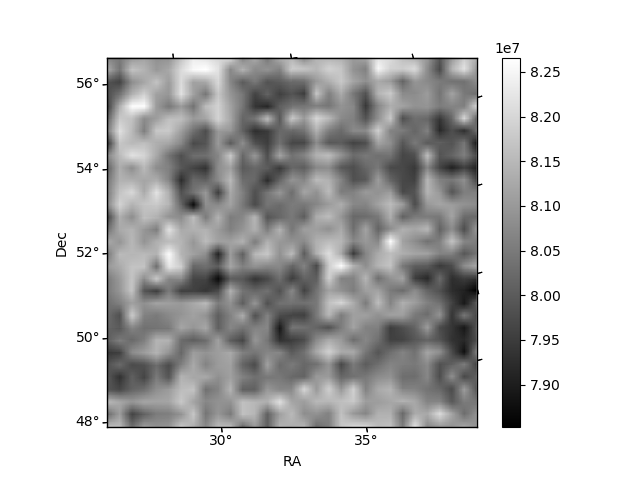
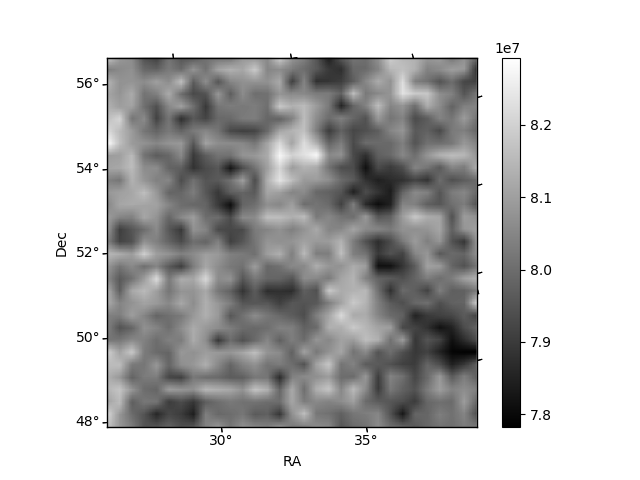
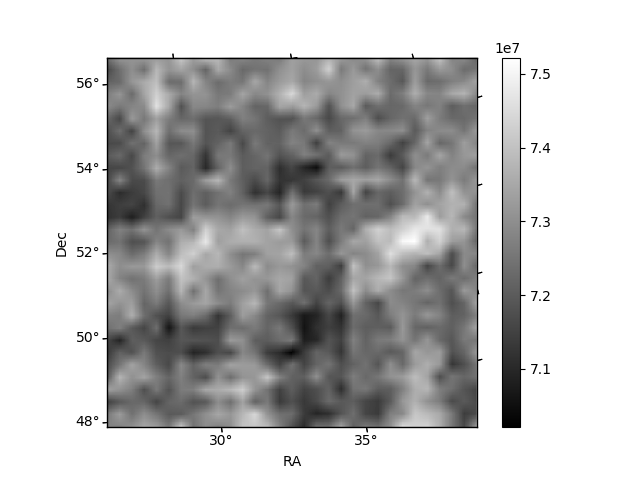
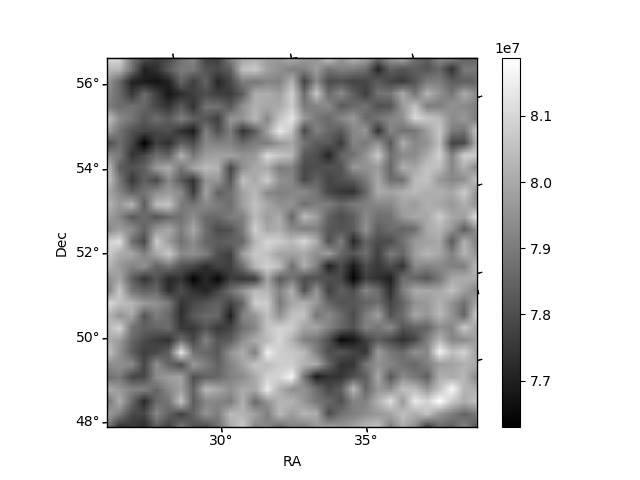
Histogram calculated using DETX and DETY for each event in the final _common_clean file
| Quadrant A | 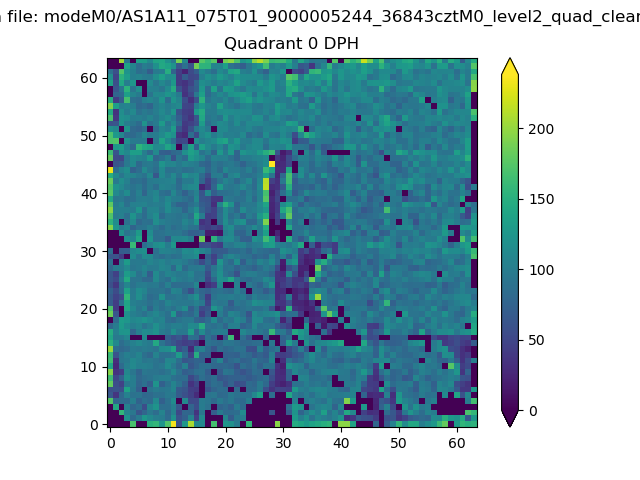 |
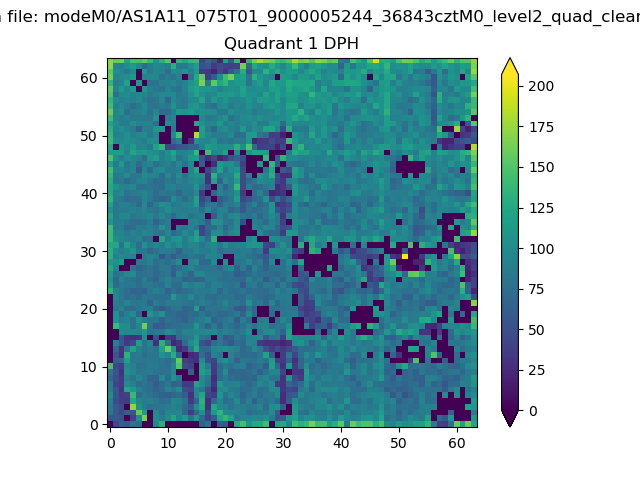 |
Quadrant B |
|---|---|---|---|
| Quadrant D |  |
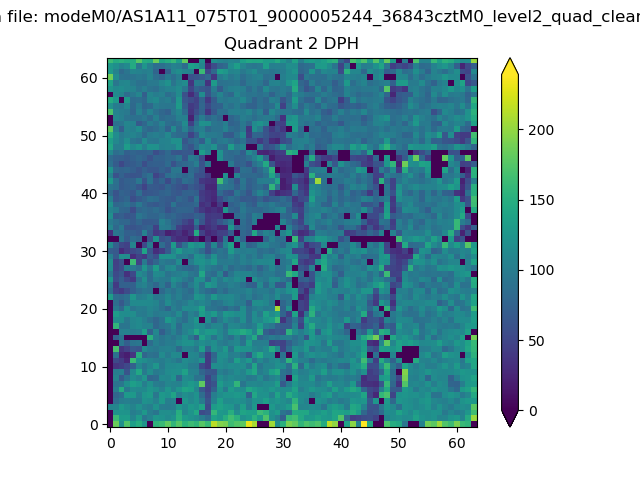 |
Quadrant C |
| Plot type | Count rate plots | Images |
|---|---|---|
| Comparison with Poisson distribution Blue bars denote a histogram of data divided into 1 sec bins. Red curve is a Poisson curve with rate = median count rate of data. |
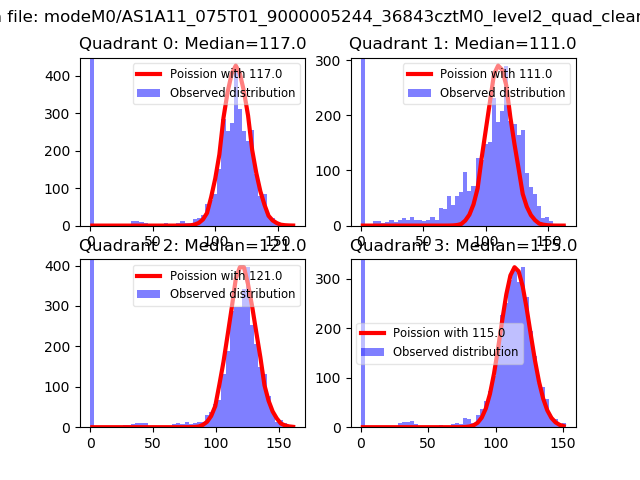 |
 |
| Quadrant-wise count rates Data is divided into 100 sec bins |
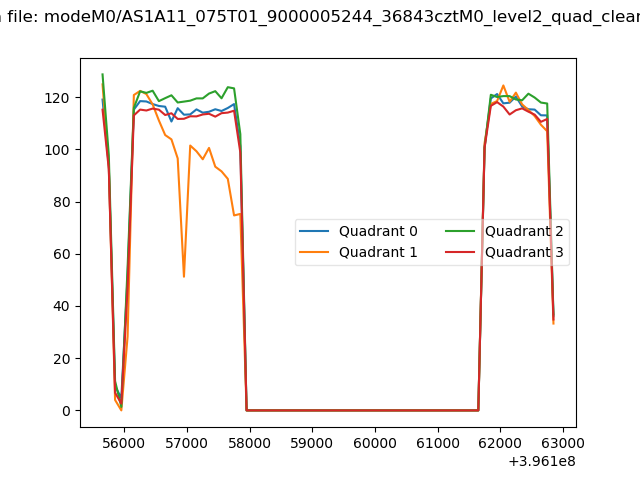 |
|
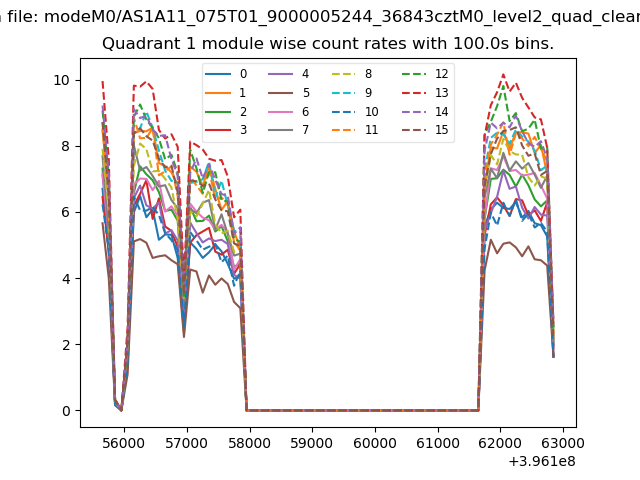
| Module-wise count rates for Quadrant A Data is divided into 100 sec bins |
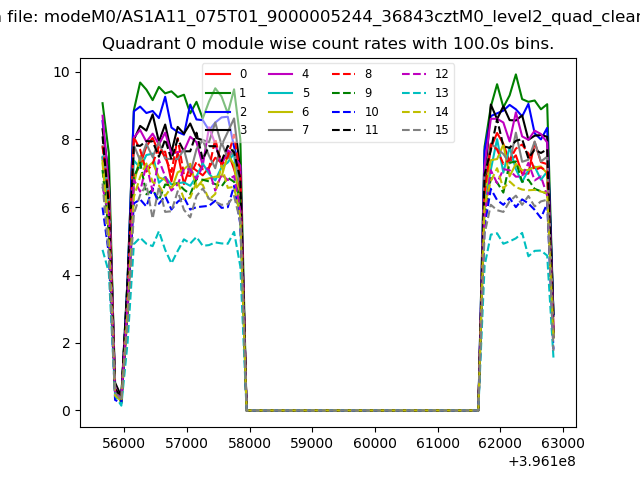 |
 |
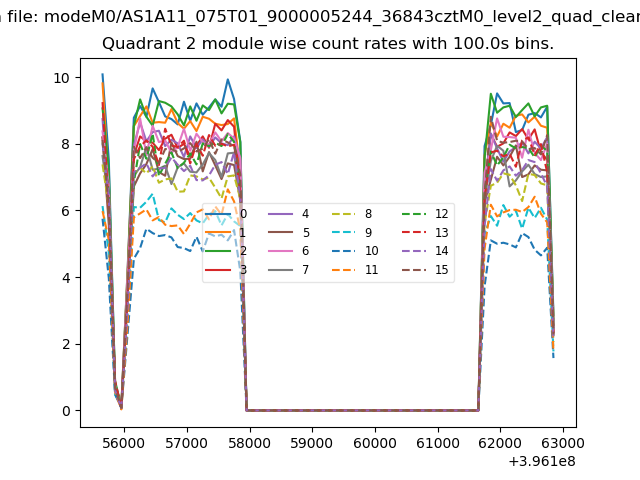
| Module-wise count rates for Quadrant B Data is divided into 100 sec bins |
 |
 |
| Module-wise count rates for Quadrant C Data is divided into 100 sec bins |
 |
 |
| Module-wise count rates for Quadrant D Data is divided into 100 sec bins |
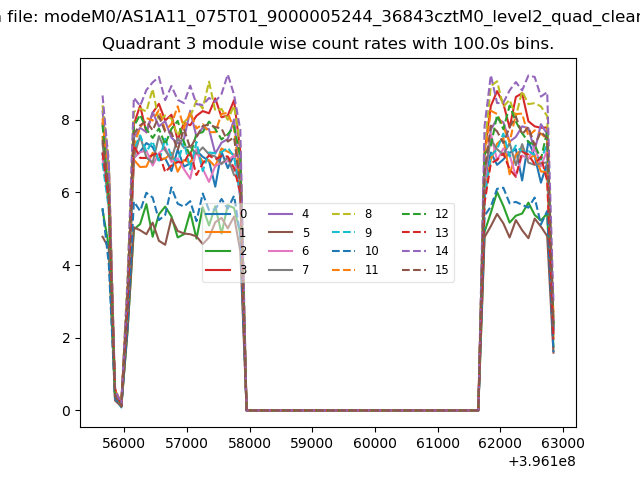 |
 |
| Parameter | Plot |
|---|---|
| CZT HV Monitor | 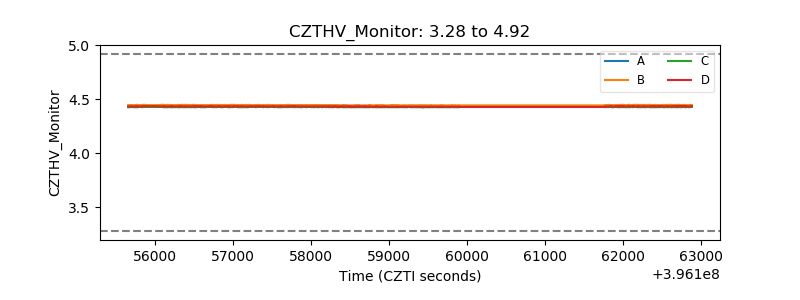 |
| D_VDD | 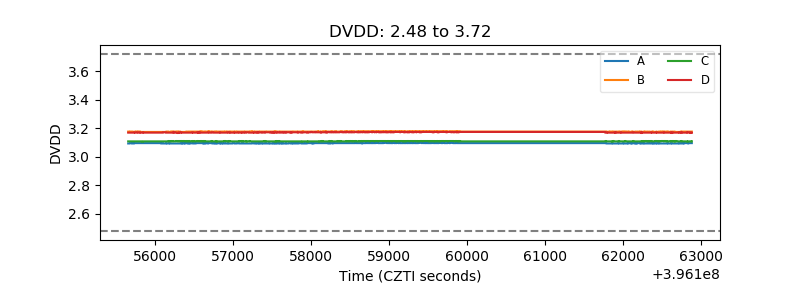 |
| Temperature 1 | 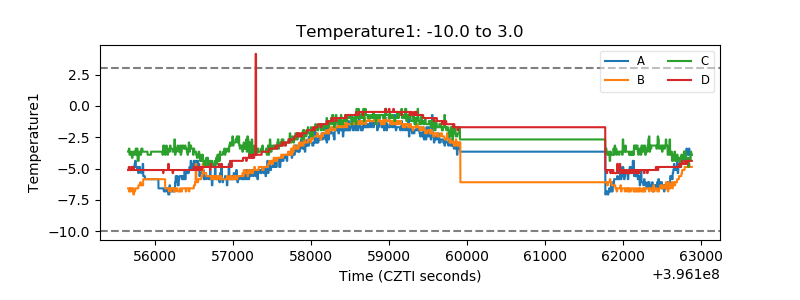 |
| Veto HV Monitor | 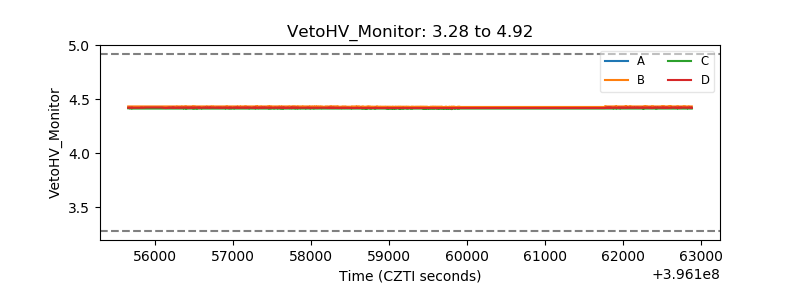 |
| Veto LLD | 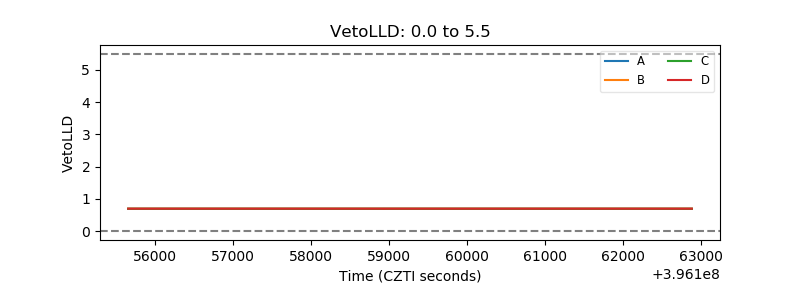 |
| Alpha Counter | 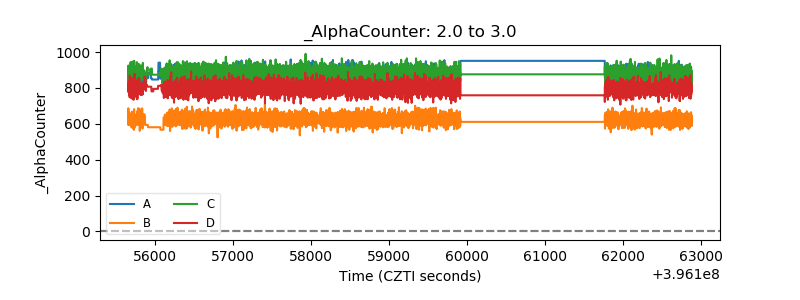 |
| _CPM_Rate |  |
| CZT Counter | 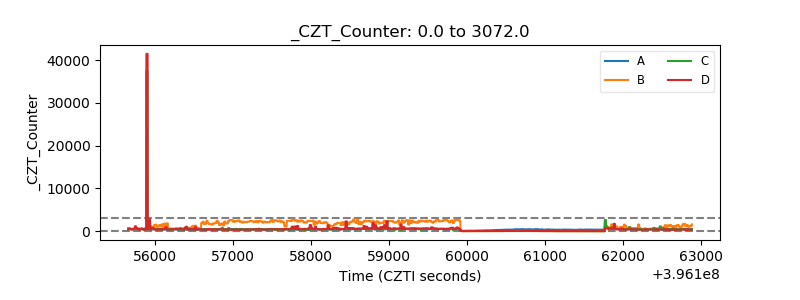 |
| +2.5 Volts monitor |  |
| +5 Volts monitor |  |
| _ROLL_ROT | 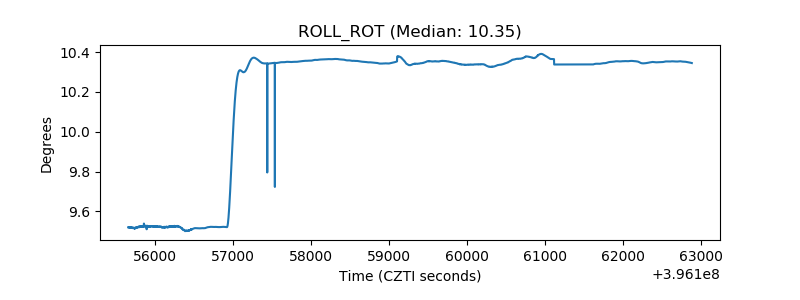 |
| _Roll_DEC | 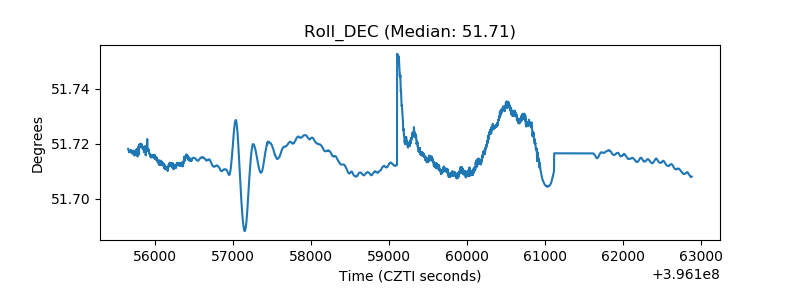 |
| _Roll_RA | 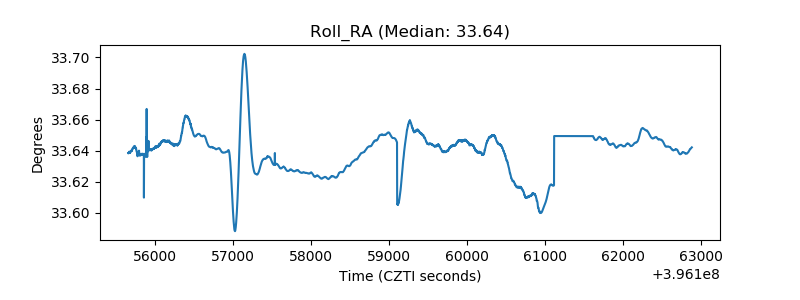 |
| Veto Counter | 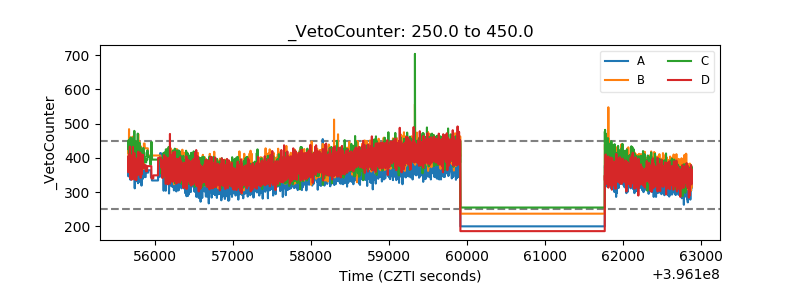 |