| Param | Original file | Final file |
|---|---|---|
| Filename | modeM0/AS1A11_075T01_9000005244_36845cztM0_level2.evt | modeM0/AS1A11_075T01_9000005244_36845cztM0_level2_quad_clean.evt |
| Size (bytes) | 1,921,559,040 | 217,612,800 |
| Size | 1.8 GB | 207.5 MB |
| Events in quadrant A | 9,217,085 | 1,454,785 |
| Events in quadrant B | 25,933,322 | 919,620 |
| Events in quadrant C | 9,811,867 | 1,484,450 |
| Events in quadrant D | 11,928,186 | 1,400,564 |
| Mode SS | |||
|---|---|---|---|
| Quadrant | BADHDUFLAG | Total packets | Discarded packets |
| A | 0 | 392 | 0 |
| B | 0 | 392 | 0 |
| C | 0 | 392 | 0 |
| D | 0 | 392 | 0 |
| Mode M0 | |||
|---|---|---|---|
| Quadrant | BADHDUFLAG | Total packets | Discarded packets |
| A | 0 | 39856 | 6 |
| B | 0 | 89642 | 5 |
| C | 0 | 41172 | 5 |
| D | 0 | 49227 | 5 |
| Mode M9 | |||
|---|---|---|---|
| Quadrant | BADHDUFLAG | Total packets | Discarded packets |
| A | 0 | 73 | 0 |
| B | 0 | 73 | 0 |
| C | 0 | 73 | 0 |
| D | 0 | 74 | 0 |
| Quadrant | Total seconds | Saturated seconds | Saturation percentage |
|---|---|---|---|
| A | 19296 | 34 | 0.176202% |
| B | 19252 | 12144 | 63.079161% |
| C | 19296 | 151 | 0.782546% |
| D | 19296 | 566 | 2.933250% |
Noise dominated data is calculated using 1-second bins in cleaned event files. If a bin has >2000 counts, and if more than 50% of those come from <1% of pixels, then it is considered to be noise-dominated and hence unusable.
| Quadrant | # 1 sec bins | Bins with >0 counts | Bins with >2000 counts | High rate bins dominated by noise | Noise dominated (total time) | Noise dominated (detector-on time) | Marked lightcurve |
|---|---|---|---|---|---|---|---|
| A | 26107 | 19300 | 13 | 13 | 0.05% | 0.07% | 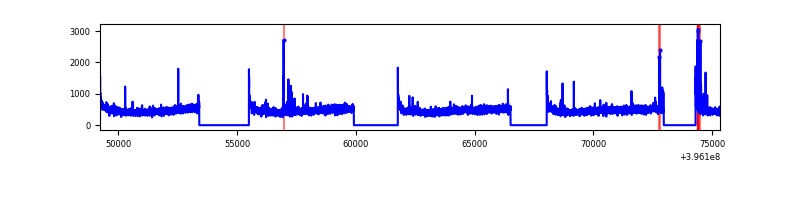 |
| B | 26106 | 19252 | 6466 | 6466 | 24.77% | 33.59% | 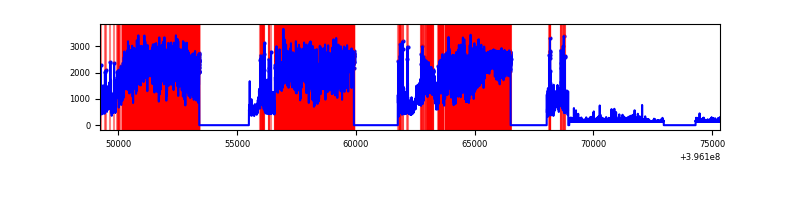 |
| C | 26107 | 19300 | 123 | 123 | 0.47% | 0.64% | 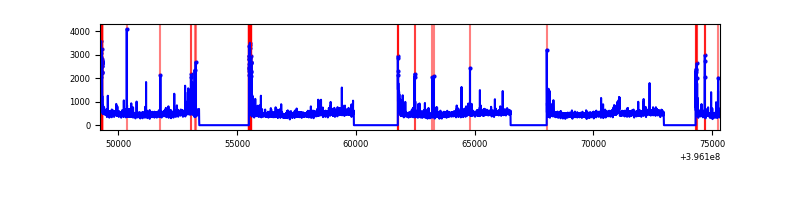 |
| D | 26107 | 19300 | 497 | 497 | 1.90% | 2.58% | 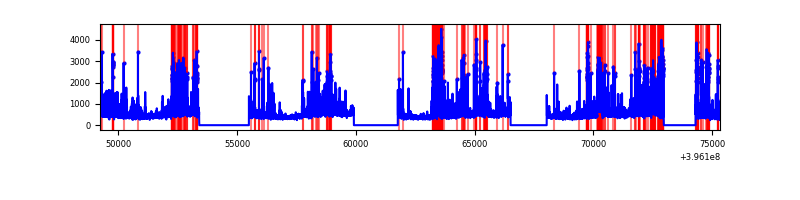 |
Top three noisy pixels from each quadrant. If the there are fewer than three noisy pixels in the level2.evt file, extra rows are filled as -1
| Pixel properties | Quadrant properties | ||||||
|---|---|---|---|---|---|---|---|
| Quadrant | DetID | PixID | Counts | Sigma | Mean | Median | Sigma |
| A | 10 | 83 | 697437 | 1601.45 | 2160 | 2112 | 434.2 |
| A | 15 | 223 | 81721 | 183.35 | 2160 | 2112 | 434.2 |
| A | 9 | 143 | 48793 | 107.51 | 2160 | 2112 | 434.2 |
| B | 12 | 1 | 17577846 | 70844.2 | 1321 | 1288 | 248.1 |
| B | 5 | 172 | 837164 | 3369.09 | 1321 | 1288 | 248.1 |
| B | 12 | 243 | 694021 | 2792.13 | 1321 | 1288 | 248.1 |
| C | 15 | 214 | 837137 | 1732.25 | 2096 | 2104 | 482.1 |
| C | 0 | 10 | 553642 | 1144.15 | 2096 | 2104 | 482.1 |
| C | 14 | 254 | 135245 | 276.2 | 2096 | 2104 | 482.1 |
| D | 1 | 52 | 576651 | 1141.44 | 2082 | 2025 | 503.4 |
| D | 13 | 171 | 549258 | 1087.03 | 2082 | 2025 | 503.4 |
| D | 2 | 250 | 475779 | 941.07 | 2082 | 2025 | 503.4 |
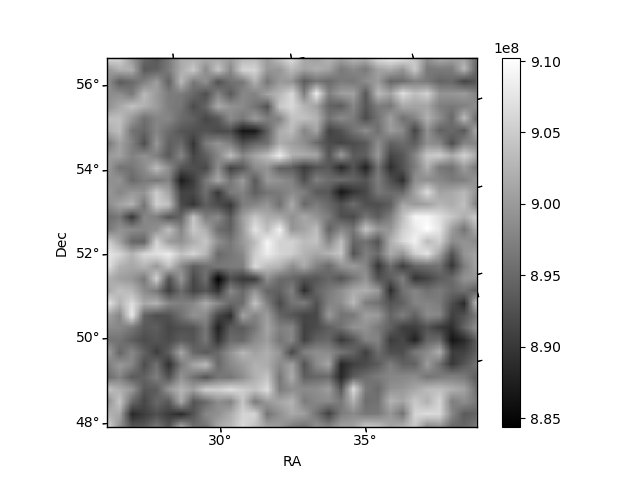
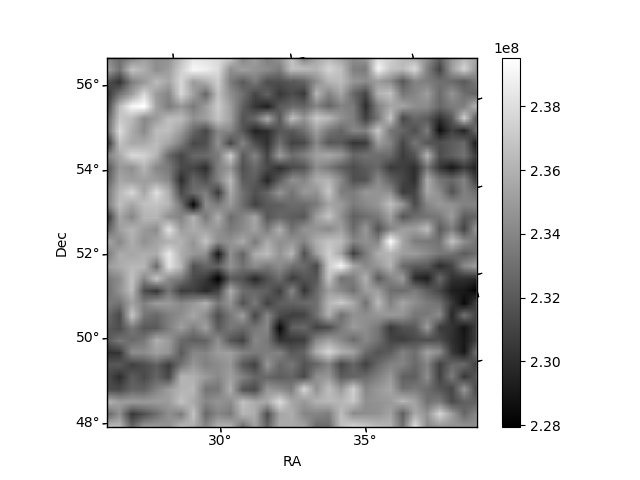
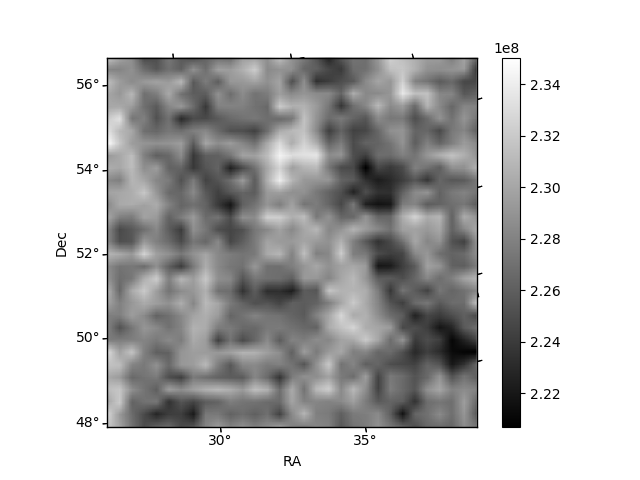
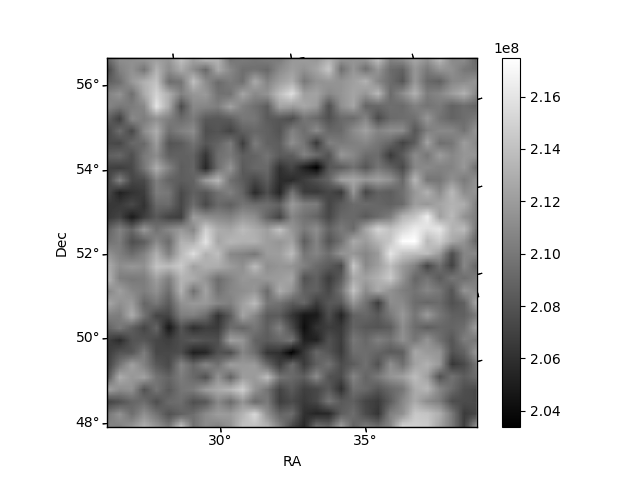
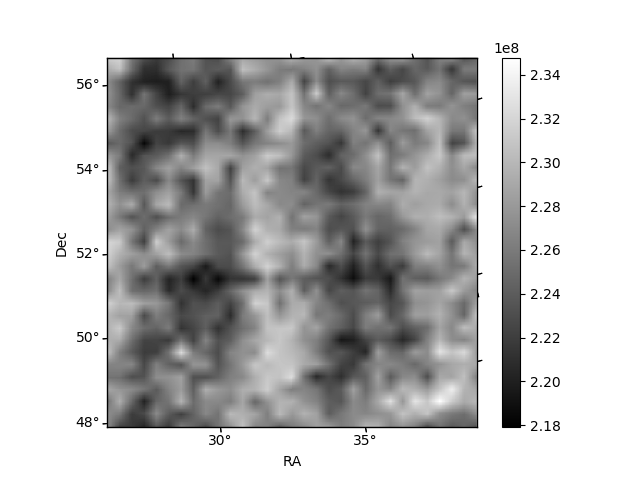
Histogram calculated using DETX and DETY for each event in the final _common_clean file
| Quadrant A | 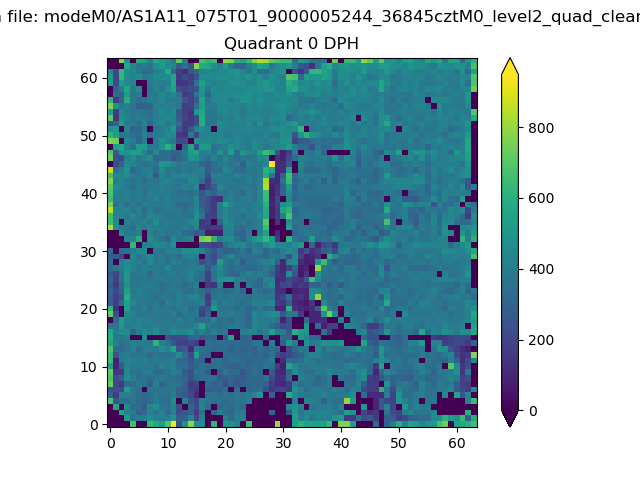 |
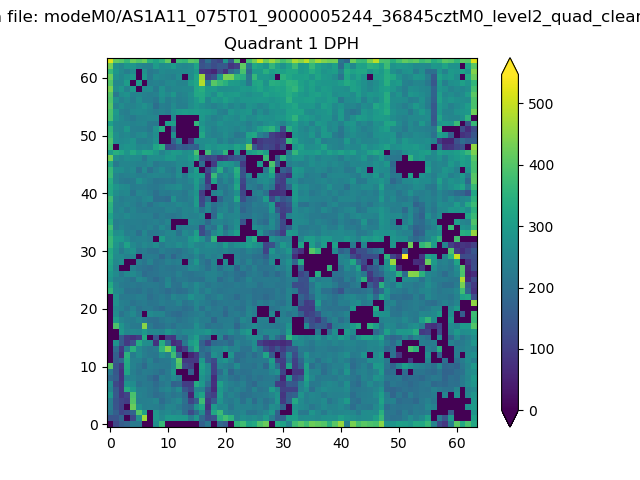 |
Quadrant B |
|---|---|---|---|
| Quadrant D | 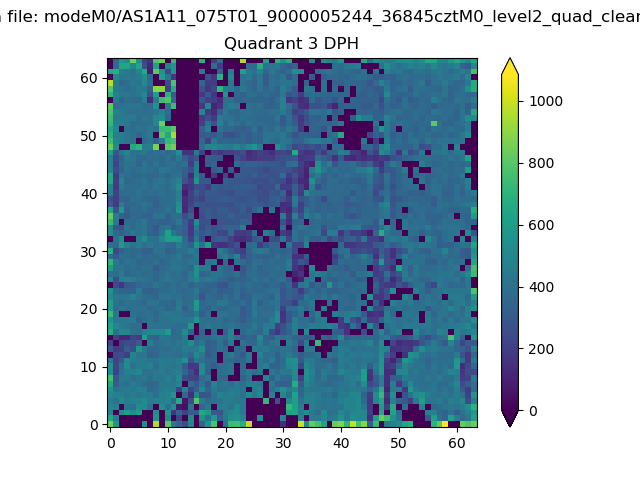 |
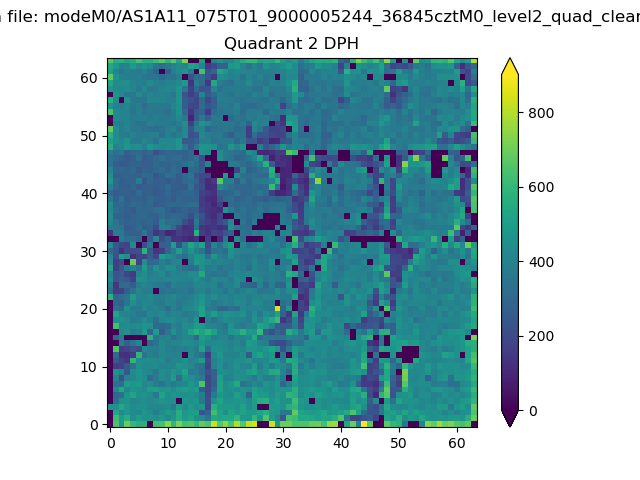 |
Quadrant C |
| Plot type | Count rate plots | Images |
|---|---|---|
| Comparison with Poisson distribution Blue bars denote a histogram of data divided into 1 sec bins. Red curve is a Poisson curve with rate = median count rate of data. |
 |
 |
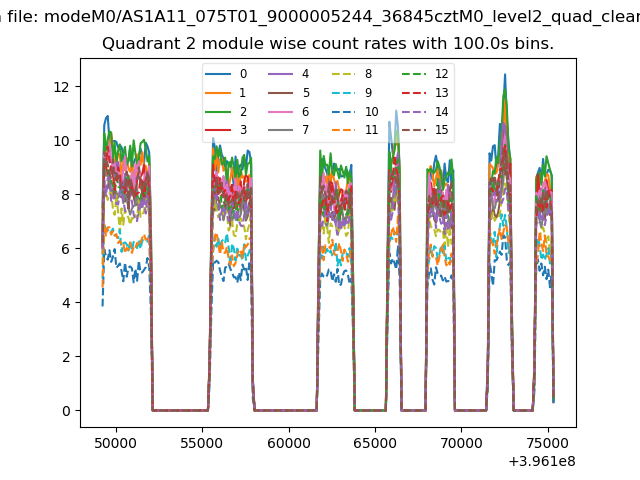
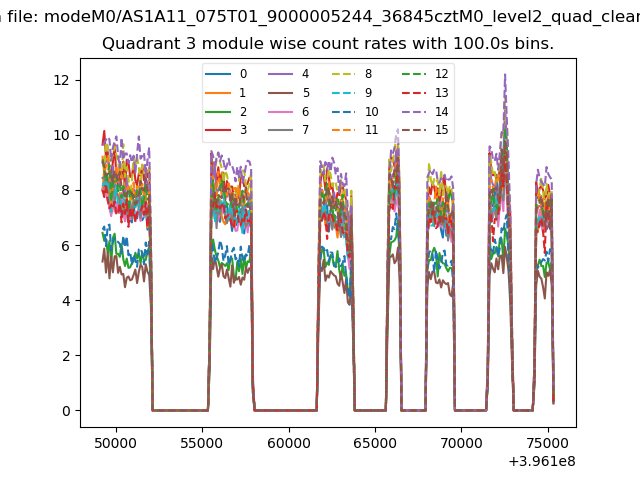
| Quadrant-wise count rates Data is divided into 100 sec bins |
 |
|
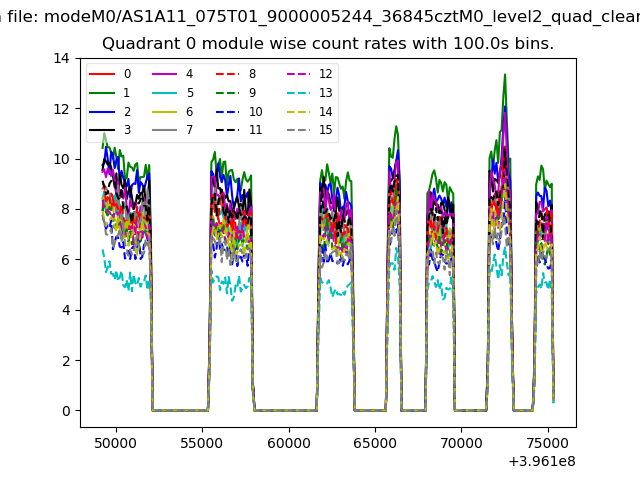
| Module-wise count rates for Quadrant A Data is divided into 100 sec bins |
 |
 |
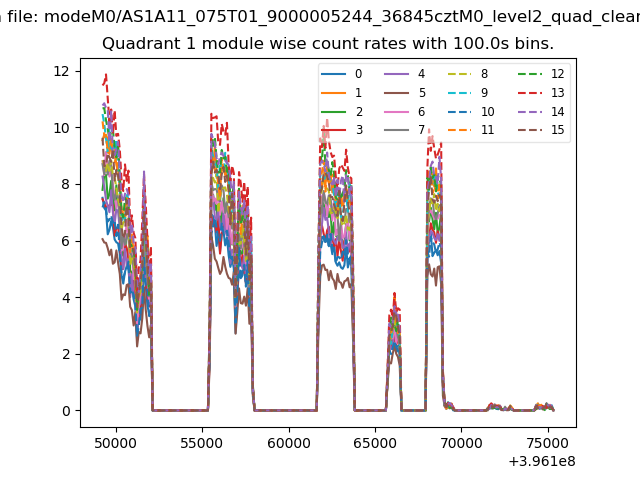
| Module-wise count rates for Quadrant B Data is divided into 100 sec bins |
 |
 |
| Module-wise count rates for Quadrant C Data is divided into 100 sec bins |
 |
 |
| Module-wise count rates for Quadrant D Data is divided into 100 sec bins |
 |
 |
| Parameter | Plot |
|---|---|
| CZT HV Monitor | 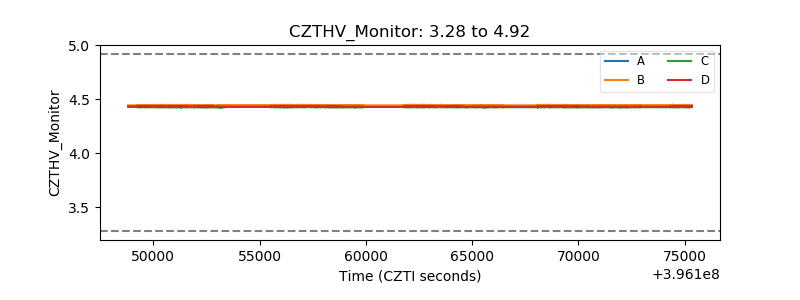 |
| D_VDD | 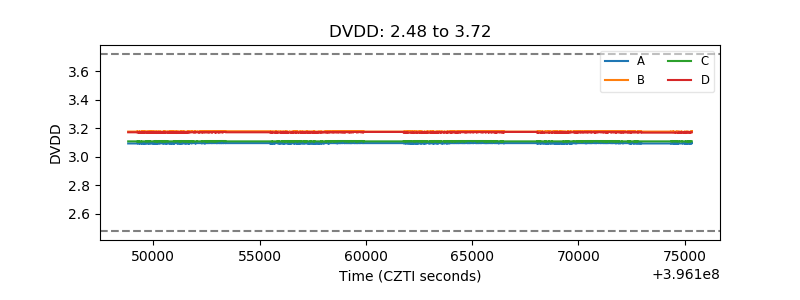 |
| Temperature 1 | 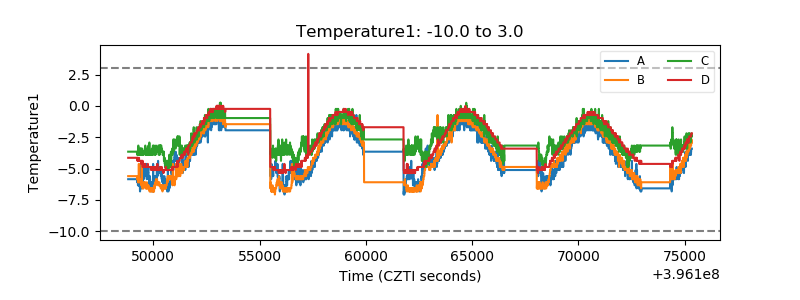 |
| Veto HV Monitor | 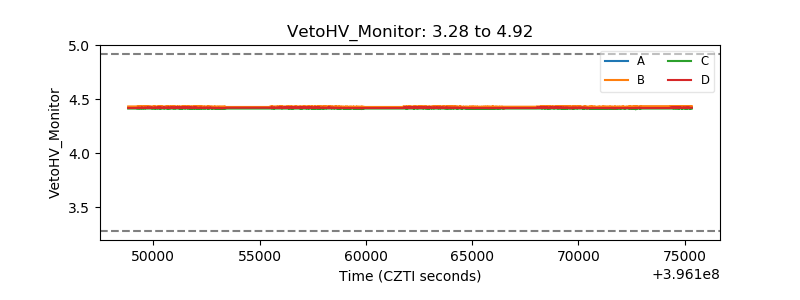 |
| Veto LLD |  |
| Alpha Counter | 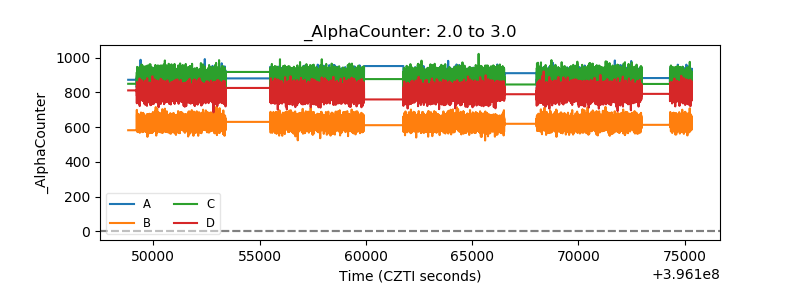 |
| _CPM_Rate |  |
| CZT Counter | 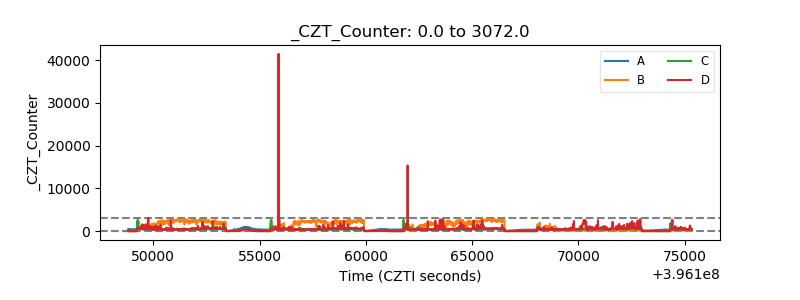 |
| +2.5 Volts monitor |  |
| +5 Volts monitor |  |
| _ROLL_ROT | 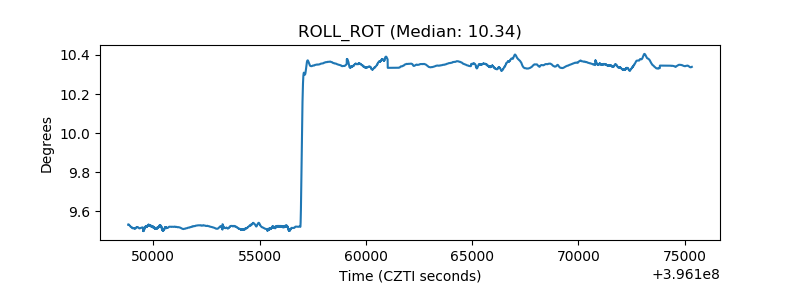 |
| _Roll_DEC | 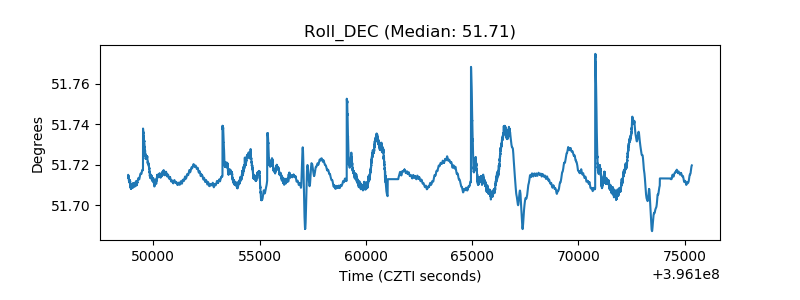 |
| _Roll_RA | 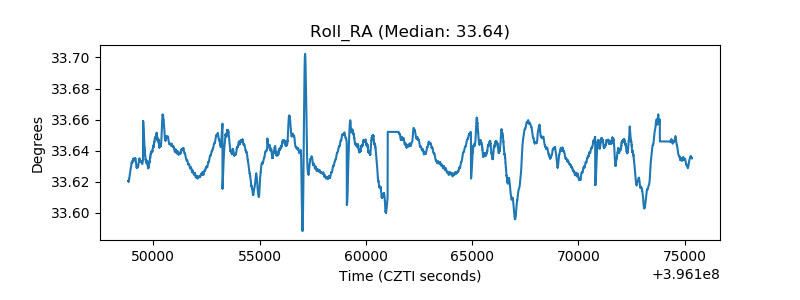 |
| Veto Counter | 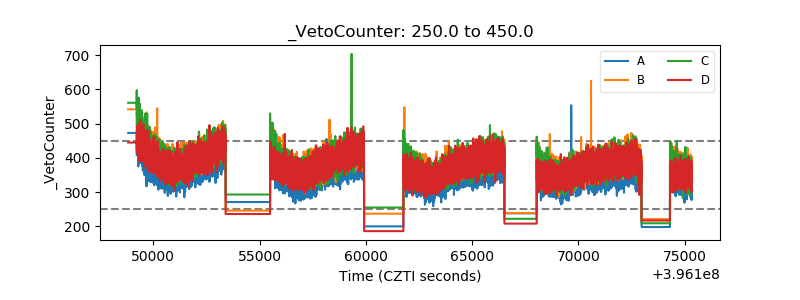 |