| Param | Original file | Final file |
|---|---|---|
| Filename | modeM0/AS1A11_075T01_9000005244_36846cztM0_level2.evt | modeM0/AS1A11_075T01_9000005244_36846cztM0_level2_quad_clean.evt |
| Size (bytes) | 353,088,000 | 57,337,920 |
| Size | 336.7 MB | 54.7 MB |
| Events in quadrant A | 2,834,330 | 443,711 |
| Events in quadrant B | 886,616 | 7,343 |
| Events in quadrant C | 2,986,364 | 452,197 |
| Events in quadrant D | 3,584,594 | 424,747 |
| Mode SS | |||
|---|---|---|---|
| Quadrant | BADHDUFLAG | Total packets | Discarded packets |
| A | 0 | 120 | 0 |
| B | 0 | 120 | 0 |
| C | 0 | 120 | 0 |
| D | 0 | 120 | 0 |
| Mode M0 | |||
|---|---|---|---|
| Quadrant | BADHDUFLAG | Total packets | Discarded packets |
| A | 0 | 12039 | 3 |
| B | 0 | 5901 | 2 |
| C | 0 | 12307 | 2 |
| D | 0 | 14622 | 2 |
| Mode M9 | |||
|---|---|---|---|
| Quadrant | BADHDUFLAG | Total packets | Discarded packets |
| A | 0 | 16 | 0 |
| B | 0 | 16 | 0 |
| C | 0 | 16 | 0 |
| D | 0 | 17 | 0 |
| Quadrant | Total seconds | Saturated seconds | Saturation percentage |
|---|---|---|---|
| A | 5802 | 17 | 0.293002% |
| B | 5802 | 5802 | 100.000000% |
| C | 5802 | 31 | 0.534299% |
| D | 5802 | 197 | 3.395381% |
Noise dominated data is calculated using 1-second bins in cleaned event files. If a bin has >2000 counts, and if more than 50% of those come from <1% of pixels, then it is considered to be noise-dominated and hence unusable.
| Quadrant | # 1 sec bins | Bins with >0 counts | Bins with >2000 counts | High rate bins dominated by noise | Noise dominated (total time) | Noise dominated (detector-on time) | Marked lightcurve |
|---|---|---|---|---|---|---|---|
| A | 7115 | 5803 | 10 | 10 | 0.14% | 0.17% | 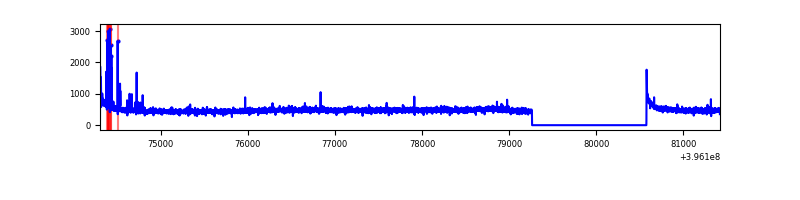 |
| B | 7114 | 5801 | 0 | 0 | 0.00% | 0.00% | 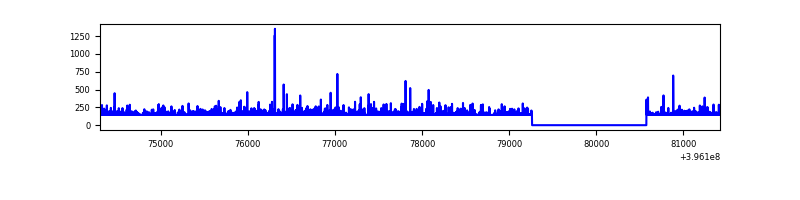 |
| C | 7115 | 5803 | 27 | 27 | 0.38% | 0.47% | 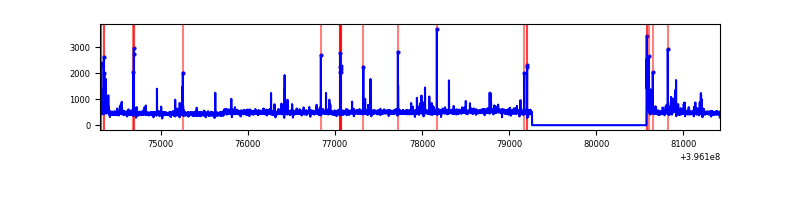 |
| D | 7115 | 5803 | 155 | 155 | 2.18% | 2.67% | 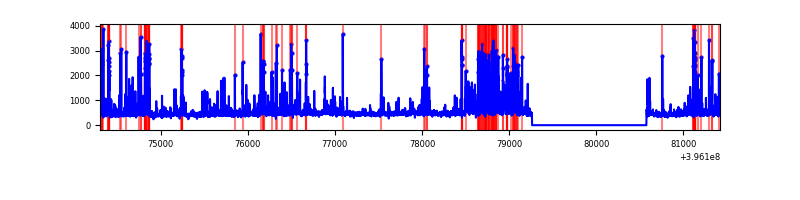 |
Top three noisy pixels from each quadrant. If the there are fewer than three noisy pixels in the level2.evt file, extra rows are filled as -1
| Pixel properties | Quadrant properties | ||||||
|---|---|---|---|---|---|---|---|
| Quadrant | DetID | PixID | Counts | Sigma | Mean | Median | Sigma |
| A | 10 | 83 | 233422 | 1758.53 | 651 | 637 | 132.4 |
| A | 15 | 223 | 55846 | 417.07 | 651 | 637 | 132.4 |
| A | 13 | 6 | 19067 | 139.23 | 651 | 637 | 132.4 |
| B | 12 | 243 | 803559 | 182297.61 | 12 | 12 | 4.4 |
| B | 12 | 144 | 15503 | 3514.38 | 12 | 12 | 4.4 |
| B | 5 | 255 | 8847 | 2004.36 | 12 | 12 | 4.4 |
| C | 15 | 214 | 252030 | 1695.74 | 633 | 637 | 148.2 |
| C | 0 | 10 | 126875 | 851.52 | 633 | 637 | 148.2 |
| C | 14 | 254 | 90487 | 606.07 | 633 | 637 | 148.2 |
| D | 13 | 171 | 604248 | 3873.16 | 628 | 610 | 155.9 |
| D | 1 | 52 | 159420 | 1018.98 | 628 | 610 | 155.9 |
| D | 2 | 250 | 99338 | 633.48 | 628 | 610 | 155.9 |
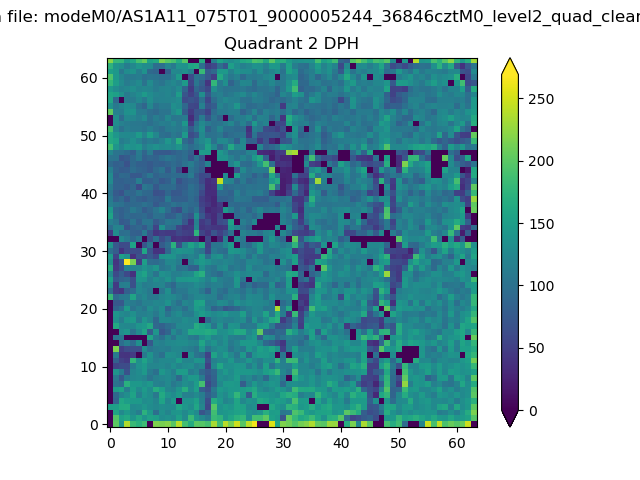
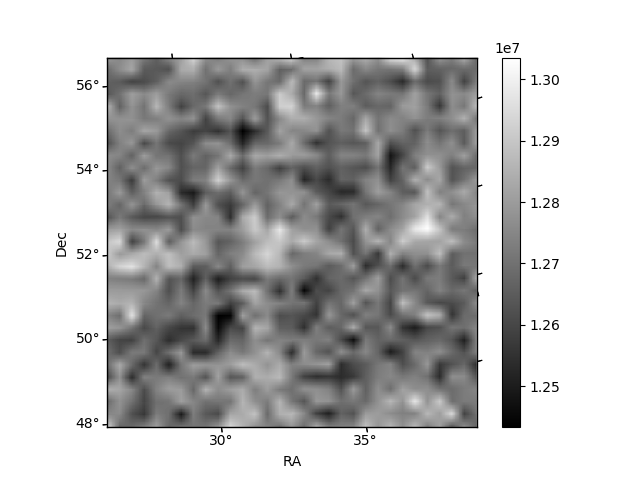
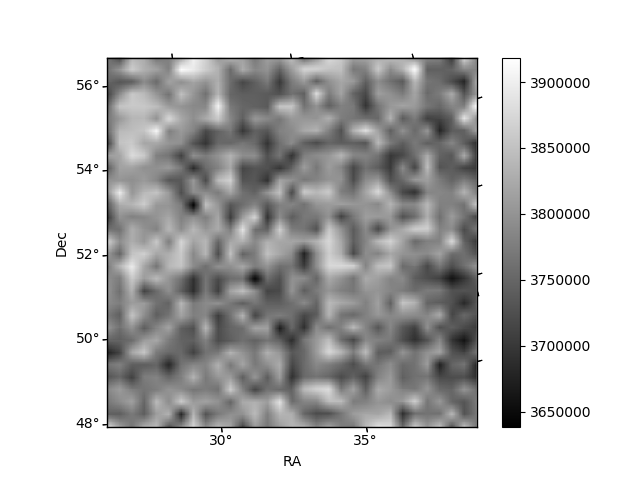
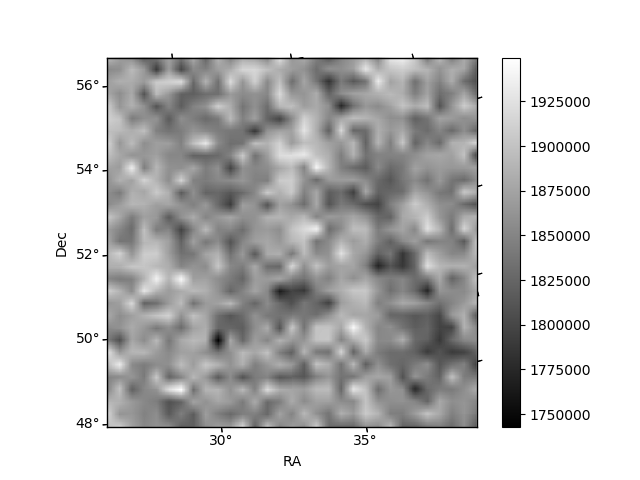
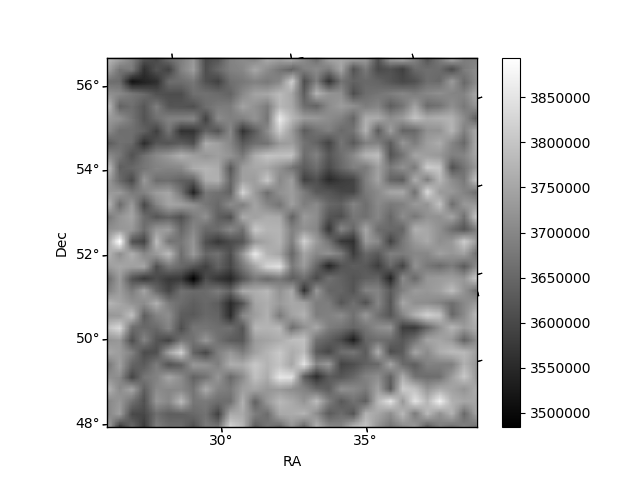
Histogram calculated using DETX and DETY for each event in the final _common_clean file
| Quadrant A | 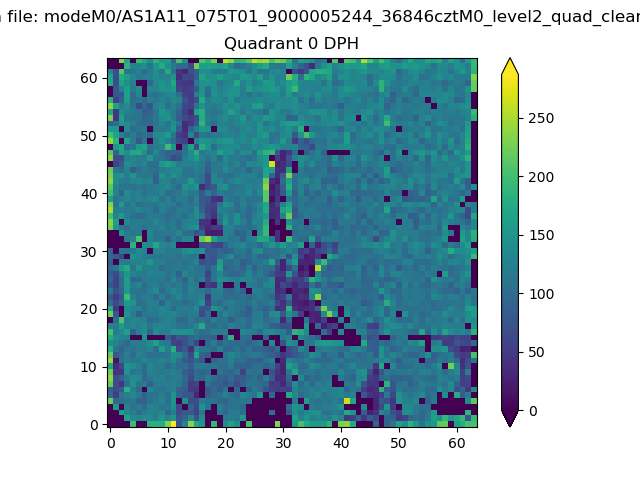 |
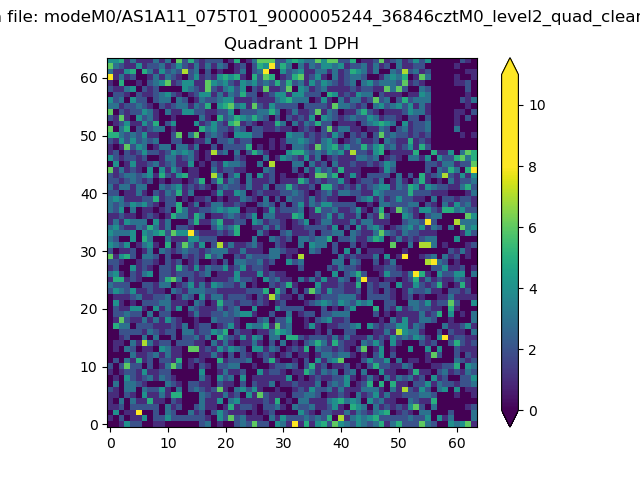 |
Quadrant B |
|---|---|---|---|
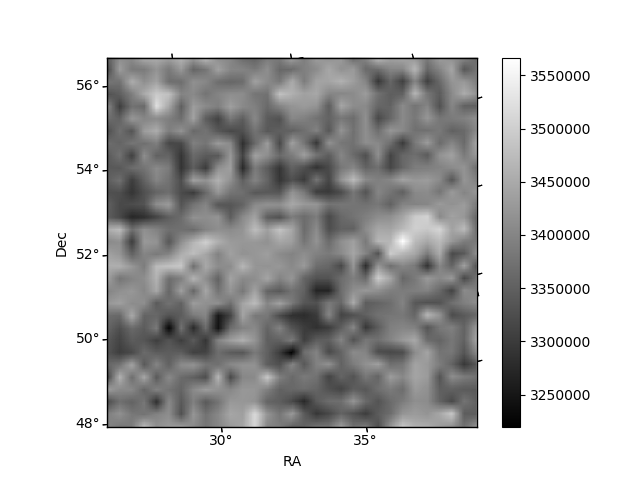
| Quadrant D | 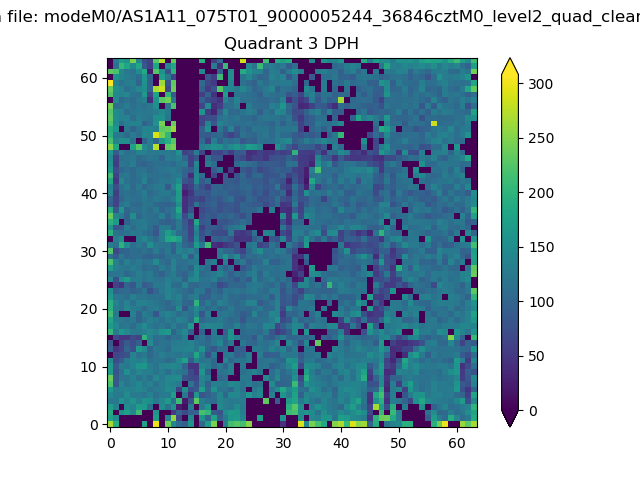 |
 |
Quadrant C |
| Plot type | Count rate plots | Images |
|---|---|---|
| Comparison with Poisson distribution Blue bars denote a histogram of data divided into 1 sec bins. Red curve is a Poisson curve with rate = median count rate of data. |
 |
 |
| Quadrant-wise count rates Data is divided into 100 sec bins |
 |
|
| Module-wise count rates for Quadrant A Data is divided into 100 sec bins |
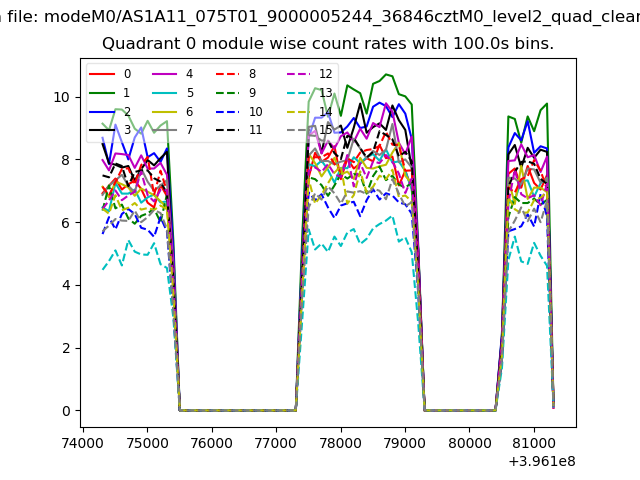 |
 |
| Module-wise count rates for Quadrant B Data is divided into 100 sec bins |
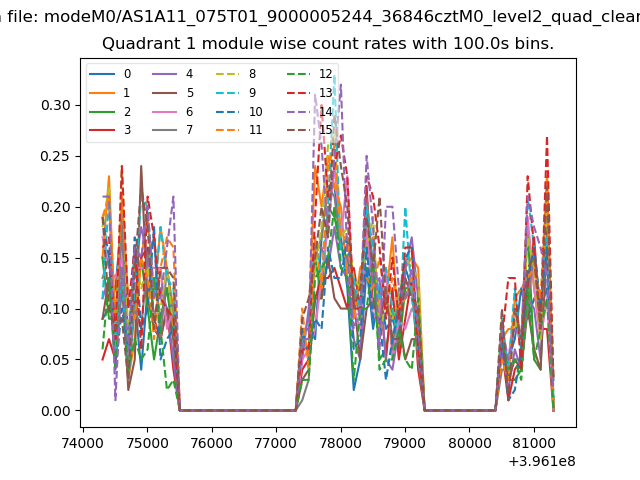 |
 |
| Module-wise count rates for Quadrant C Data is divided into 100 sec bins |
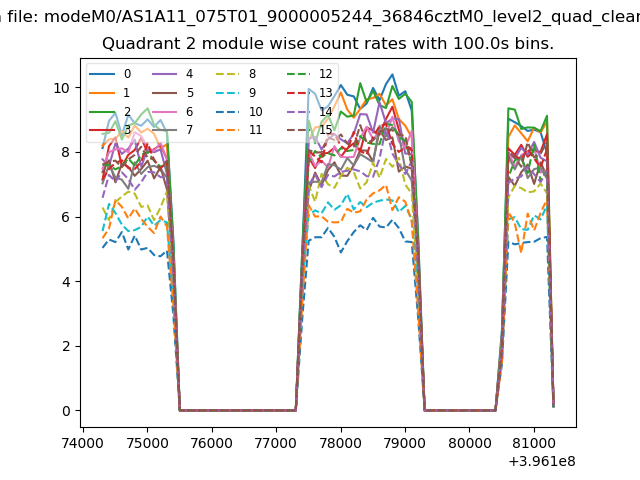 |
 |
| Module-wise count rates for Quadrant D Data is divided into 100 sec bins |
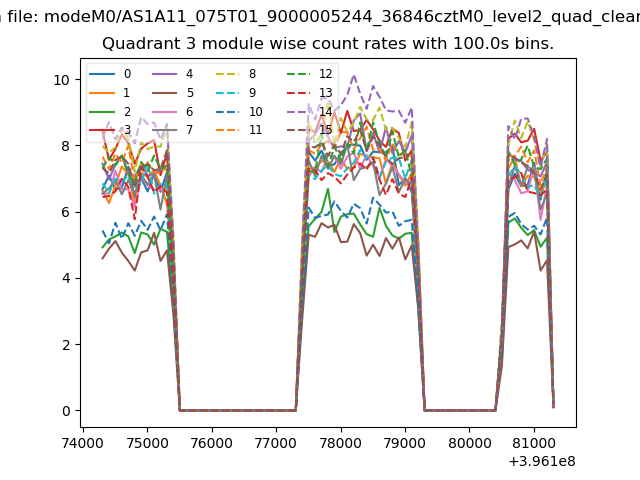 |
 |
| Parameter | Plot |
|---|---|
| CZT HV Monitor | 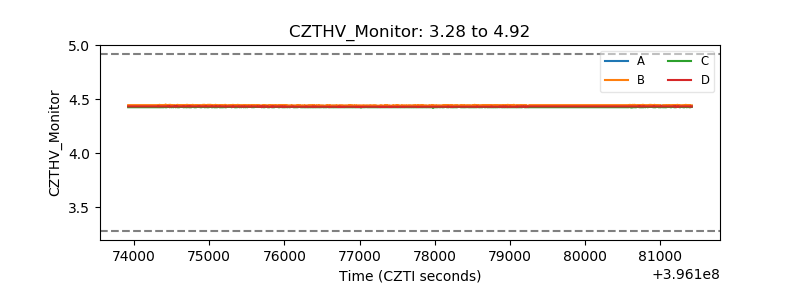 |
| D_VDD | 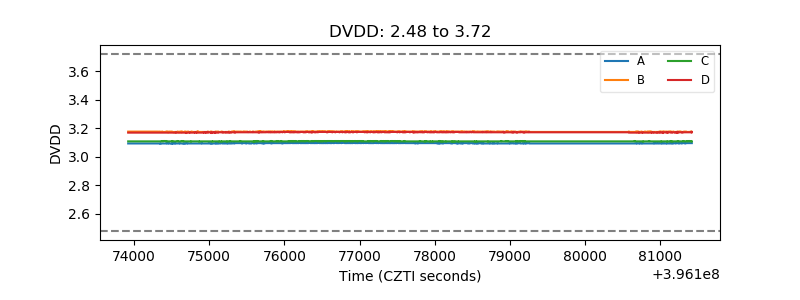 |
| Temperature 1 | 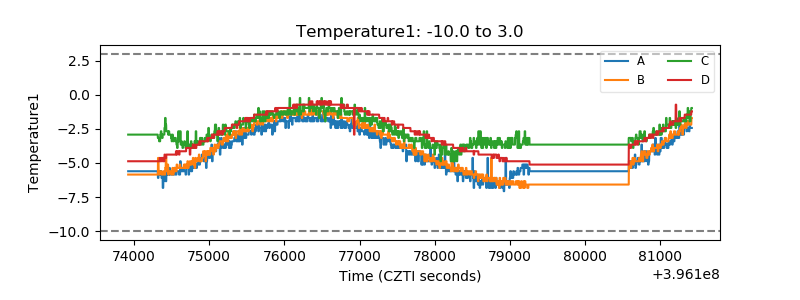 |
| Veto HV Monitor | 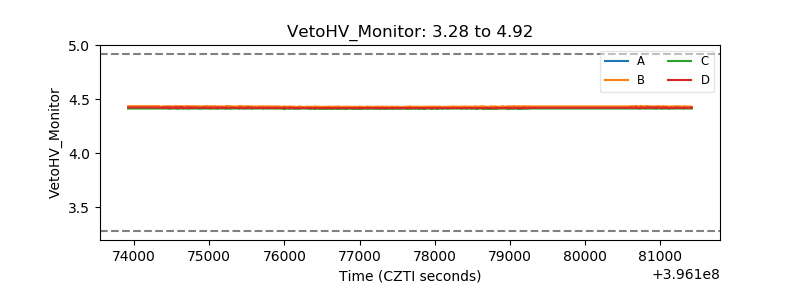 |
| Veto LLD | 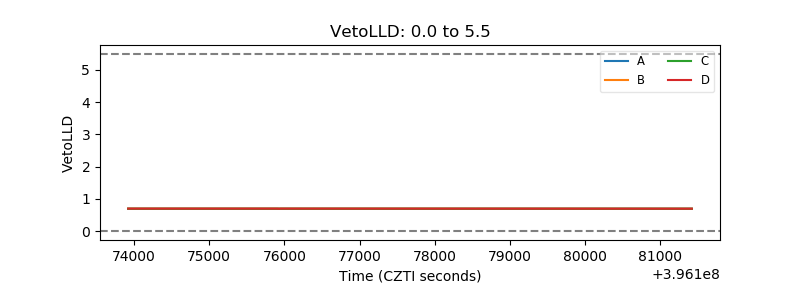 |
| Alpha Counter | 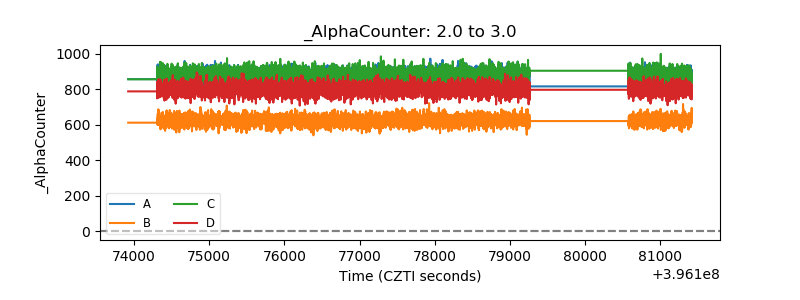 |
| _CPM_Rate |  |
| CZT Counter | 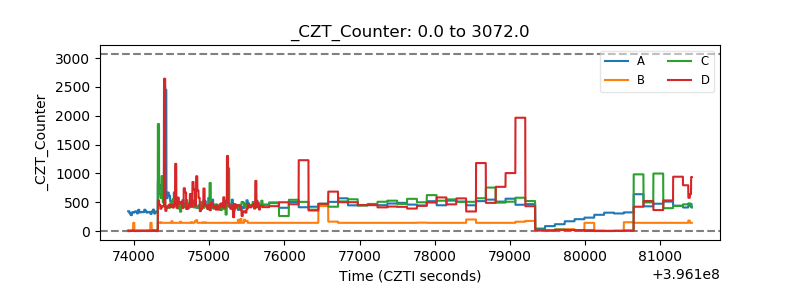 |
| +2.5 Volts monitor |  |
| +5 Volts monitor |  |
| _ROLL_ROT | 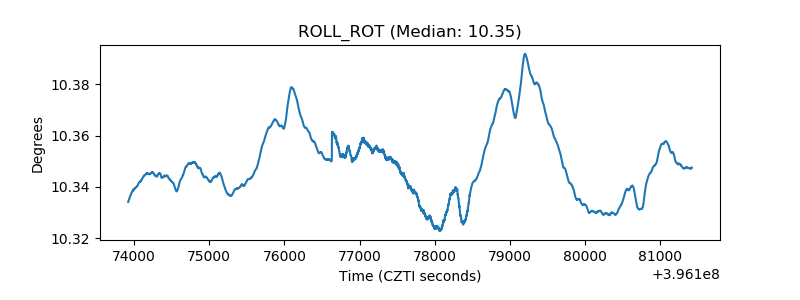 |
| _Roll_DEC | 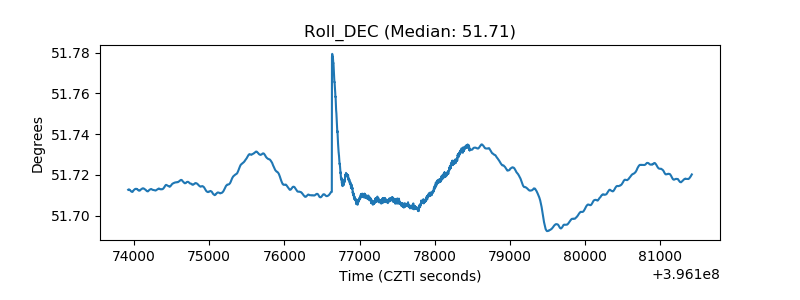 |
| _Roll_RA | 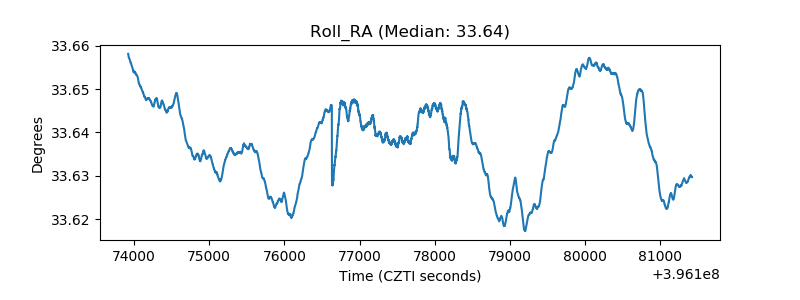 |
| Veto Counter | 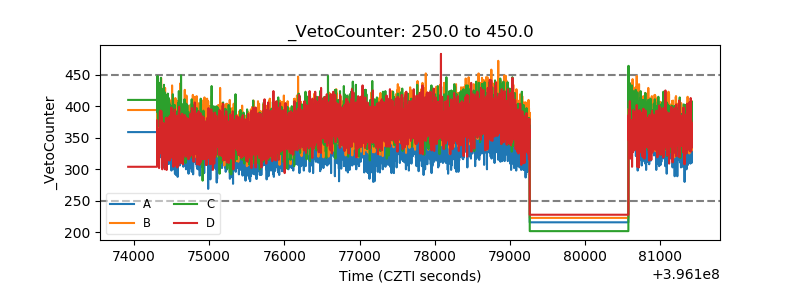 |