| Param | Original file | Final file |
|---|---|---|
| Filename | modeM0/AS1A11_075T01_9000005244_36848cztM0_level2.evt | modeM0/AS1A11_075T01_9000005244_36848cztM0_level2_quad_clean.evt |
| Size (bytes) | 662,904,000 | 93,692,160 |
| Size | 632.2 MB | 89.4 MB |
| Events in quadrant A | 5,322,762 | 705,805 |
| Events in quadrant B | 1,643,128 | 11,968 |
| Events in quadrant C | 5,986,128 | 700,587 |
| Events in quadrant D | 6,388,408 | 675,452 |
| Mode SS | |||
|---|---|---|---|
| Quadrant | BADHDUFLAG | Total packets | Discarded packets |
| A | 0 | 218 | 0 |
| B | 0 | 218 | 0 |
| C | 0 | 218 | 0 |
| D | 0 | 218 | 0 |
| Mode M0 | |||
|---|---|---|---|
| Quadrant | BADHDUFLAG | Total packets | Discarded packets |
| A | 0 | 22364 | 4 |
| B | 0 | 10897 | 3 |
| C | 0 | 24237 | 3 |
| D | 0 | 26210 | 3 |
| Mode M9 | |||
|---|---|---|---|
| Quadrant | BADHDUFLAG | Total packets | Discarded packets |
| A | 0 | 28 | 0 |
| B | 0 | 28 | 0 |
| C | 0 | 28 | 0 |
| D | 0 | 29 | 0 |
| Quadrant | Total seconds | Saturated seconds | Saturation percentage |
|---|---|---|---|
| A | 10690 | 22 | 0.205800% |
| B | 10690 | 10690 | 100.000000% |
| C | 10690 | 154 | 1.440599% |
| D | 10690 | 269 | 2.516370% |
Noise dominated data is calculated using 1-second bins in cleaned event files. If a bin has >2000 counts, and if more than 50% of those come from <1% of pixels, then it is considered to be noise-dominated and hence unusable.
| Quadrant | # 1 sec bins | Bins with >0 counts | Bins with >2000 counts | High rate bins dominated by noise | Noise dominated (total time) | Noise dominated (detector-on time) | Marked lightcurve |
|---|---|---|---|---|---|---|---|
| A | 13526 | 10692 | 2 | 2 | 0.01% | 0.02% | 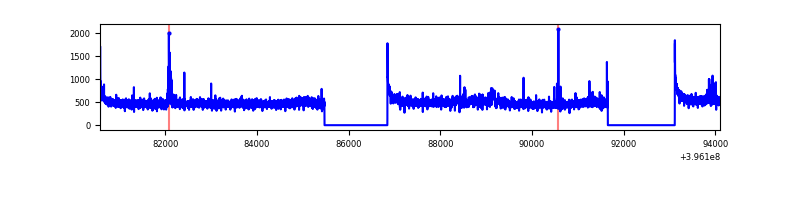 |
| B | 13525 | 10689 | 0 | 0 | 0.00% | 0.00% | 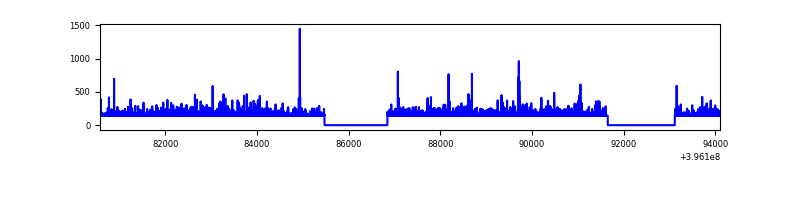 |
| C | 13526 | 10692 | 111 | 111 | 0.82% | 1.04% | 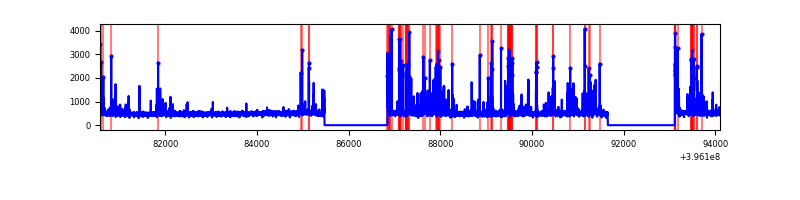 |
| D | 13526 | 10692 | 228 | 228 | 1.69% | 2.13% | 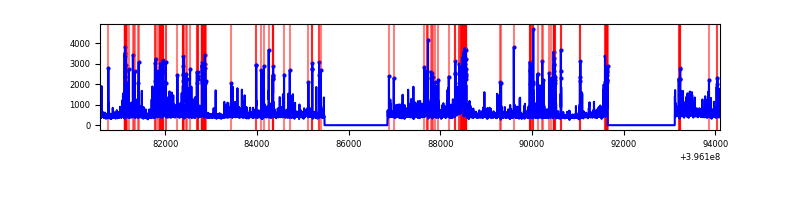 |
Top three noisy pixels from each quadrant. If the there are fewer than three noisy pixels in the level2.evt file, extra rows are filled as -1
| Pixel properties | Quadrant properties | ||||||
|---|---|---|---|---|---|---|---|
| Quadrant | DetID | PixID | Counts | Sigma | Mean | Median | Sigma |
| A | 10 | 83 | 415940 | 1688.71 | 1216 | 1195 | 245.6 |
| A | 7 | 192 | 105210 | 423.52 | 1216 | 1195 | 245.6 |
| A | 15 | 174 | 44576 | 176.63 | 1216 | 1195 | 245.6 |
| B | 12 | 243 | 1479799 | 209301.24 | 25 | 24 | 7.1 |
| B | 12 | 144 | 28399 | 4013.4 | 25 | 24 | 7.1 |
| B | 0 | 213 | 10143 | 1431.24 | 25 | 24 | 7.1 |
| C | 14 | 254 | 652801 | 2392.63 | 1175 | 1183 | 272.3 |
| C | 15 | 214 | 460775 | 1687.54 | 1175 | 1183 | 272.3 |
| C | 0 | 10 | 273166 | 998.68 | 1175 | 1183 | 272.3 |
| D | 13 | 171 | 454489 | 1590.98 | 1176 | 1146 | 284.9 |
| D | 1 | 52 | 316787 | 1107.72 | 1176 | 1146 | 284.9 |
| D | 12 | 233 | 312357 | 1092.17 | 1176 | 1146 | 284.9 |
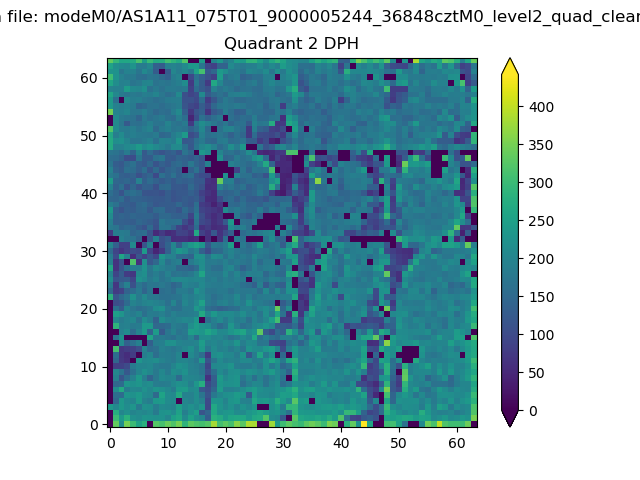
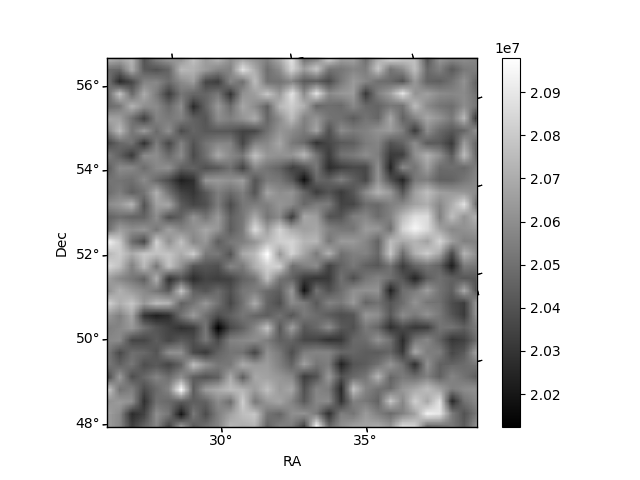
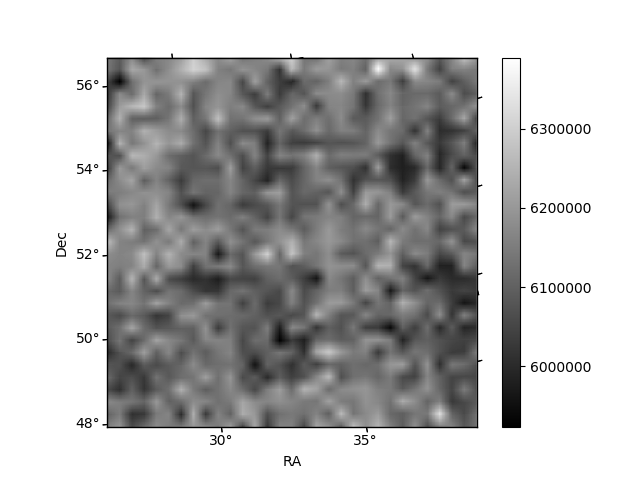
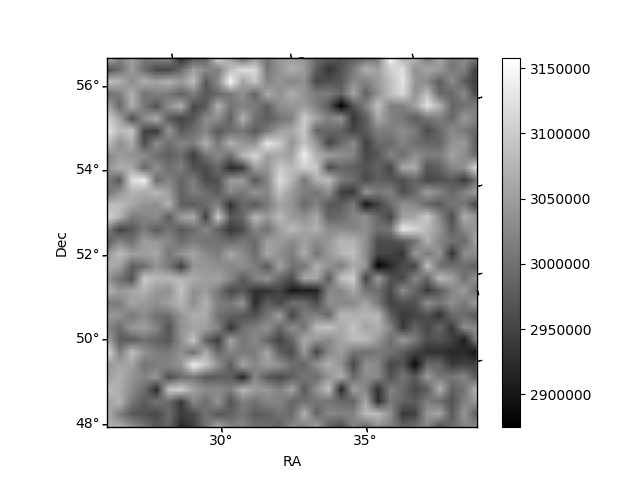
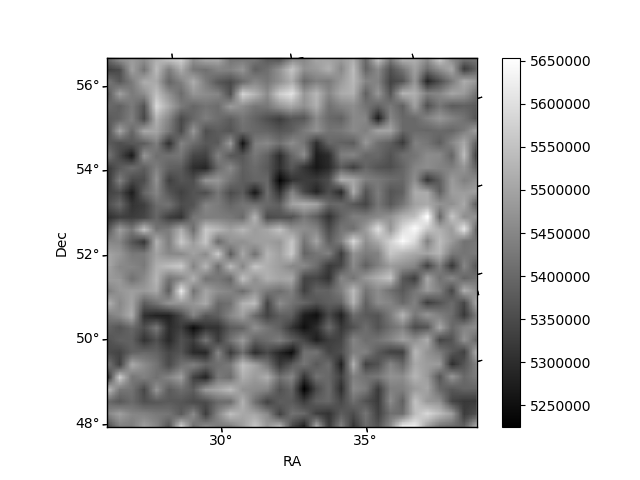
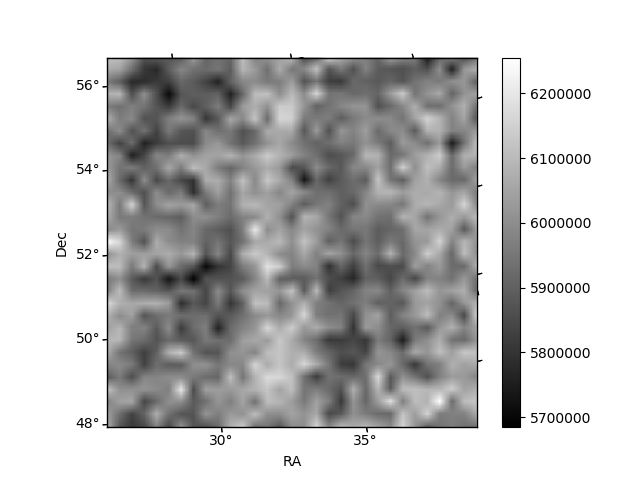
Histogram calculated using DETX and DETY for each event in the final _common_clean file
| Quadrant A | 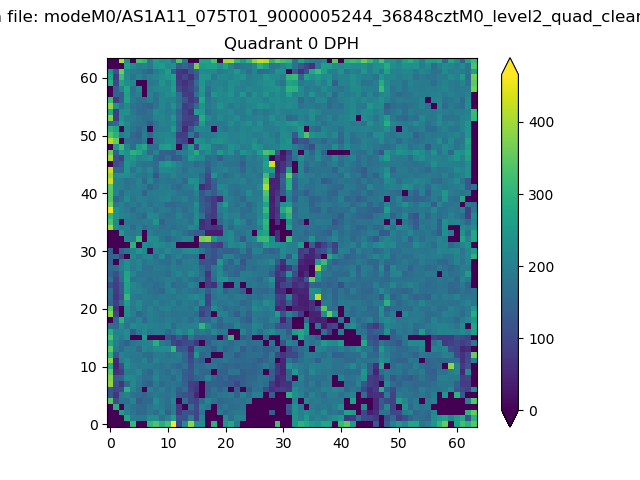 |
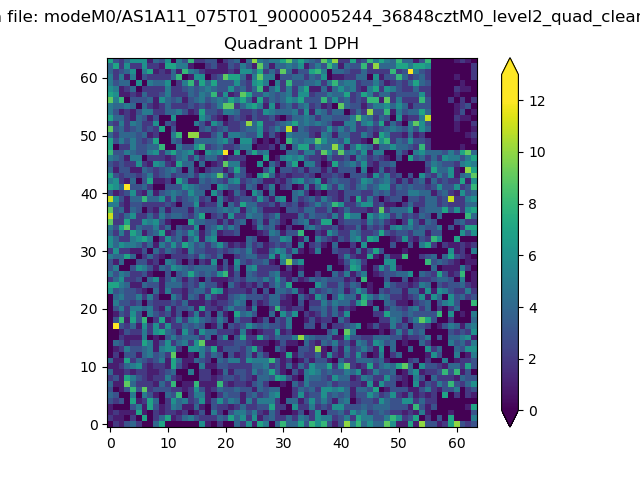 |
Quadrant B |
|---|---|---|---|
| Quadrant D | 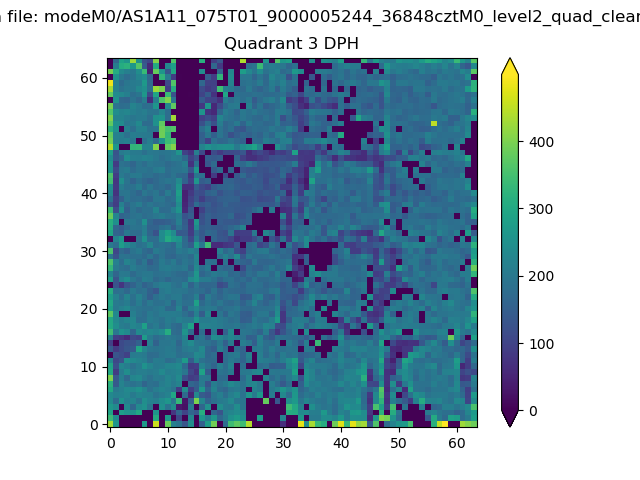 |
 |
Quadrant C |
| Plot type | Count rate plots | Images |
|---|---|---|
| Comparison with Poisson distribution Blue bars denote a histogram of data divided into 1 sec bins. Red curve is a Poisson curve with rate = median count rate of data. |
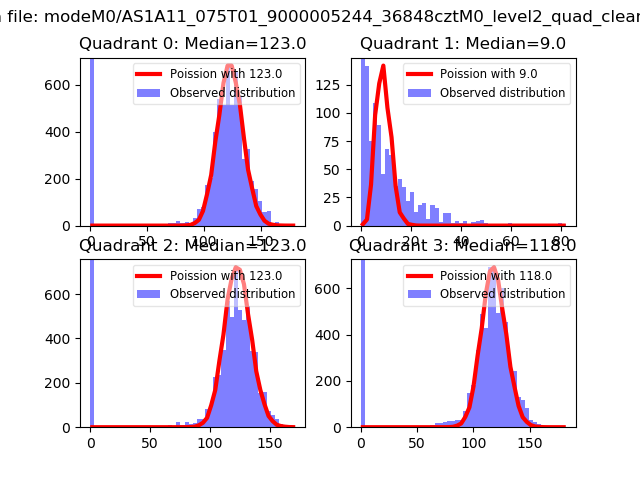 |
 |
| Quadrant-wise count rates Data is divided into 100 sec bins |
 |
|
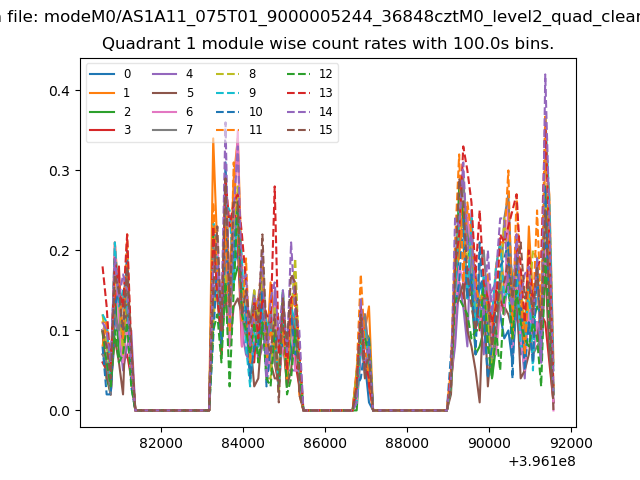
| Module-wise count rates for Quadrant A Data is divided into 100 sec bins |
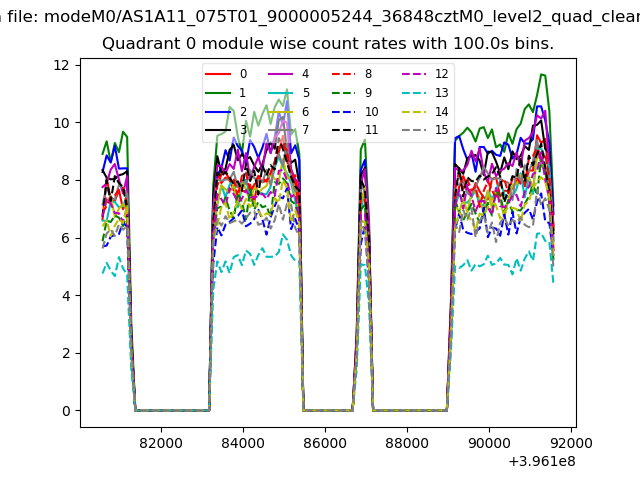 |
 |
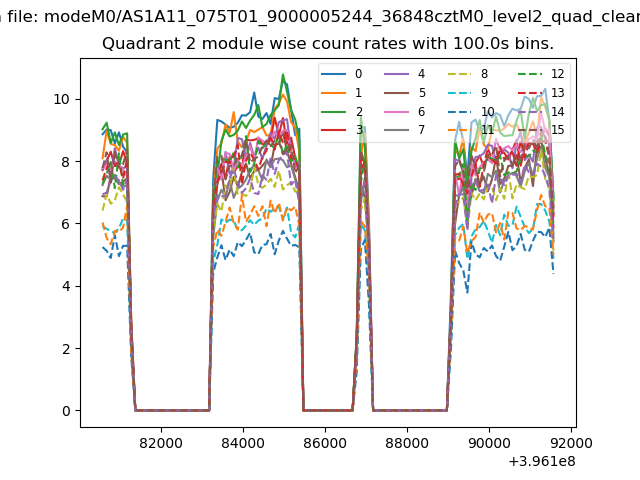
| Module-wise count rates for Quadrant B Data is divided into 100 sec bins |
 |
 |
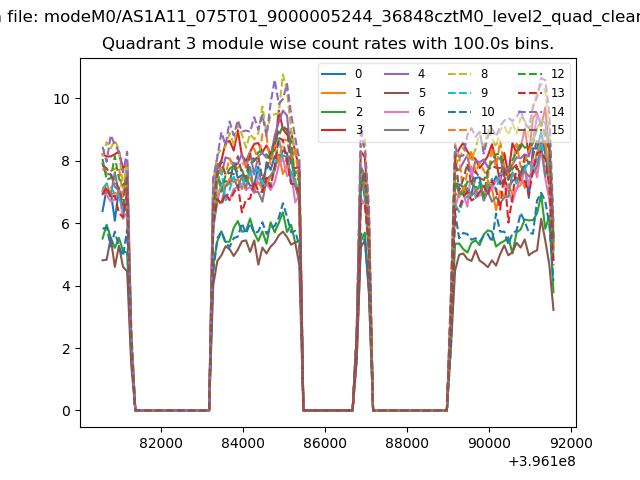
| Module-wise count rates for Quadrant C Data is divided into 100 sec bins |
 |
 |
| Module-wise count rates for Quadrant D Data is divided into 100 sec bins |
 |
 |
| Parameter | Plot |
|---|---|
| CZT HV Monitor | 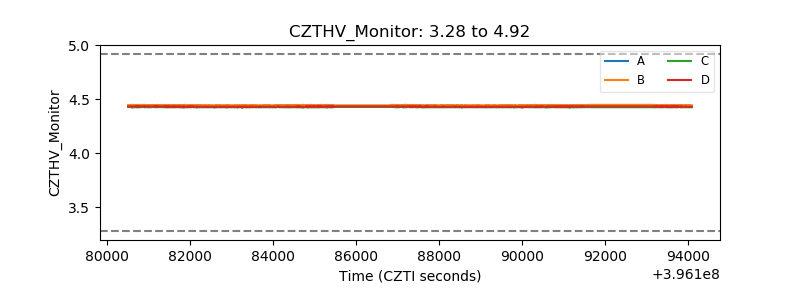 |
| D_VDD | 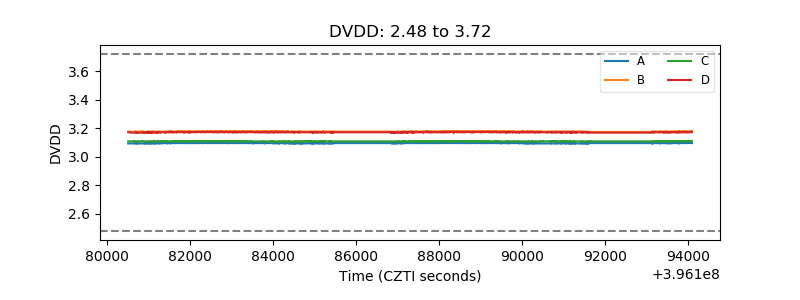 |
| Temperature 1 | 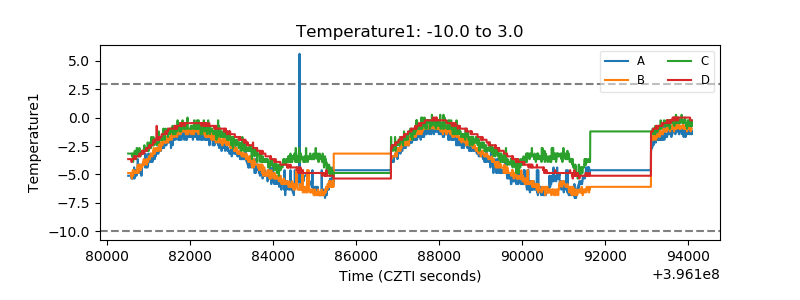 |
| Veto HV Monitor |  |
| Veto LLD | 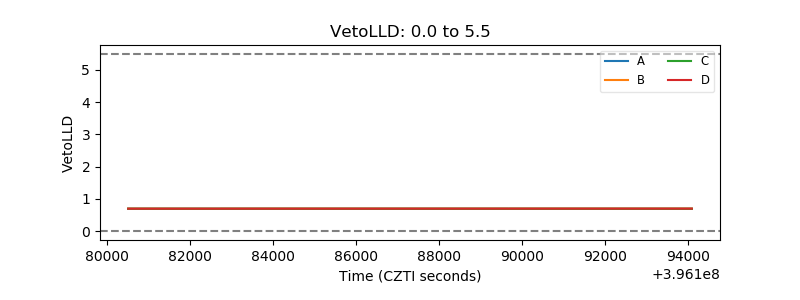 |
| Alpha Counter | 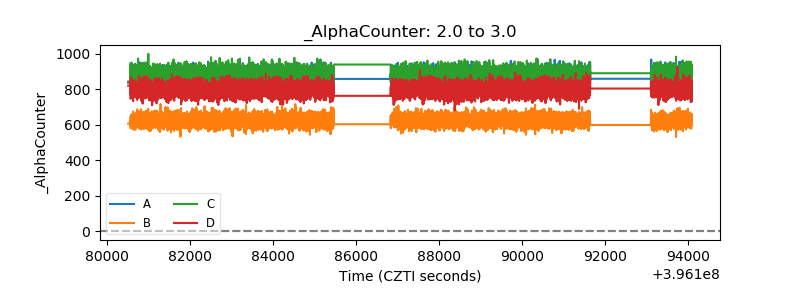 |
| _CPM_Rate | 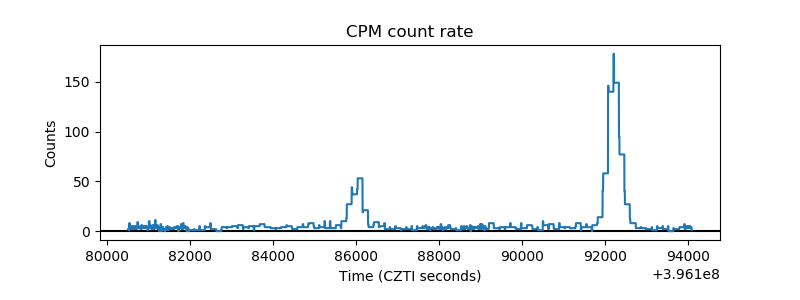 |
| CZT Counter | 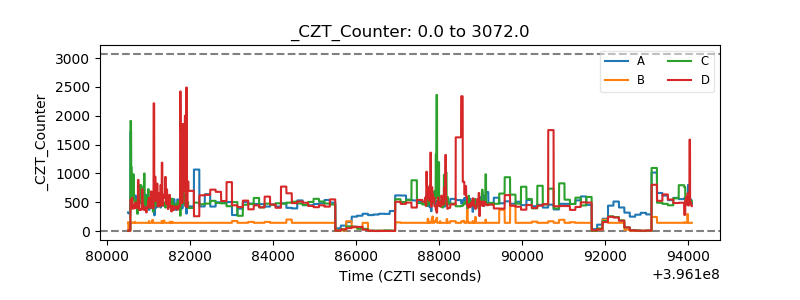 |
| +2.5 Volts monitor |  |
| +5 Volts monitor |  |
| _ROLL_ROT | 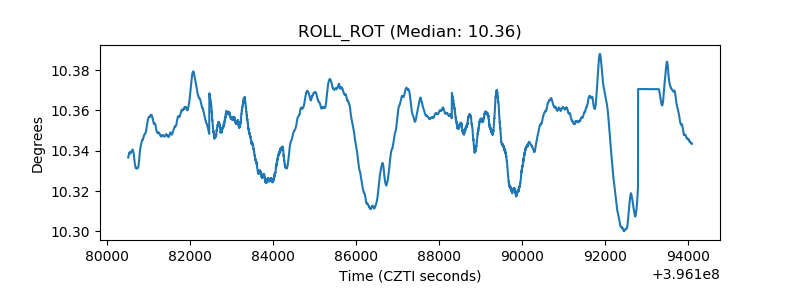 |
| _Roll_DEC | 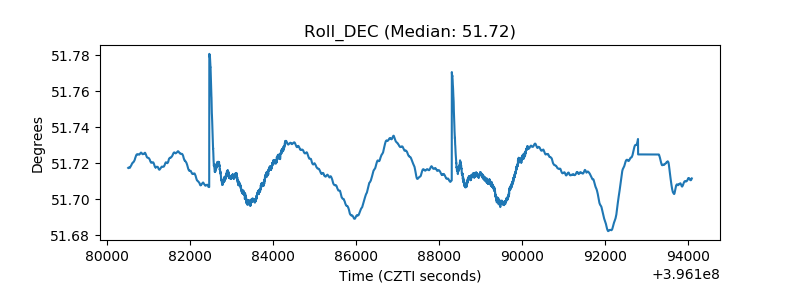 |
| _Roll_RA | 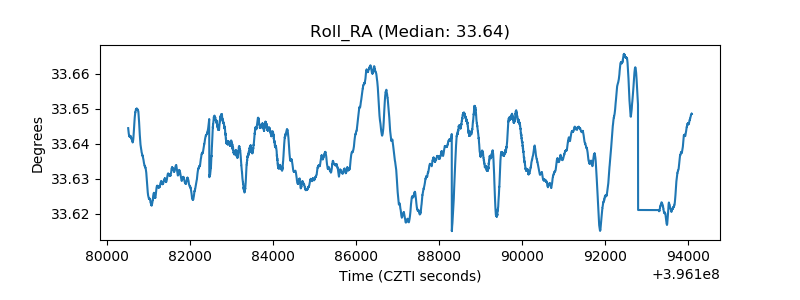 |
| Veto Counter | 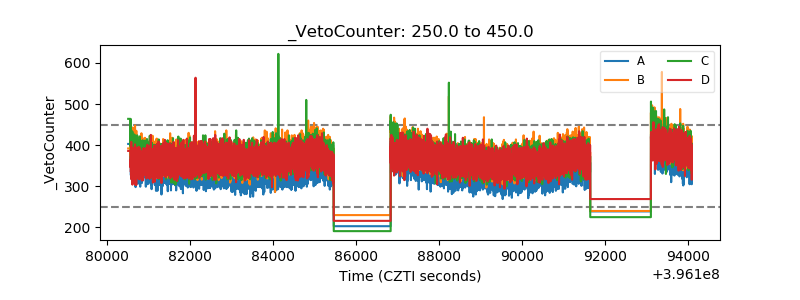 |