| Param | Original file | Final file |
|---|---|---|
| Filename | modeM0/AS1A11_075T01_9000005244_36849cztM0_level2.evt | modeM0/AS1A11_075T01_9000005244_36849cztM0_level2_quad_clean.evt |
| Size (bytes) | 356,247,360 | 47,240,640 |
| Size | 339.7 MB | 45.1 MB |
| Events in quadrant A | 2,896,730 | 346,806 |
| Events in quadrant B | 886,226 | 5,901 |
| Events in quadrant C | 3,169,857 | 343,383 |
| Events in quadrant D | 3,442,049 | 333,801 |
| Mode SS | |||
|---|---|---|---|
| Quadrant | BADHDUFLAG | Total packets | Discarded packets |
| A | 0 | 116 | 0 |
| B | 0 | 116 | 0 |
| C | 0 | 116 | 0 |
| D | 0 | 116 | 0 |
| Mode M0 | |||
|---|---|---|---|
| Quadrant | BADHDUFLAG | Total packets | Discarded packets |
| A | 0 | 12238 | 3 |
| B | 0 | 5841 | 2 |
| C | 0 | 12817 | 2 |
| D | 0 | 14106 | 2 |
| Mode M9 | |||
|---|---|---|---|
| Quadrant | BADHDUFLAG | Total packets | Discarded packets |
| A | 0 | 18 | 0 |
| B | 0 | 18 | 0 |
| C | 0 | 18 | 0 |
| D | 0 | 19 | 0 |
| Quadrant | Total seconds | Saturated seconds | Saturation percentage |
|---|---|---|---|
| A | 5702 | 15 | 0.263066% |
| B | 5702 | 5702 | 100.000000% |
| C | 5702 | 63 | 1.104875% |
| D | 5702 | 173 | 3.034023% |
Noise dominated data is calculated using 1-second bins in cleaned event files. If a bin has >2000 counts, and if more than 50% of those come from <1% of pixels, then it is considered to be noise-dominated and hence unusable.
| Quadrant | # 1 sec bins | Bins with >0 counts | Bins with >2000 counts | High rate bins dominated by noise | Noise dominated (total time) | Noise dominated (detector-on time) | Marked lightcurve |
|---|---|---|---|---|---|---|---|
| A | 7285 | 5703 | 1 | 1 | 0.01% | 0.02% | 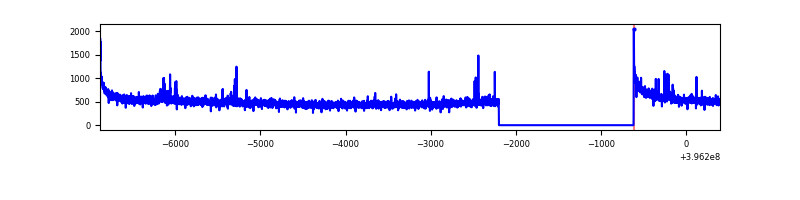 |
| B | 7284 | 5701 | 2 | 2 | 0.03% | 0.04% | 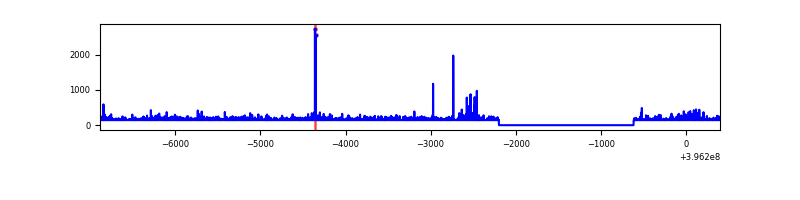 |
| C | 7285 | 5703 | 45 | 45 | 0.62% | 0.79% | 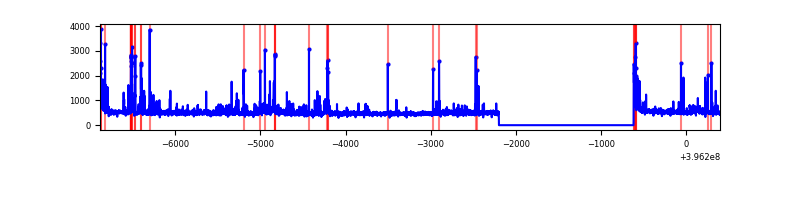 |
| D | 7285 | 5703 | 139 | 139 | 1.91% | 2.44% | 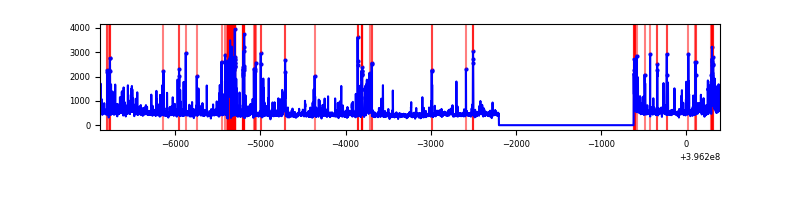 |
Top three noisy pixels from each quadrant. If the there are fewer than three noisy pixels in the level2.evt file, extra rows are filled as -1
| Pixel properties | Quadrant properties | ||||||
|---|---|---|---|---|---|---|---|
| Quadrant | DetID | PixID | Counts | Sigma | Mean | Median | Sigma |
| A | 10 | 83 | 254381 | 1886.25 | 657 | 643 | 134.5 |
| A | 7 | 192 | 42445 | 310.75 | 657 | 643 | 134.5 |
| A | 0 | 247 | 21747 | 156.88 | 657 | 643 | 134.5 |
| B | 12 | 243 | 788570 | 169613.4 | 14 | 13 | 4.6 |
| B | 12 | 144 | 14715 | 3162.3 | 14 | 13 | 4.6 |
| B | 0 | 213 | 11403 | 2449.91 | 14 | 13 | 4.6 |
| C | 15 | 214 | 247154 | 1654.38 | 636 | 640 | 149.0 |
| C | 0 | 10 | 208984 | 1398.22 | 636 | 640 | 149.0 |
| C | 14 | 254 | 183524 | 1227.35 | 636 | 640 | 149.0 |
| D | 13 | 171 | 453618 | 2884.07 | 635 | 617 | 157.1 |
| D | 2 | 250 | 83367 | 526.83 | 635 | 617 | 157.1 |
| D | 1 | 52 | 78068 | 493.1 | 635 | 617 | 157.1 |
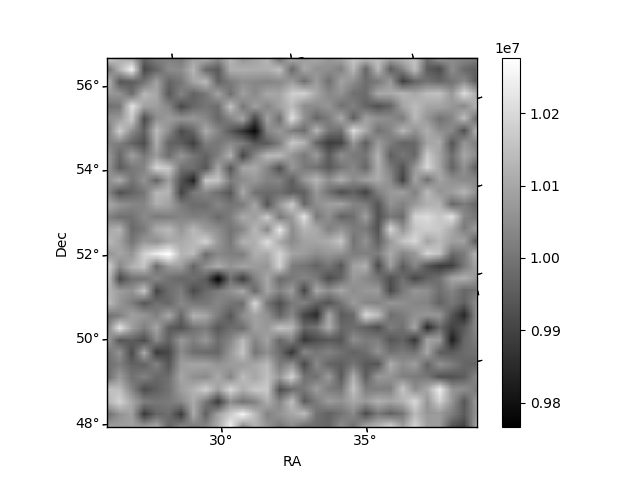
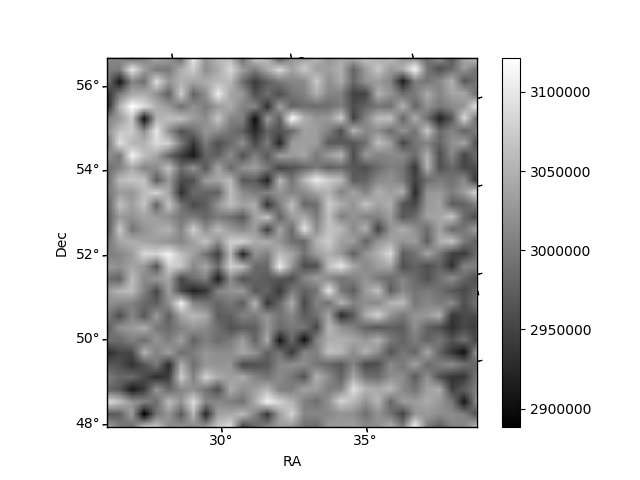
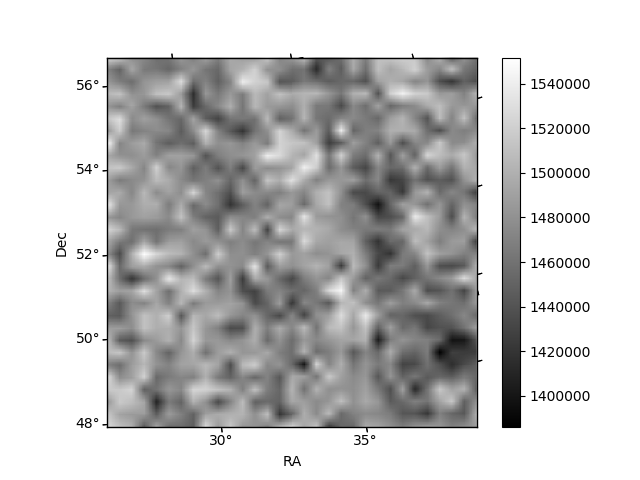
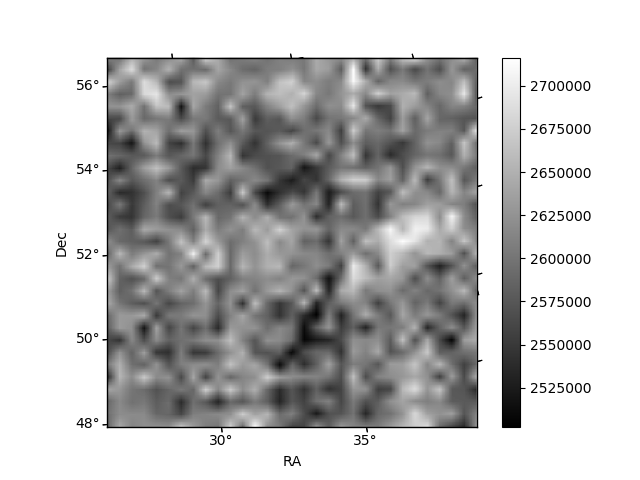
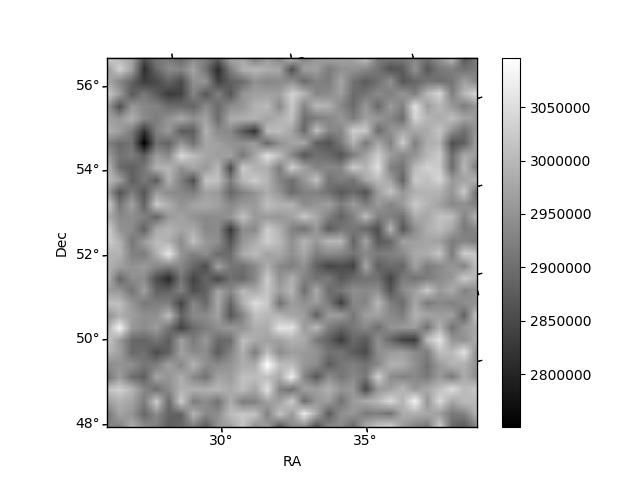
Histogram calculated using DETX and DETY for each event in the final _common_clean file
| Quadrant A |  |
 |
Quadrant B |
|---|---|---|---|
| Quadrant D |  |
 |
Quadrant C |
| Plot type | Count rate plots | Images |
|---|---|---|
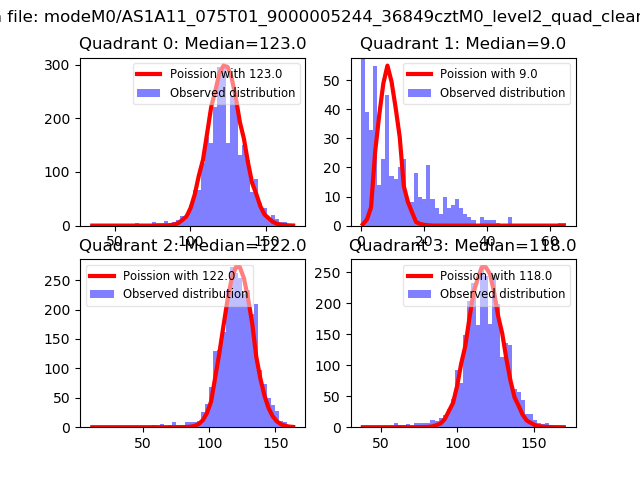
| Comparison with Poisson distribution Blue bars denote a histogram of data divided into 1 sec bins. Red curve is a Poisson curve with rate = median count rate of data. |
 |
 |
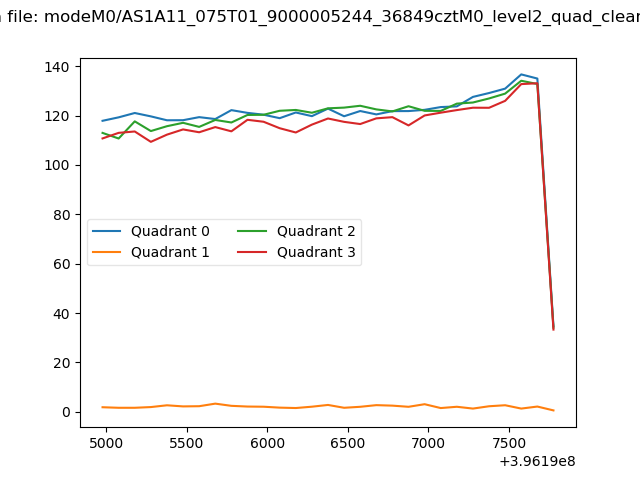
| Quadrant-wise count rates Data is divided into 100 sec bins |
 |
|
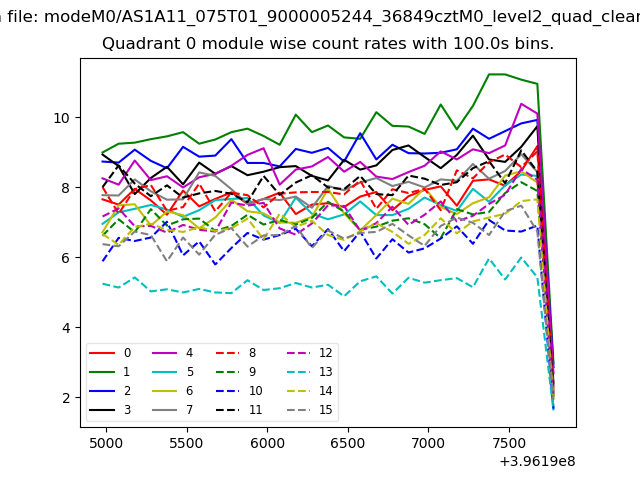
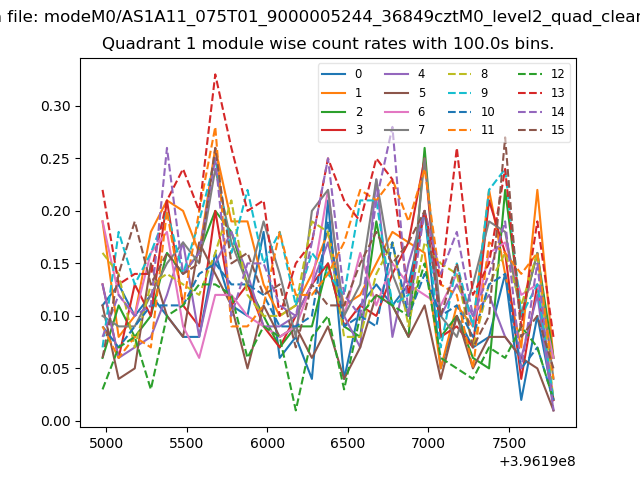
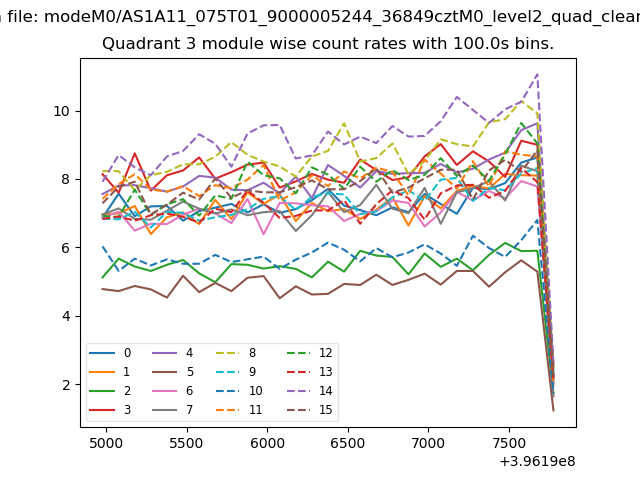
| Module-wise count rates for Quadrant A Data is divided into 100 sec bins |
 |
 |
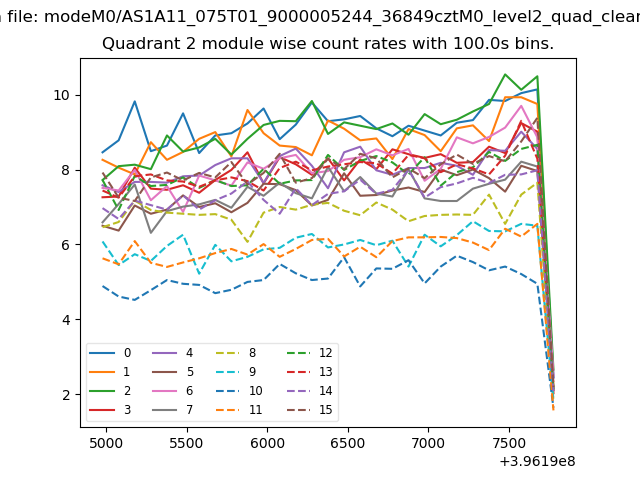
| Module-wise count rates for Quadrant B Data is divided into 100 sec bins |
 |
 |
| Module-wise count rates for Quadrant C Data is divided into 100 sec bins |
 |
 |
| Module-wise count rates for Quadrant D Data is divided into 100 sec bins |
 |
 |
| Parameter | Plot |
|---|---|
| CZT HV Monitor |  |
| D_VDD | 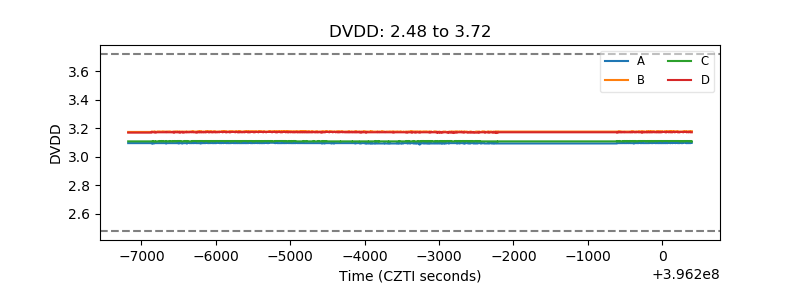 |
| Temperature 1 | 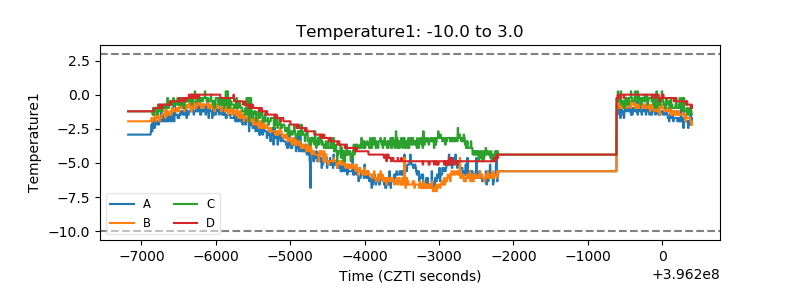 |
| Veto HV Monitor | 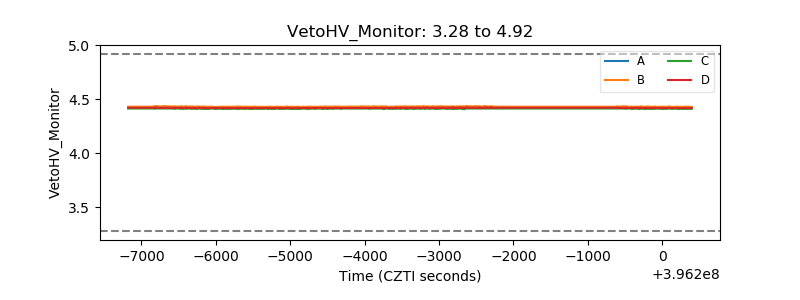 |
| Veto LLD | 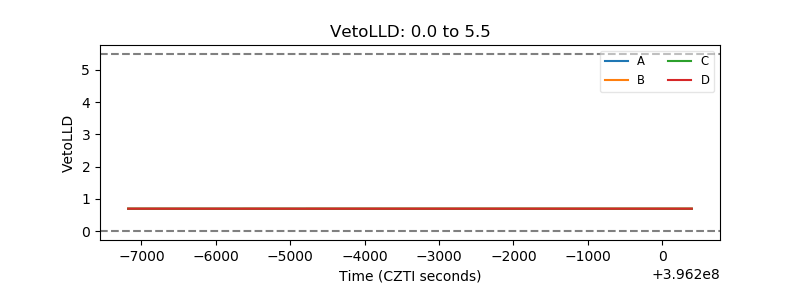 |
| Alpha Counter | 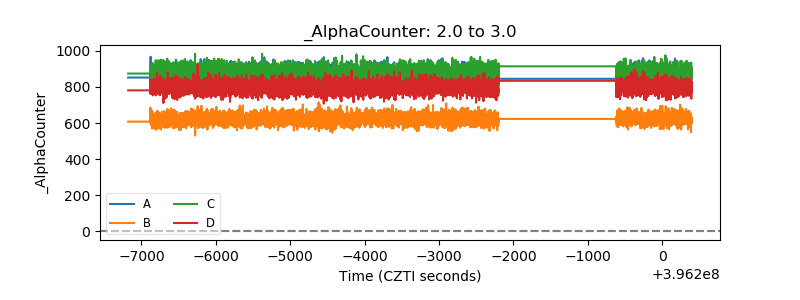 |
| _CPM_Rate | 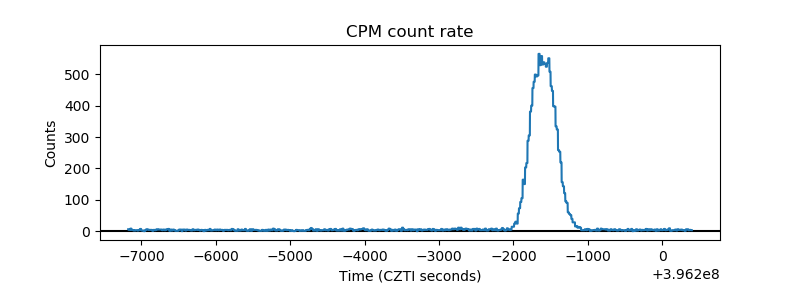 |
| CZT Counter | 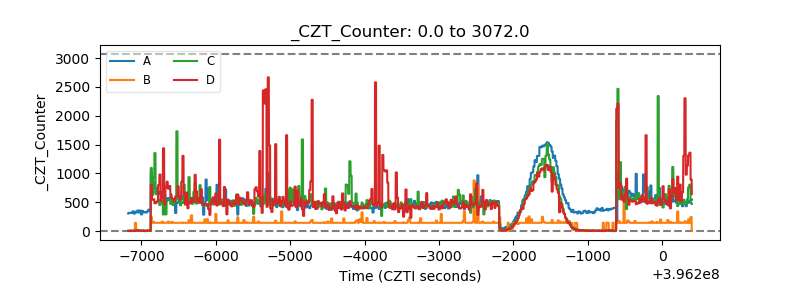 |
| +2.5 Volts monitor |  |
| +5 Volts monitor |  |
| _ROLL_ROT | 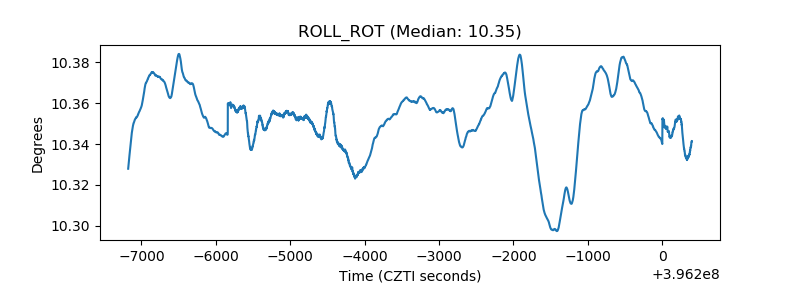 |
| _Roll_DEC | 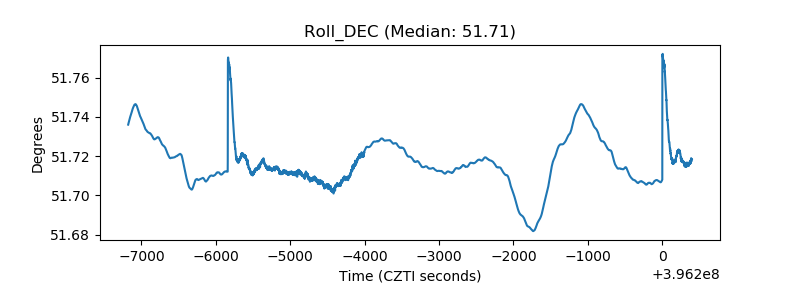 |
| _Roll_RA | 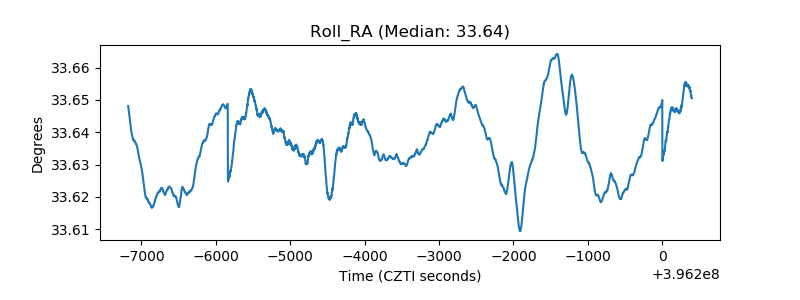 |
| Veto Counter | 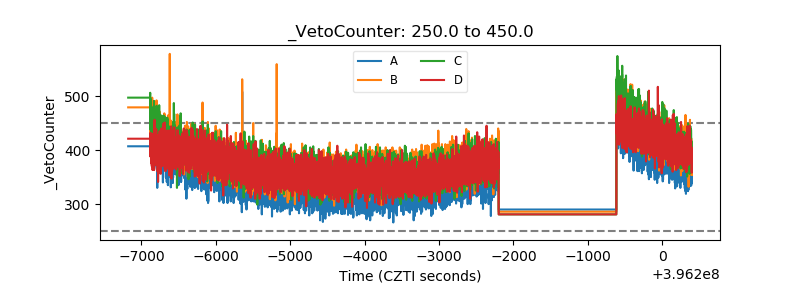 |