| Param | Original file | Final file |
|---|---|---|
| Filename | modeM0/AS1A11_075T01_9000005244_36852cztM0_level2.evt | modeM0/AS1A11_075T01_9000005244_36852cztM0_level2_quad_clean.evt |
| Size (bytes) | 421,971,840 | 57,525,120 |
| Size | 402.4 MB | 54.9 MB |
| Events in quadrant A | 2,768,454 | 467,122 |
| Events in quadrant B | 818,781 | 8,255 |
| Events in quadrant C | 2,903,128 | 474,223 |
| Events in quadrant D | 5,924,542 | 419,541 |
| Mode SS | |||
|---|---|---|---|
| Quadrant | BADHDUFLAG | Total packets | Discarded packets |
| A | 0 | 108 | 0 |
| B | 0 | 108 | 0 |
| C | 0 | 108 | 0 |
| D | 0 | 108 | 0 |
| Mode M0 | |||
|---|---|---|---|
| Quadrant | BADHDUFLAG | Total packets | Discarded packets |
| A | 0 | 11685 | 3 |
| B | 0 | 5404 | 2 |
| C | 0 | 11946 | 2 |
| D | 0 | 21279 | 2 |
| Mode M9 | |||
|---|---|---|---|
| Quadrant | BADHDUFLAG | Total packets | Discarded packets |
| A | 0 | 33 | 0 |
| B | 0 | 33 | 0 |
| C | 0 | 33 | 0 |
| D | 0 | 34 | 0 |
| Quadrant | Total seconds | Saturated seconds | Saturation percentage |
|---|---|---|---|
| A | 5289 | 30 | 0.567215% |
| B | 5289 | 5289 | 100.000000% |
| C | 5289 | 62 | 1.172244% |
| D | 5289 | 861 | 16.279070% |
Noise dominated data is calculated using 1-second bins in cleaned event files. If a bin has >2000 counts, and if more than 50% of those come from <1% of pixels, then it is considered to be noise-dominated and hence unusable.
| Quadrant | # 1 sec bins | Bins with >0 counts | Bins with >2000 counts | High rate bins dominated by noise | Noise dominated (total time) | Noise dominated (detector-on time) | Marked lightcurve |
|---|---|---|---|---|---|---|---|
| A | 7110 | 5290 | 7 | 7 | 0.10% | 0.13% | 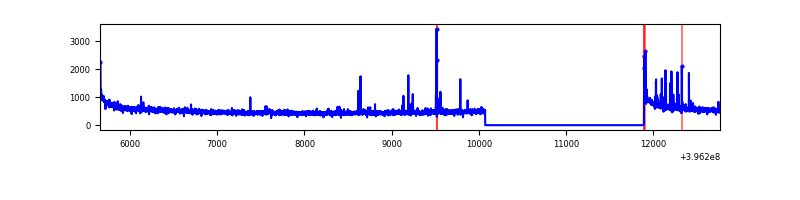 |
| B | 7109 | 5288 | 1 | 1 | 0.01% | 0.02% | 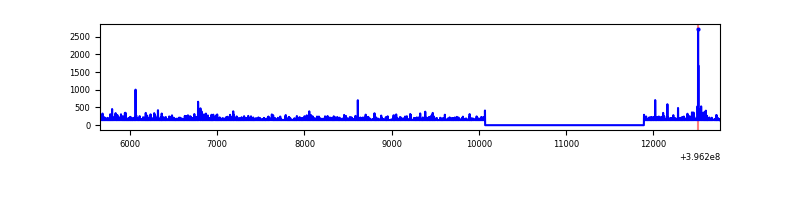 |
| C | 7110 | 5290 | 41 | 41 | 0.58% | 0.78% | 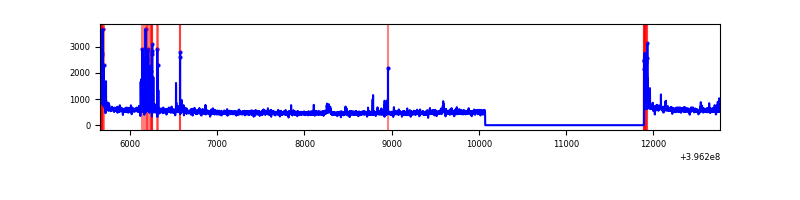 |
| D | 7110 | 5290 | 801 | 801 | 11.27% | 15.14% | 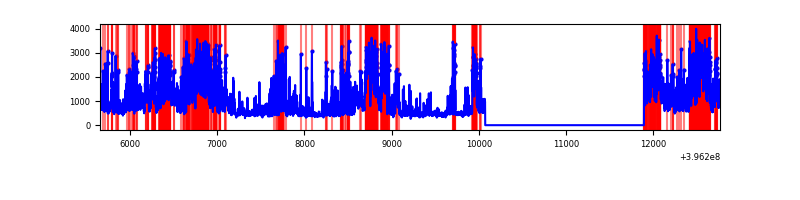 |
Top three noisy pixels from each quadrant. If the there are fewer than three noisy pixels in the level2.evt file, extra rows are filled as -1
| Pixel properties | Quadrant properties | ||||||
|---|---|---|---|---|---|---|---|
| Quadrant | DetID | PixID | Counts | Sigma | Mean | Median | Sigma |
| A | 10 | 83 | 243528 | 1933.07 | 626 | 615 | 125.7 |
| A | 13 | 248 | 33880 | 264.72 | 626 | 615 | 125.7 |
| A | 15 | 223 | 29483 | 229.72 | 626 | 615 | 125.7 |
| B | 12 | 243 | 732073 | 173504.29 | 12 | 12 | 4.2 |
| B | 12 | 144 | 13766 | 3259.81 | 12 | 12 | 4.2 |
| B | 5 | 200 | 5247 | 1240.74 | 12 | 12 | 4.2 |
| C | 15 | 214 | 226261 | 1593.25 | 616 | 622 | 141.6 |
| C | 0 | 10 | 208112 | 1465.1 | 616 | 622 | 141.6 |
| C | 14 | 254 | 25531 | 175.88 | 616 | 622 | 141.6 |
| D | 12 | 217 | 1315480 | 9198.25 | 585 | 569 | 143.0 |
| D | 12 | 17 | 809629 | 5659.65 | 585 | 569 | 143.0 |
| D | 12 | 227 | 605150 | 4229.25 | 585 | 569 | 143.0 |
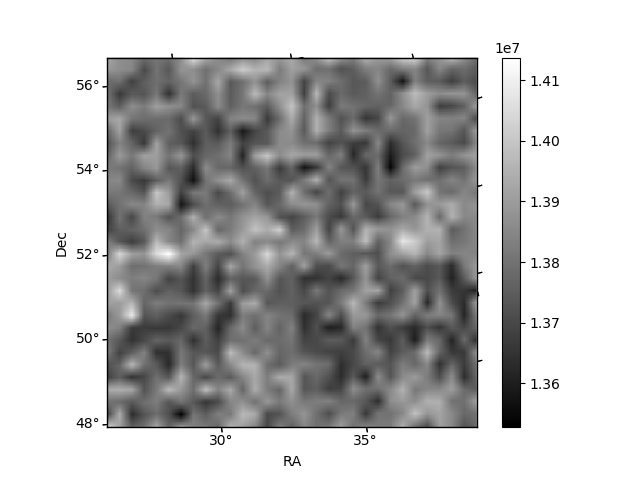
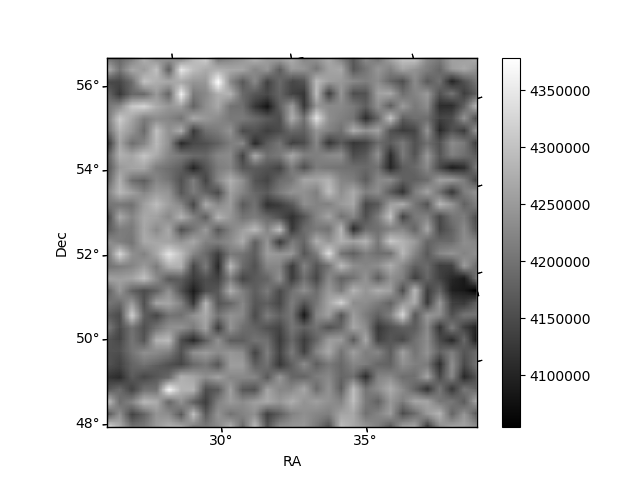
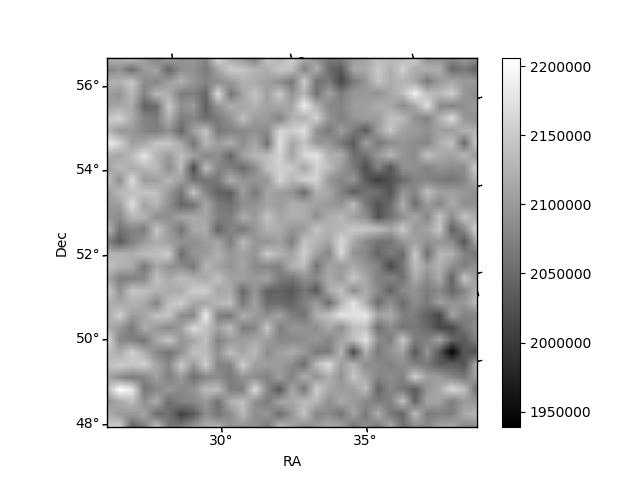
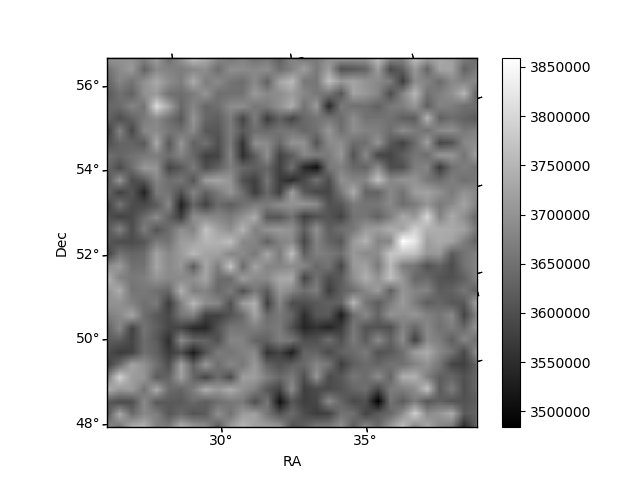
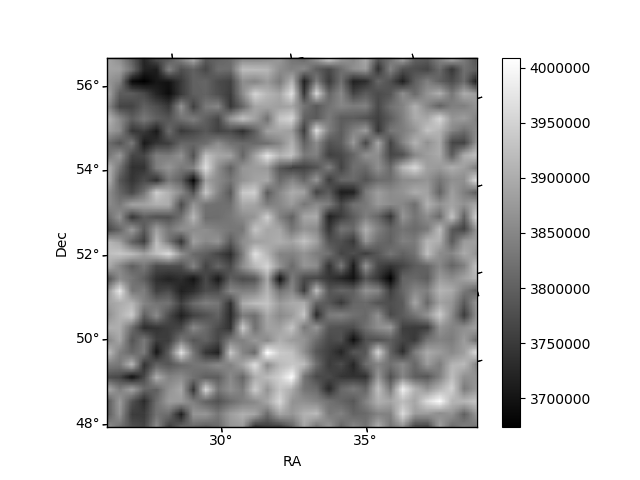
Histogram calculated using DETX and DETY for each event in the final _common_clean file
| Quadrant A | 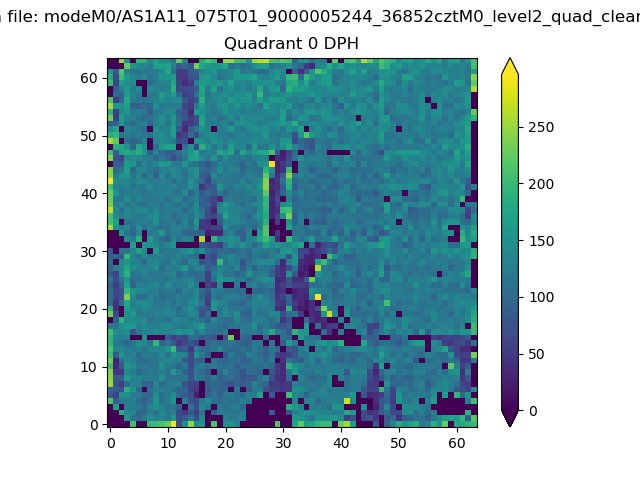 |
 |
Quadrant B |
|---|---|---|---|
| Quadrant D | 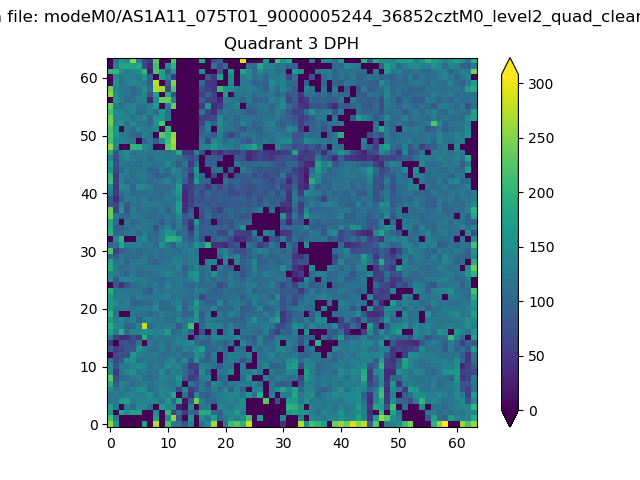 |
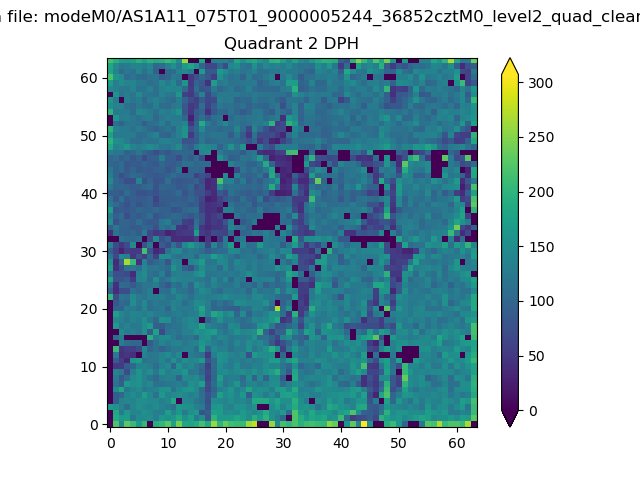 |
Quadrant C |
| Plot type | Count rate plots | Images |
|---|---|---|
| Comparison with Poisson distribution Blue bars denote a histogram of data divided into 1 sec bins. Red curve is a Poisson curve with rate = median count rate of data. |
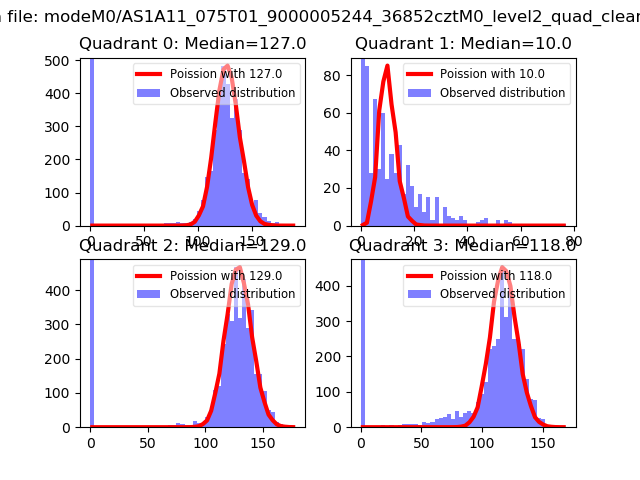 |
 |
| Quadrant-wise count rates Data is divided into 100 sec bins |
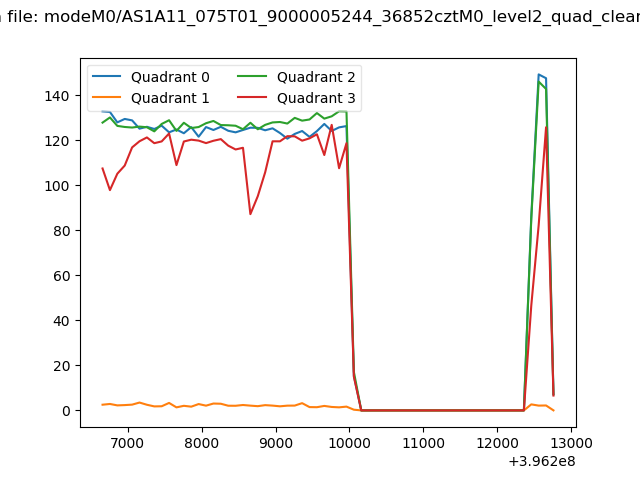 |
|
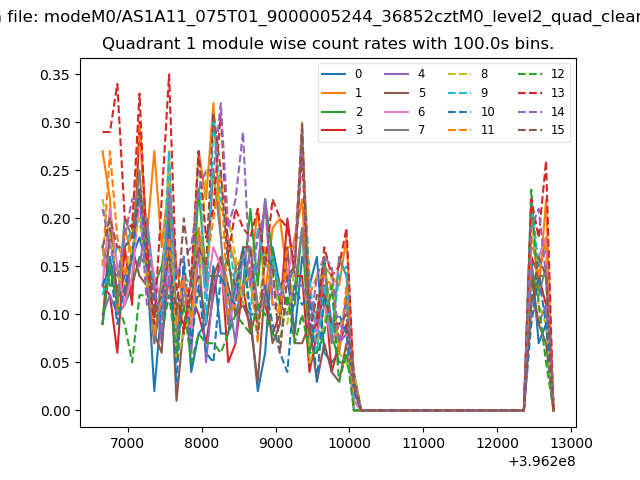
| Module-wise count rates for Quadrant A Data is divided into 100 sec bins |
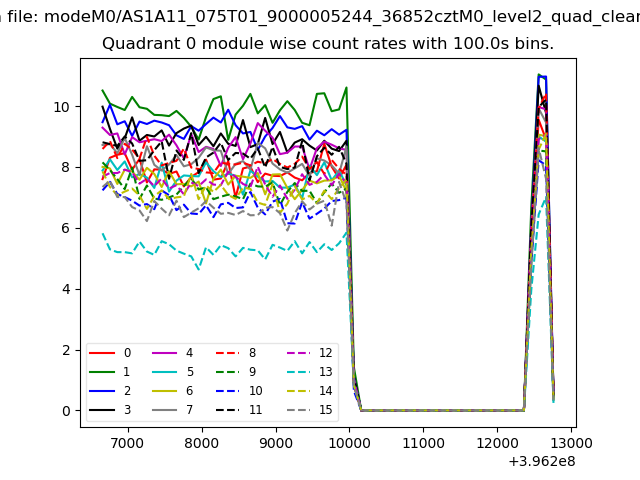 |
 |
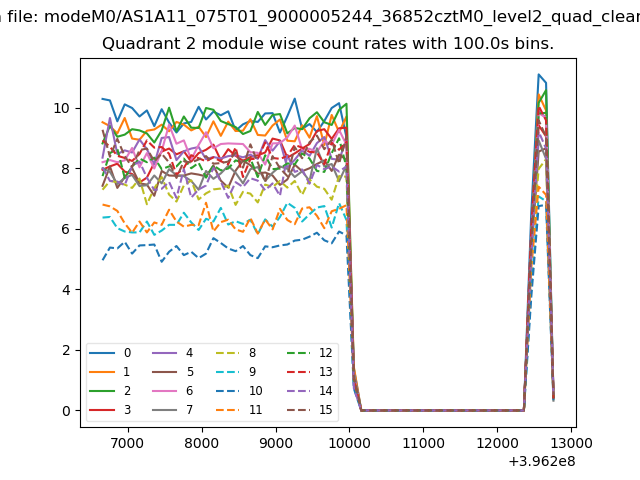
| Module-wise count rates for Quadrant B Data is divided into 100 sec bins |
 |
 |
| Module-wise count rates for Quadrant C Data is divided into 100 sec bins |
 |
 |
| Module-wise count rates for Quadrant D Data is divided into 100 sec bins |
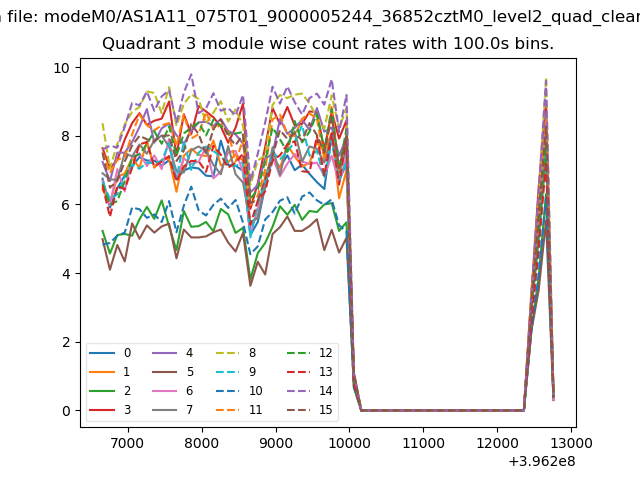 |
 |
| Parameter | Plot |
|---|---|
| CZT HV Monitor | 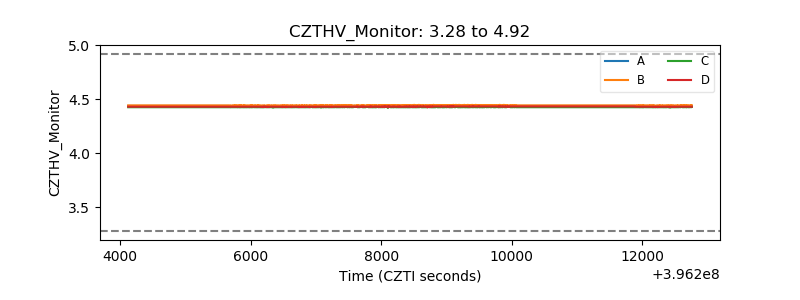 |
| D_VDD | 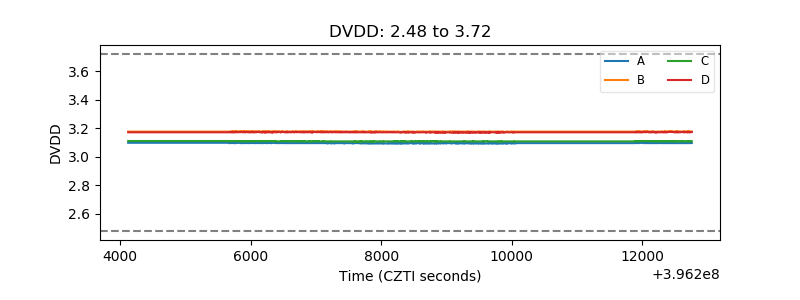 |
| Temperature 1 | 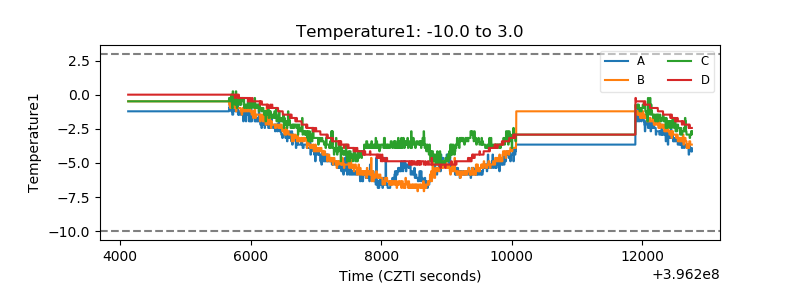 |
| Veto HV Monitor | 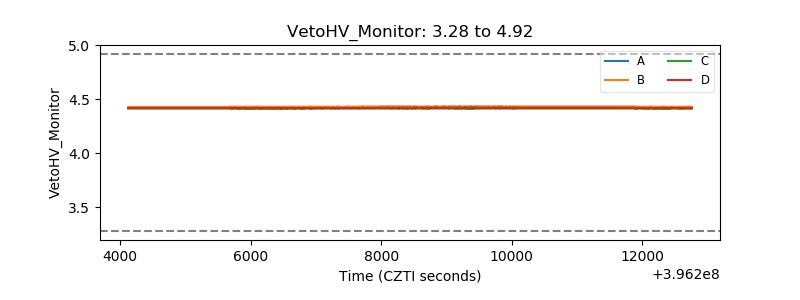 |
| Veto LLD | 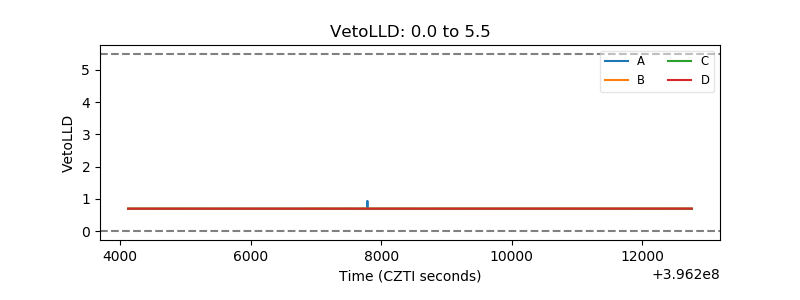 |
| Alpha Counter | 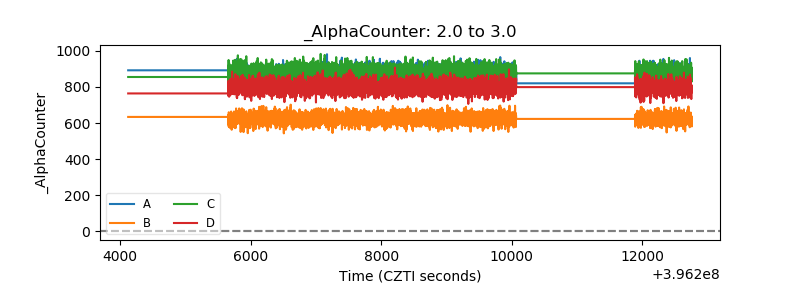 |
| _CPM_Rate | 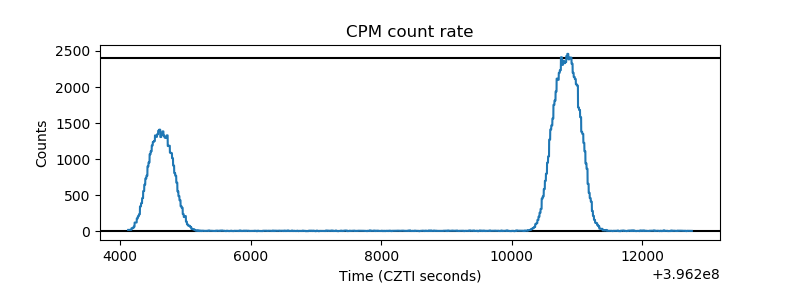 |
| CZT Counter | 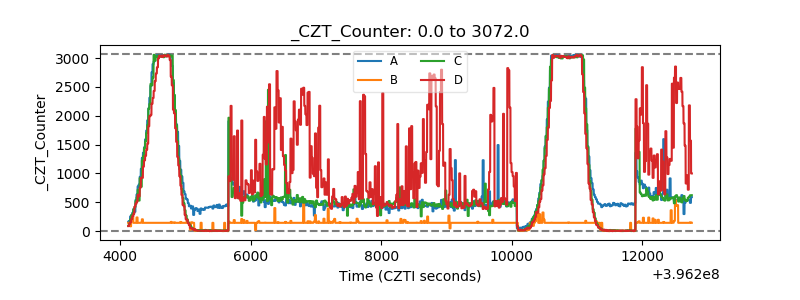 |
| +2.5 Volts monitor |  |
| +5 Volts monitor |  |
| _ROLL_ROT | 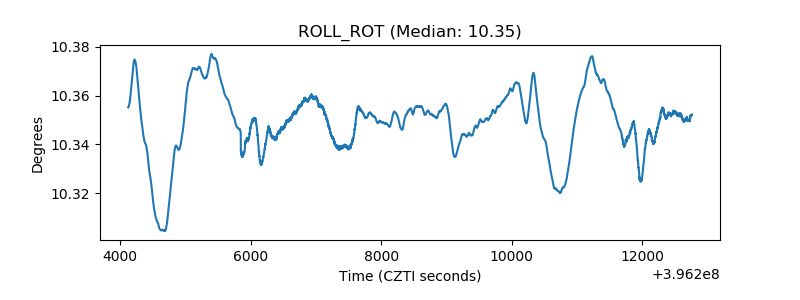 |
| _Roll_DEC | 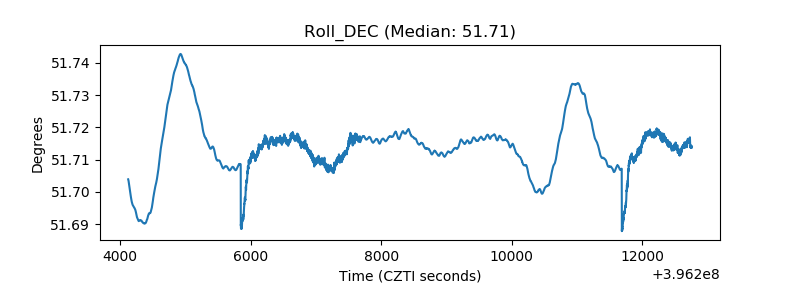 |
| _Roll_RA | 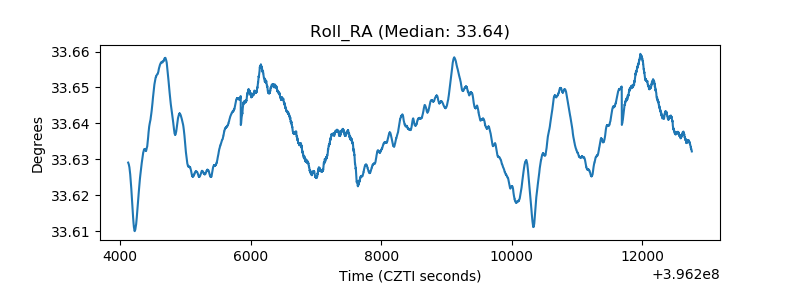 |
| Veto Counter | 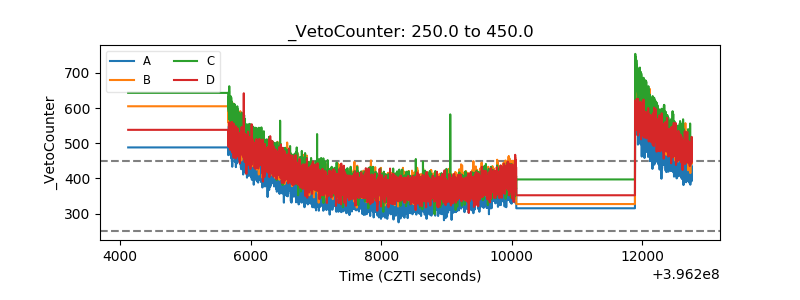 |