| Param | Original file | Final file |
|---|---|---|
| Filename | modeM0/AS1A11_075T01_9000005244_36853cztM0_level2.evt | modeM0/AS1A11_075T01_9000005244_36853cztM0_level2_quad_clean.evt |
| Size (bytes) | 353,963,520 | 68,385,600 |
| Size | 337.6 MB | 65.2 MB |
| Events in quadrant A | 2,704,452 | 574,987 |
| Events in quadrant B | 777,626 | 9,244 |
| Events in quadrant C | 2,784,015 | 587,416 |
| Events in quadrant D | 4,104,802 | 542,882 |
| Mode SS | |||
|---|---|---|---|
| Quadrant | BADHDUFLAG | Total packets | Discarded packets |
| A | 0 | 104 | 0 |
| B | 0 | 104 | 0 |
| C | 0 | 104 | 0 |
| D | 0 | 104 | 0 |
| Mode M0 | |||
|---|---|---|---|
| Quadrant | BADHDUFLAG | Total packets | Discarded packets |
| A | 0 | 11301 | 3 |
| B | 0 | 5155 | 2 |
| C | 0 | 11492 | 2 |
| D | 0 | 15711 | 2 |
| Mode M9 | |||
|---|---|---|---|
| Quadrant | BADHDUFLAG | Total packets | Discarded packets |
| A | 0 | 26 | 0 |
| B | 0 | 26 | 0 |
| C | 0 | 26 | 0 |
| D | 0 | 27 | 0 |
| Quadrant | Total seconds | Saturated seconds | Saturation percentage |
|---|---|---|---|
| A | 5047 | 28 | 0.554785% |
| B | 5047 | 5047 | 100.000000% |
| C | 5047 | 47 | 0.931246% |
| D | 5047 | 461 | 9.134139% |
Noise dominated data is calculated using 1-second bins in cleaned event files. If a bin has >2000 counts, and if more than 50% of those come from <1% of pixels, then it is considered to be noise-dominated and hence unusable.
| Quadrant | # 1 sec bins | Bins with >0 counts | Bins with >2000 counts | High rate bins dominated by noise | Noise dominated (total time) | Noise dominated (detector-on time) | Marked lightcurve |
|---|---|---|---|---|---|---|---|
| A | 6990 | 5048 | 11 | 11 | 0.16% | 0.22% | 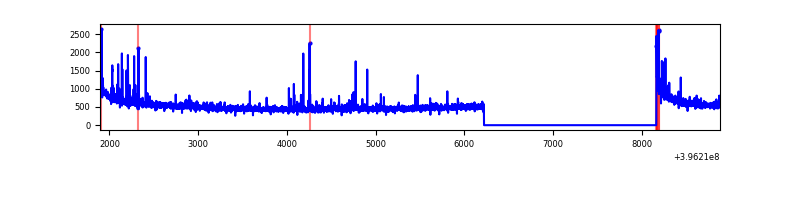 |
| B | 6989 | 5046 | 1 | 1 | 0.01% | 0.02% | 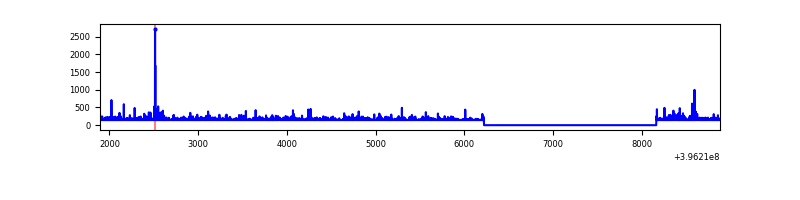 |
| C | 6990 | 5048 | 32 | 32 | 0.46% | 0.63% | 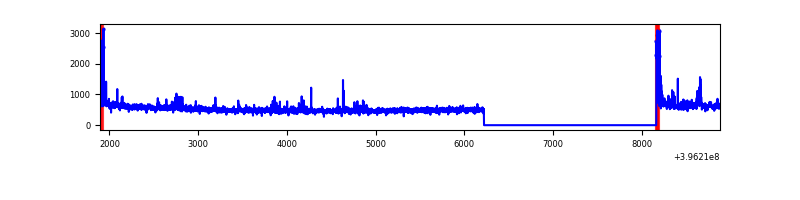 |
| D | 6990 | 5048 | 429 | 429 | 6.14% | 8.50% | 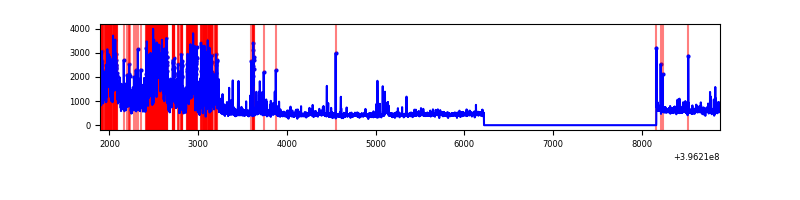 |
Top three noisy pixels from each quadrant. If the there are fewer than three noisy pixels in the level2.evt file, extra rows are filled as -1
| Pixel properties | Quadrant properties | ||||||
|---|---|---|---|---|---|---|---|
| Quadrant | DetID | PixID | Counts | Sigma | Mean | Median | Sigma |
| A | 10 | 83 | 230613 | 1878.08 | 607 | 598 | 122.5 |
| A | 13 | 248 | 49271 | 397.42 | 607 | 598 | 122.5 |
| A | 15 | 223 | 26814 | 214.06 | 607 | 598 | 122.5 |
| B | 12 | 243 | 699172 | 178175.88 | 11 | 11 | 3.9 |
| B | 12 | 144 | 13039 | 3320.09 | 11 | 11 | 3.9 |
| B | 5 | 200 | 6743 | 1715.6 | 11 | 11 | 3.9 |
| C | 15 | 214 | 214603 | 1543.85 | 601 | 607 | 138.6 |
| C | 0 | 10 | 148583 | 1067.55 | 601 | 607 | 138.6 |
| C | 14 | 254 | 37247 | 264.33 | 601 | 607 | 138.6 |
| D | 12 | 217 | 1073026 | 7647.48 | 580 | 565 | 140.2 |
| D | 12 | 227 | 547430 | 3899.57 | 580 | 565 | 140.2 |
| D | 12 | 17 | 76269 | 539.83 | 580 | 565 | 140.2 |
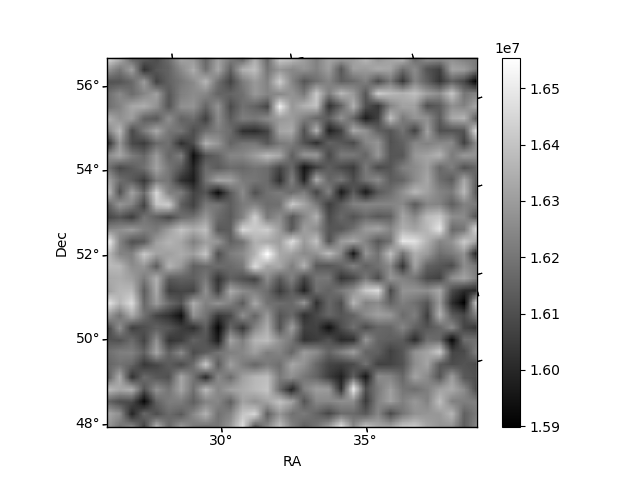
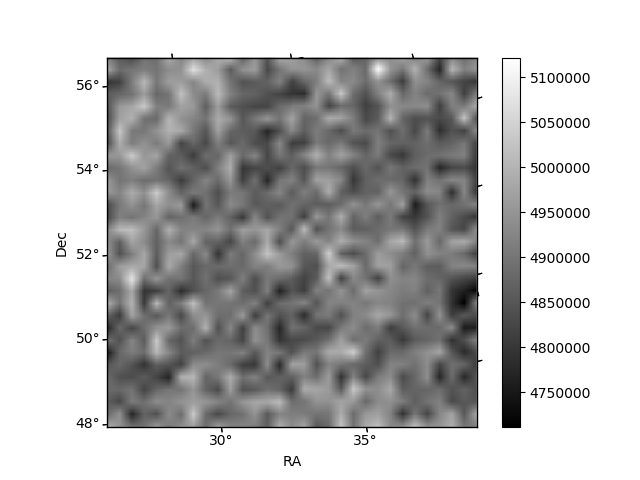
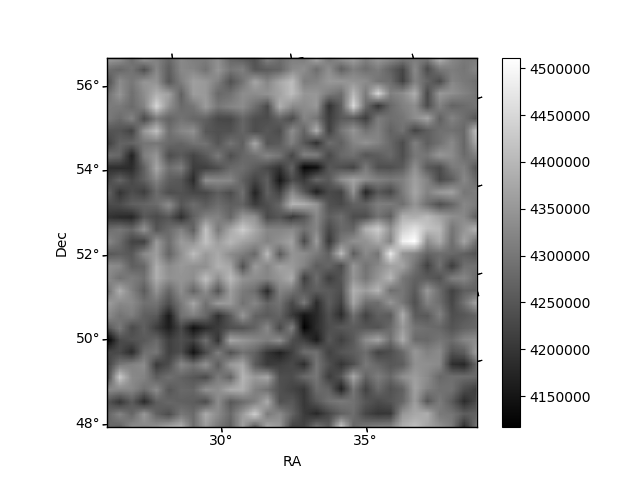
Histogram calculated using DETX and DETY for each event in the final _common_clean file
| Quadrant A | 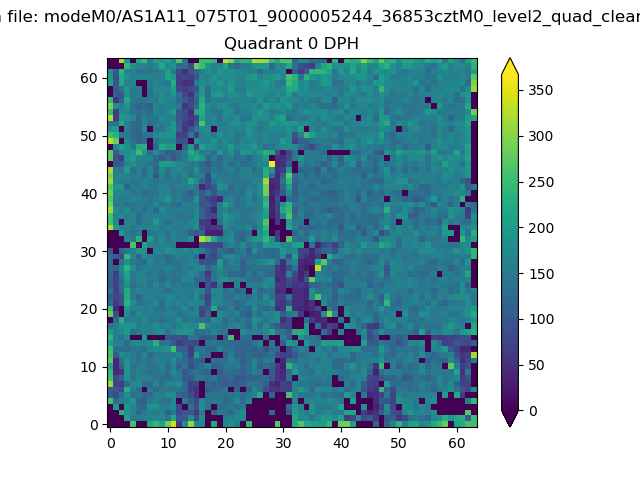 |
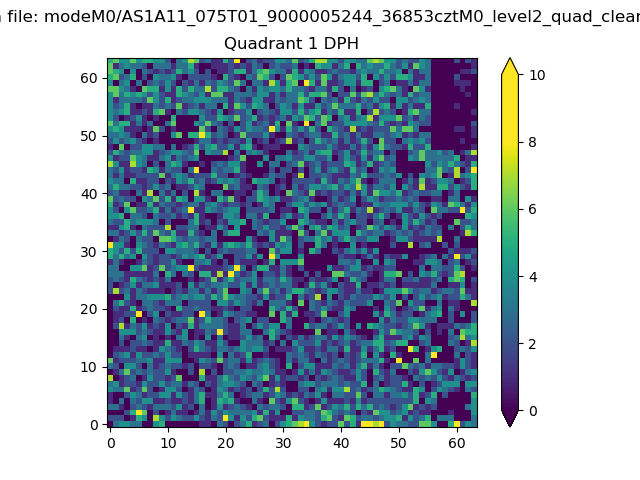 |
Quadrant B |
|---|---|---|---|
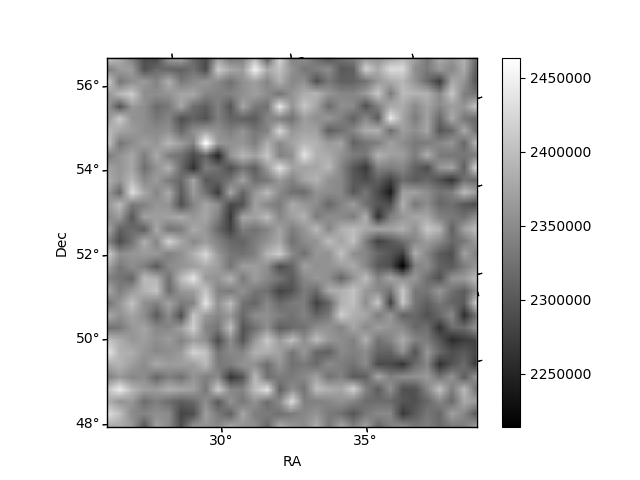
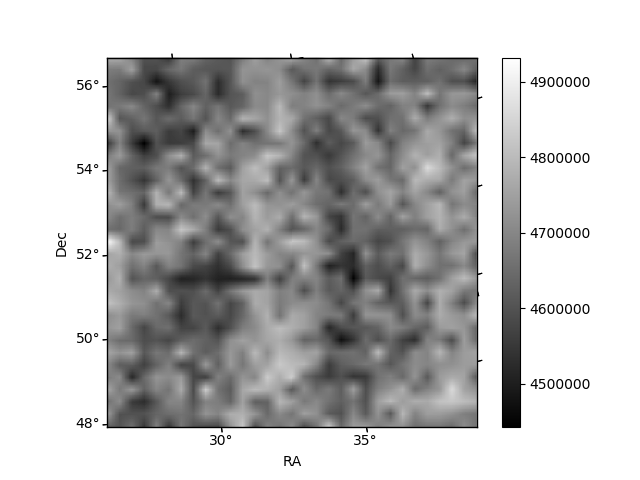
| Quadrant D | 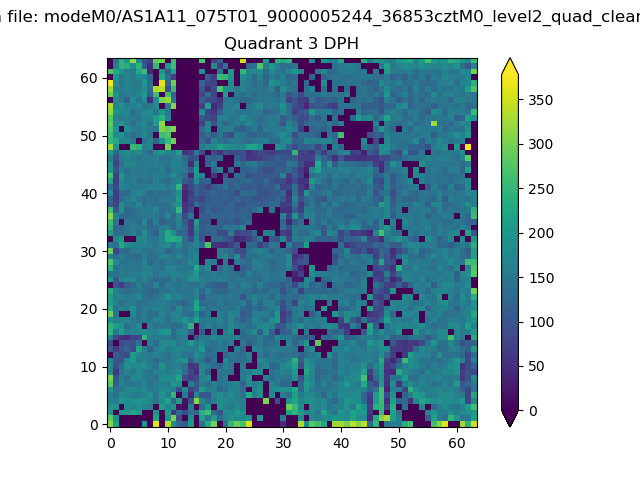 |
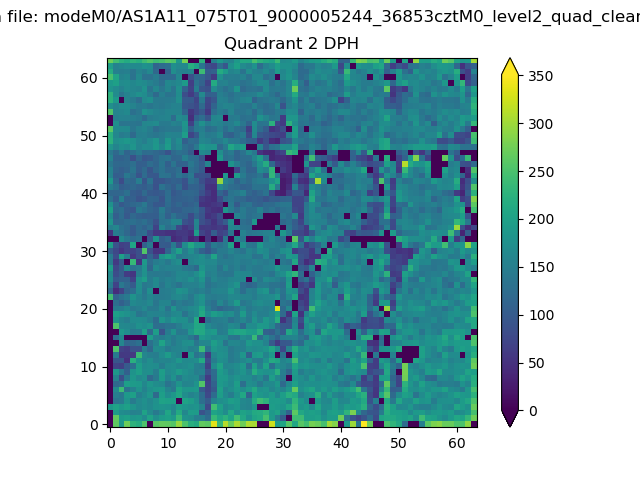 |
Quadrant C |
| Plot type | Count rate plots | Images |
|---|---|---|
| Comparison with Poisson distribution Blue bars denote a histogram of data divided into 1 sec bins. Red curve is a Poisson curve with rate = median count rate of data. |
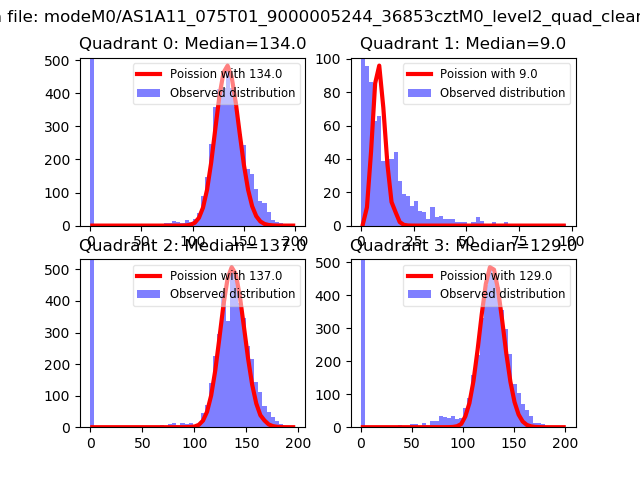 |
 |
| Quadrant-wise count rates Data is divided into 100 sec bins |
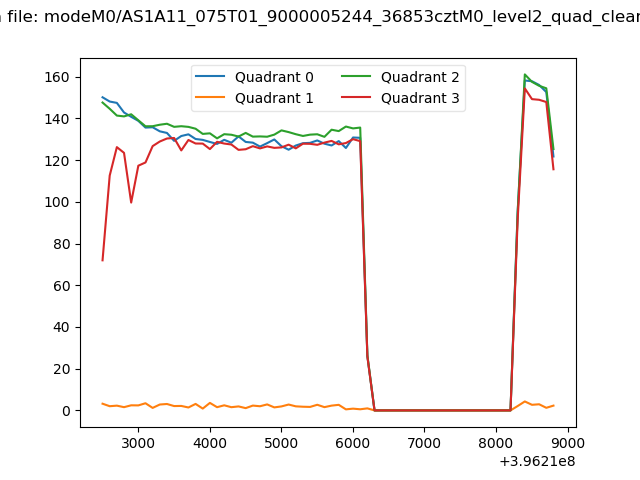 |
|
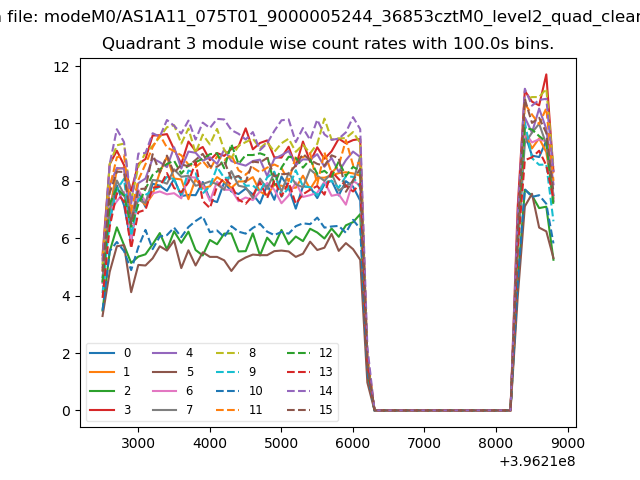
| Module-wise count rates for Quadrant A Data is divided into 100 sec bins |
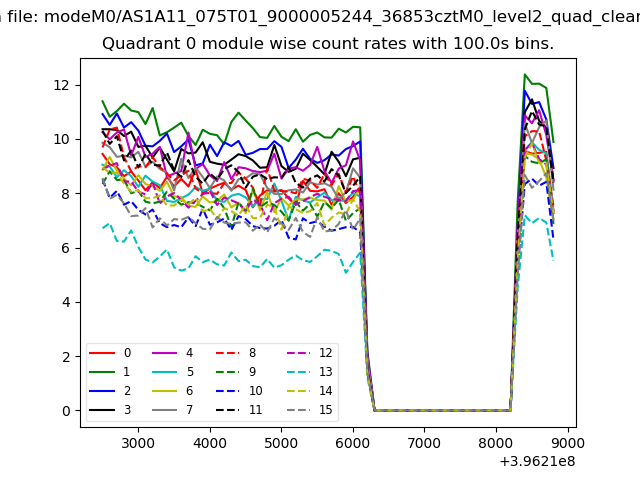 |
 |
| Module-wise count rates for Quadrant B Data is divided into 100 sec bins |
 |
 |
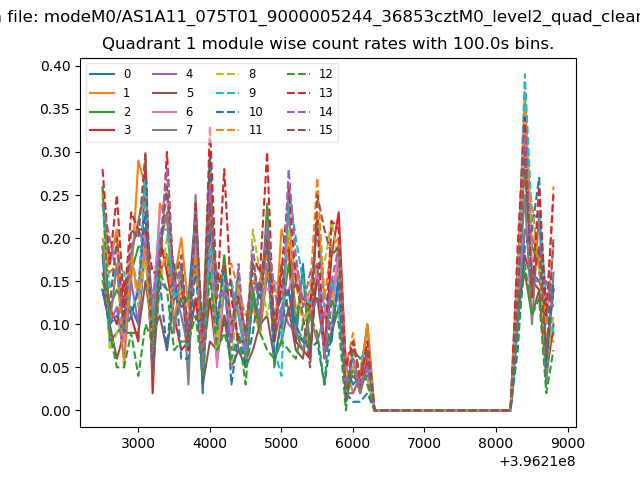
| Module-wise count rates for Quadrant C Data is divided into 100 sec bins |
 |
 |
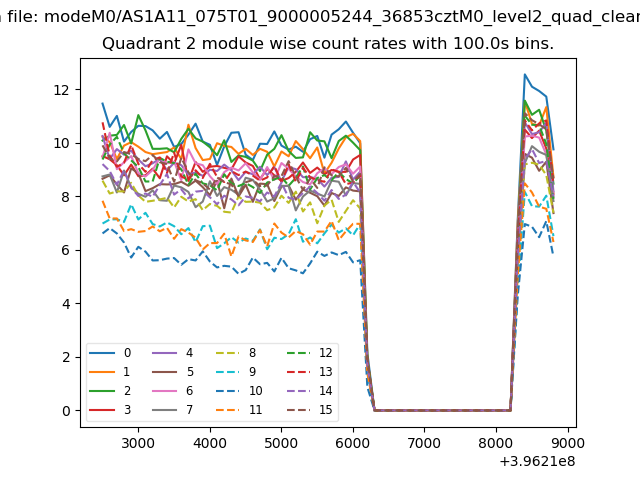
| Module-wise count rates for Quadrant D Data is divided into 100 sec bins |
 |
 |
| Parameter | Plot |
|---|---|
| CZT HV Monitor | 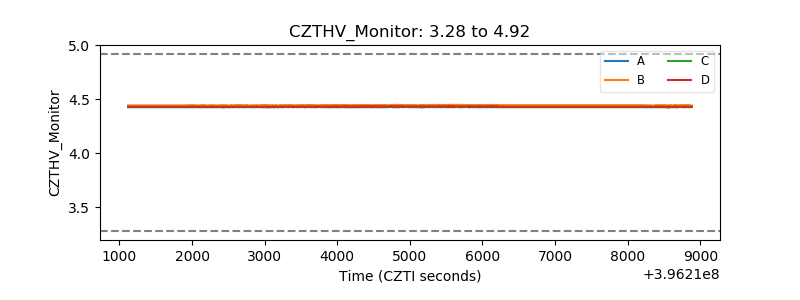 |
| D_VDD | 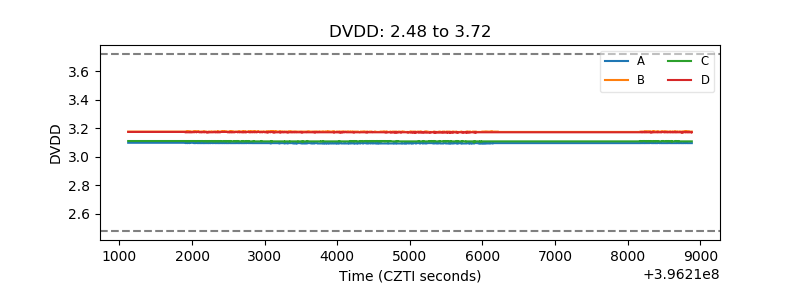 |
| Temperature 1 | 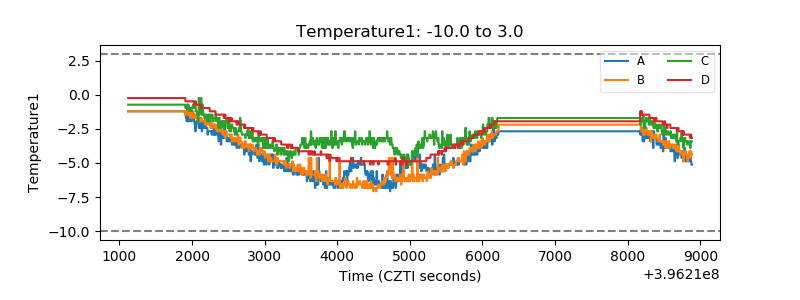 |
| Veto HV Monitor | 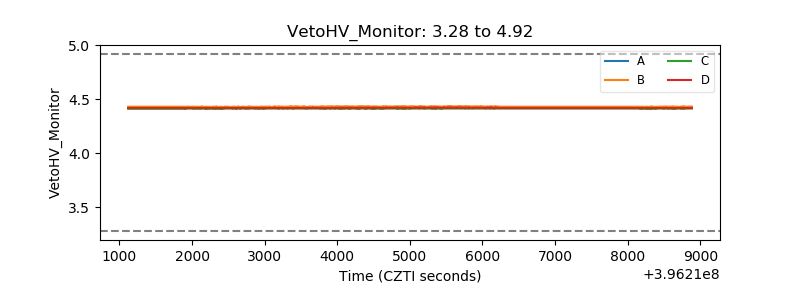 |
| Veto LLD | 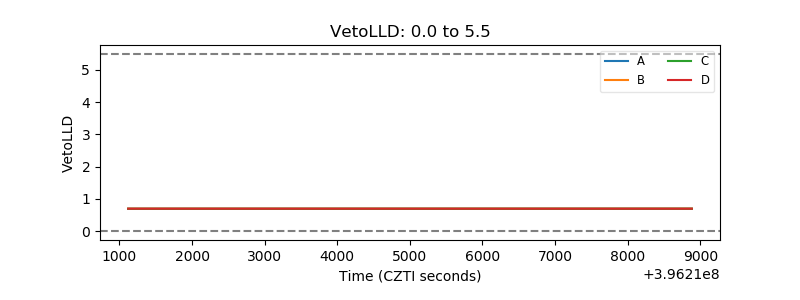 |
| Alpha Counter | 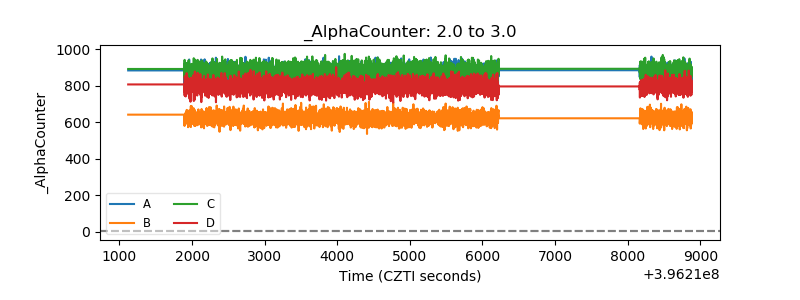 |
| _CPM_Rate | 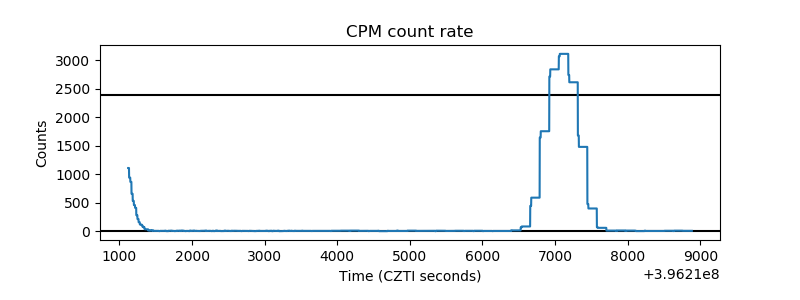 |
| CZT Counter | 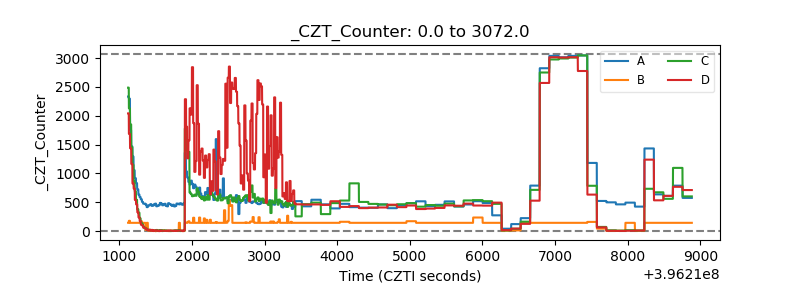 |
| +2.5 Volts monitor |  |
| +5 Volts monitor |  |
| _ROLL_ROT | 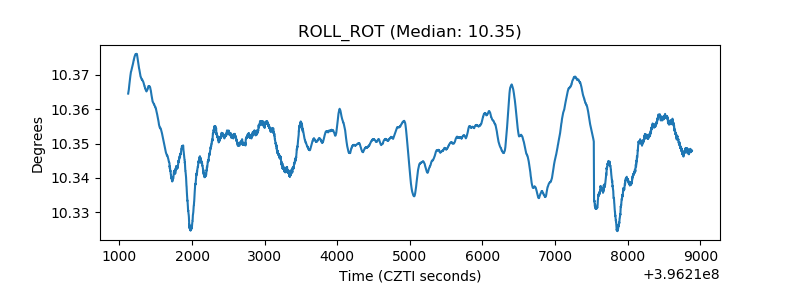 |
| _Roll_DEC | 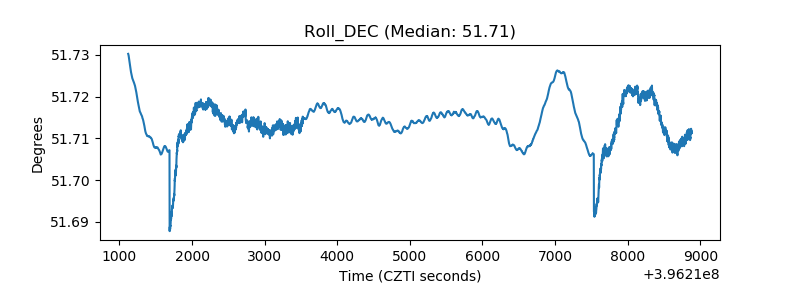 |
| _Roll_RA |  |
| Veto Counter |  |