| Param | Original file | Final file |
|---|---|---|
| Filename | modeM0/AS1A11_075T01_9000005244_36854cztM0_level2.evt | modeM0/AS1A11_075T01_9000005244_36854cztM0_level2_quad_clean.evt |
| Size (bytes) | 325,745,280 | 76,196,160 |
| Size | 310.7 MB | 72.7 MB |
| Events in quadrant A | 2,648,983 | 649,832 |
| Events in quadrant B | 776,059 | 9,993 |
| Events in quadrant C | 2,935,915 | 663,428 |
| Events in quadrant D | 3,155,575 | 628,331 |
| Mode SS | |||
|---|---|---|---|
| Quadrant | BADHDUFLAG | Total packets | Discarded packets |
| A | 0 | 102 | 0 |
| B | 0 | 102 | 0 |
| C | 0 | 102 | 0 |
| D | 0 | 102 | 0 |
| Mode M0 | |||
|---|---|---|---|
| Quadrant | BADHDUFLAG | Total packets | Discarded packets |
| A | 0 | 11070 | 3 |
| B | 0 | 5156 | 2 |
| C | 0 | 11854 | 2 |
| D | 0 | 12756 | 2 |
| Mode M9 | |||
|---|---|---|---|
| Quadrant | BADHDUFLAG | Total packets | Discarded packets |
| A | 0 | 38 | 0 |
| B | 0 | 38 | 0 |
| C | 0 | 38 | 0 |
| D | 0 | 39 | 0 |
| Quadrant | Total seconds | Saturated seconds | Saturation percentage |
|---|---|---|---|
| A | 5047 | 18 | 0.356648% |
| B | 5047 | 5047 | 100.000000% |
| C | 5047 | 112 | 2.219140% |
| D | 5047 | 84 | 1.664355% |
Noise dominated data is calculated using 1-second bins in cleaned event files. If a bin has >2000 counts, and if more than 50% of those come from <1% of pixels, then it is considered to be noise-dominated and hence unusable.
| Quadrant | # 1 sec bins | Bins with >0 counts | Bins with >2000 counts | High rate bins dominated by noise | Noise dominated (total time) | Noise dominated (detector-on time) | Marked lightcurve |
|---|---|---|---|---|---|---|---|
| A | 7079 | 5048 | 13 | 13 | 0.18% | 0.26% | 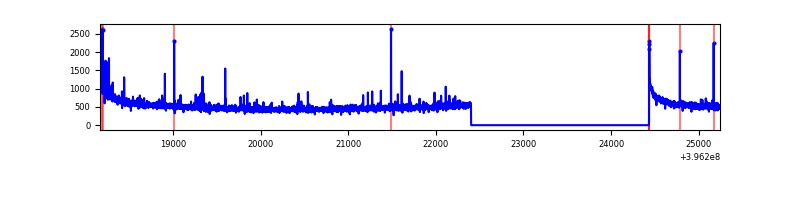 |
| B | 7078 | 5046 | 1 | 1 | 0.01% | 0.02% | 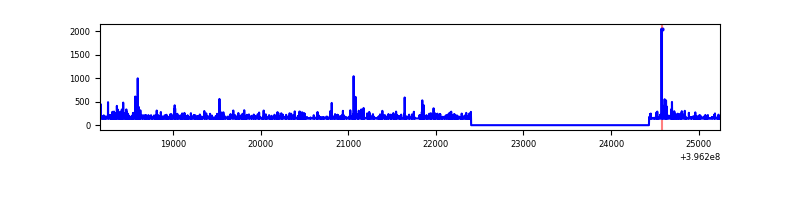 |
| C | 7079 | 5048 | 89 | 89 | 1.26% | 1.76% | 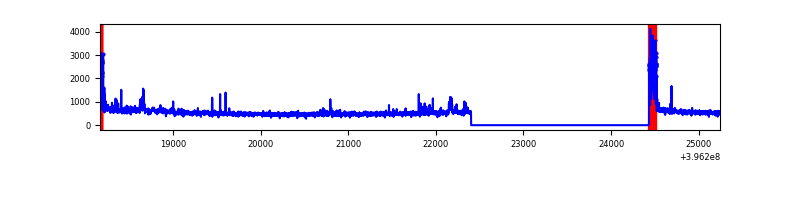 |
| D | 7079 | 5048 | 98 | 98 | 1.38% | 1.94% | 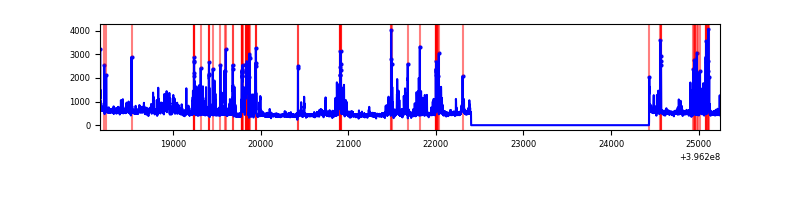 |
Top three noisy pixels from each quadrant. If the there are fewer than three noisy pixels in the level2.evt file, extra rows are filled as -1
| Pixel properties | Quadrant properties | ||||||
|---|---|---|---|---|---|---|---|
| Quadrant | DetID | PixID | Counts | Sigma | Mean | Median | Sigma |
| A | 10 | 83 | 224205 | 1834.07 | 607 | 597 | 121.9 |
| A | 15 | 223 | 32622 | 262.67 | 607 | 597 | 121.9 |
| A | 13 | 248 | 19237 | 152.89 | 607 | 597 | 121.9 |
| B | 12 | 243 | 699316 | 183972.59 | 10 | 10 | 3.8 |
| B | 12 | 144 | 12743 | 3349.78 | 10 | 10 | 3.8 |
| B | 5 | 172 | 6546 | 1719.48 | 10 | 10 | 3.8 |
| C | 0 | 10 | 290998 | 2105.36 | 600 | 604 | 137.9 |
| C | 15 | 214 | 210507 | 1521.8 | 600 | 604 | 137.9 |
| C | 3 | 233 | 46545 | 333.07 | 600 | 604 | 137.9 |
| D | 13 | 171 | 201665 | 1396.75 | 596 | 582 | 144.0 |
| D | 13 | 249 | 158835 | 1099.25 | 596 | 582 | 144.0 |
| D | 2 | 153 | 102434 | 707.48 | 596 | 582 | 144.0 |
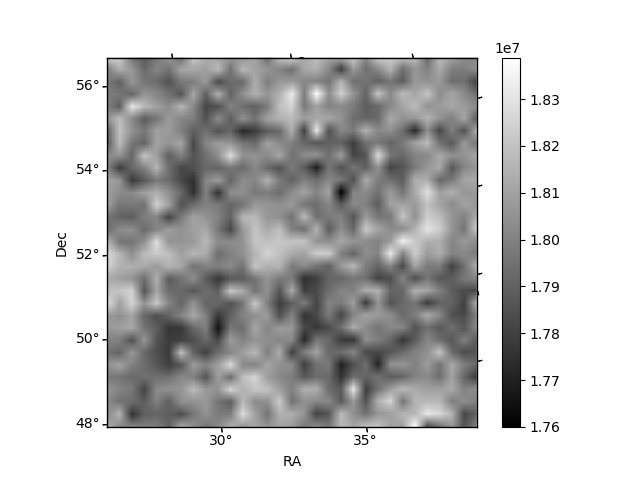
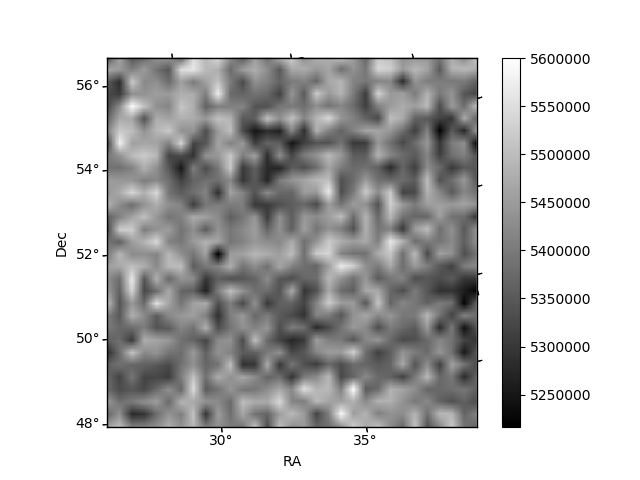
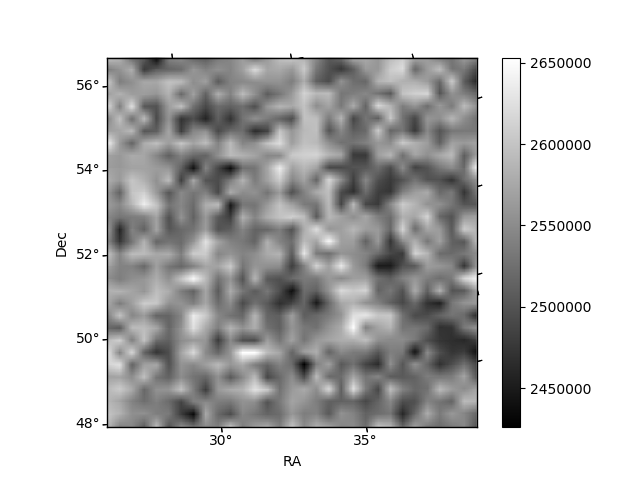
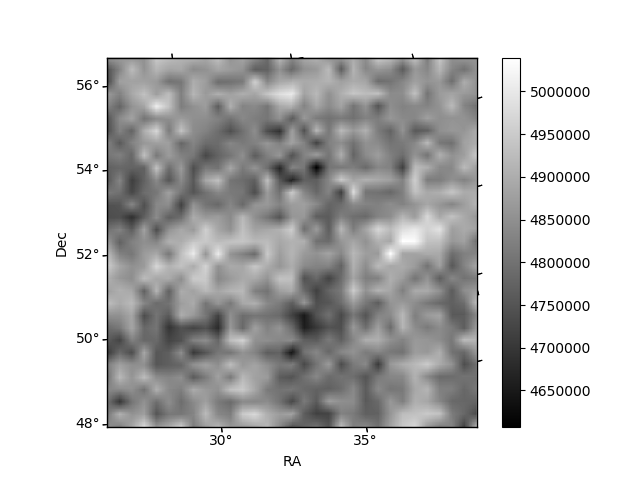
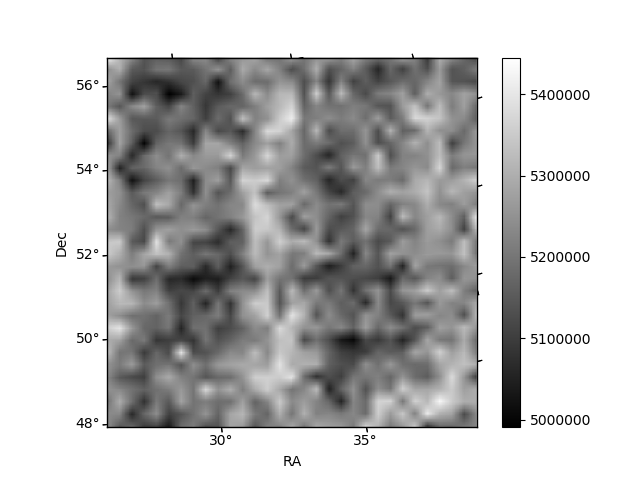
Histogram calculated using DETX and DETY for each event in the final _common_clean file
| Quadrant A | 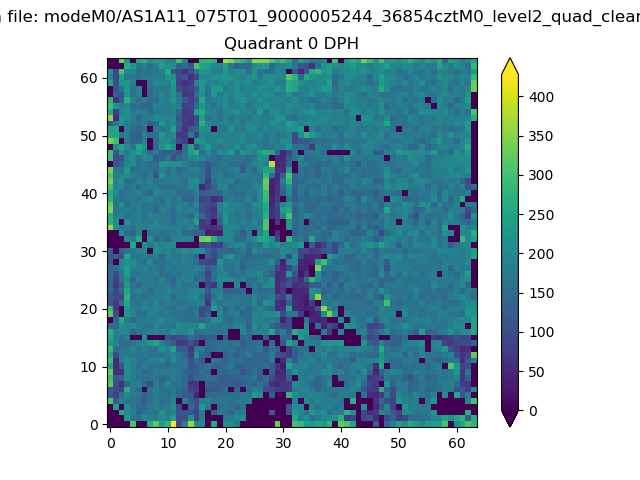 |
 |
Quadrant B |
|---|---|---|---|
| Quadrant D | 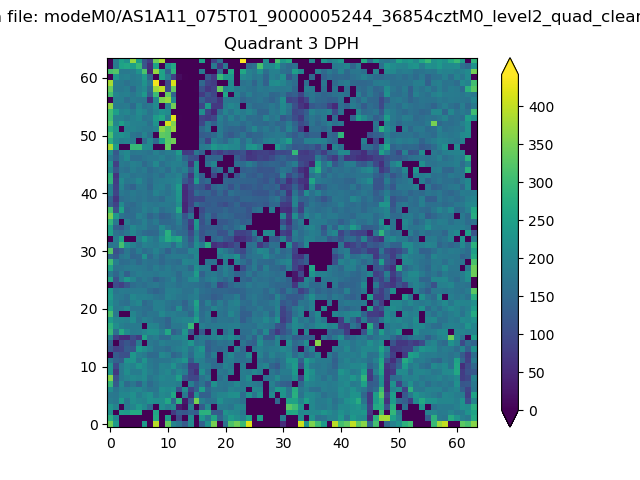 |
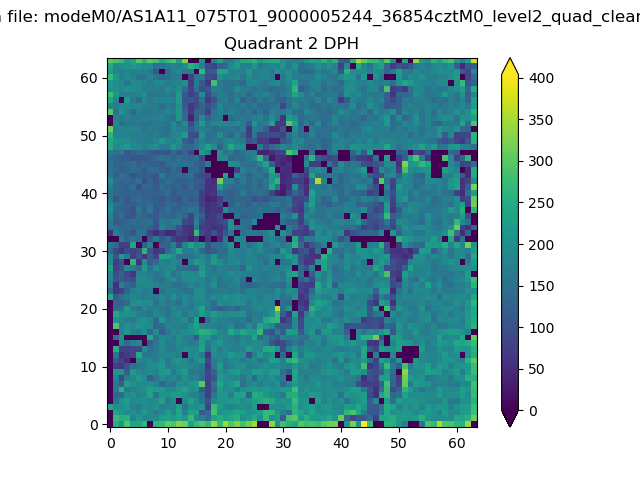 |
Quadrant C |
| Plot type | Count rate plots | Images |
|---|---|---|
| Comparison with Poisson distribution Blue bars denote a histogram of data divided into 1 sec bins. Red curve is a Poisson curve with rate = median count rate of data. |
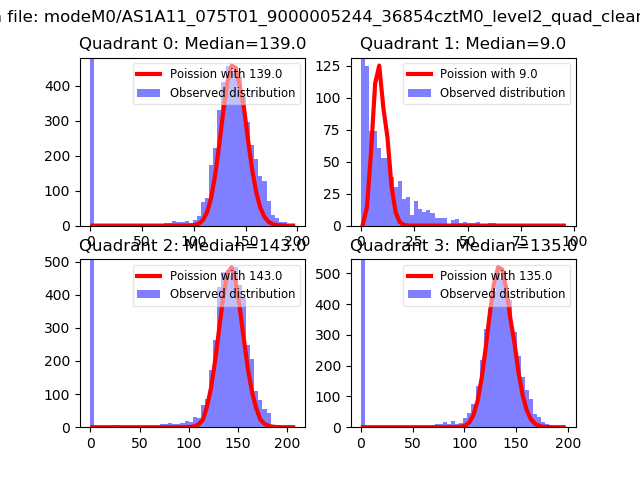 |
 |
| Quadrant-wise count rates Data is divided into 100 sec bins |
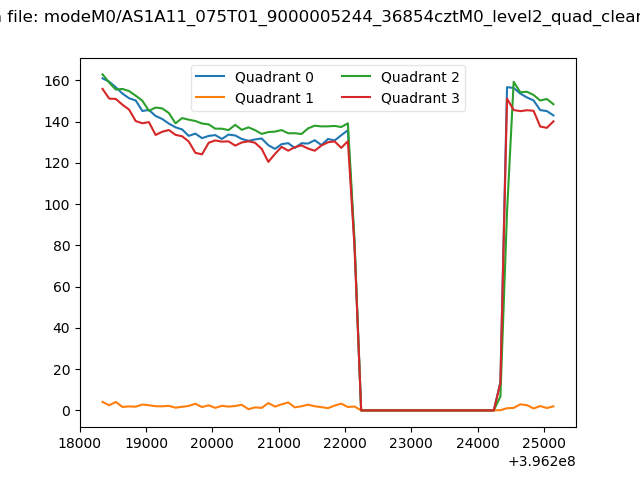 |
|
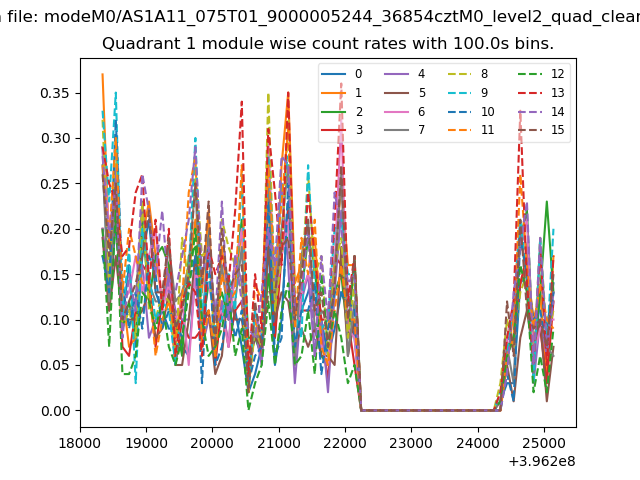
| Module-wise count rates for Quadrant A Data is divided into 100 sec bins |
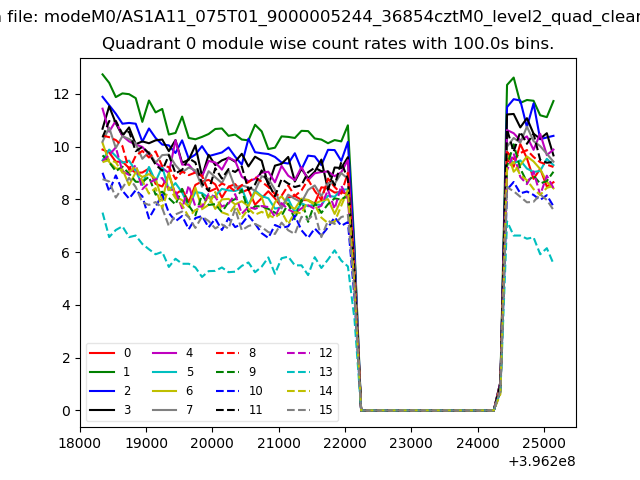 |
 |
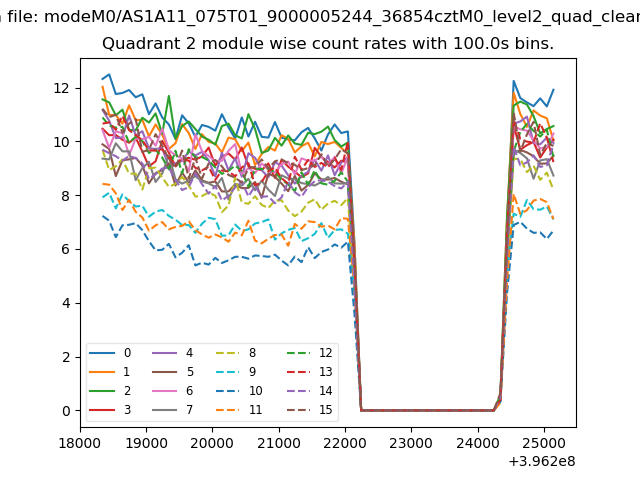
| Module-wise count rates for Quadrant B Data is divided into 100 sec bins |
 |
 |
| Module-wise count rates for Quadrant C Data is divided into 100 sec bins |
 |
 |
| Module-wise count rates for Quadrant D Data is divided into 100 sec bins |
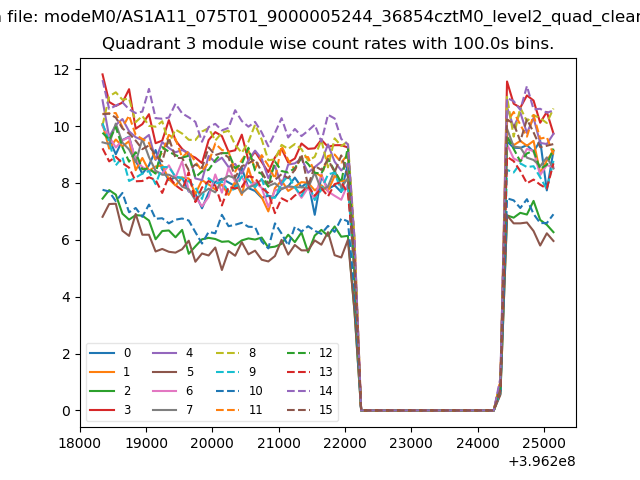 |
 |
| Parameter | Plot |
|---|---|
| CZT HV Monitor | 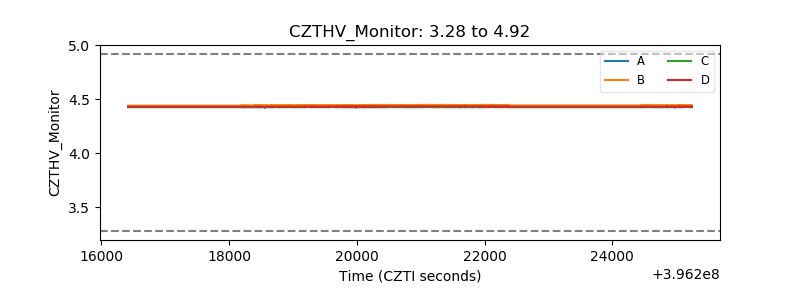 |
| D_VDD | 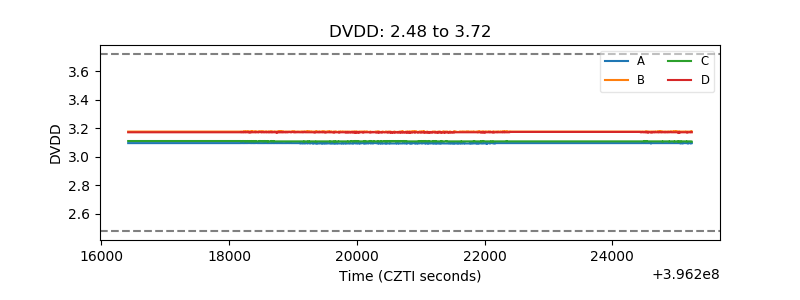 |
| Temperature 1 | 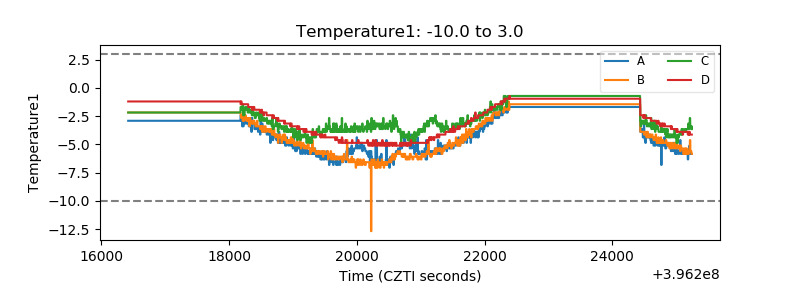 |
| Veto HV Monitor | 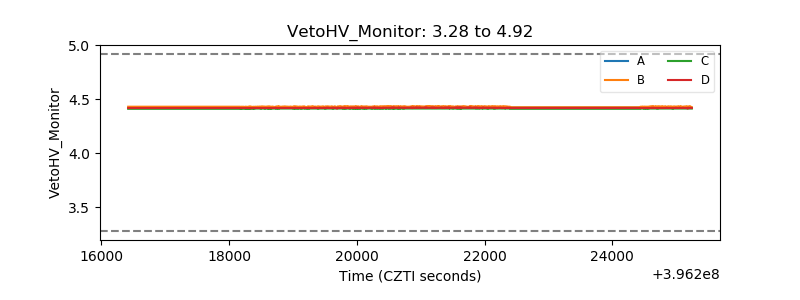 |
| Veto LLD | 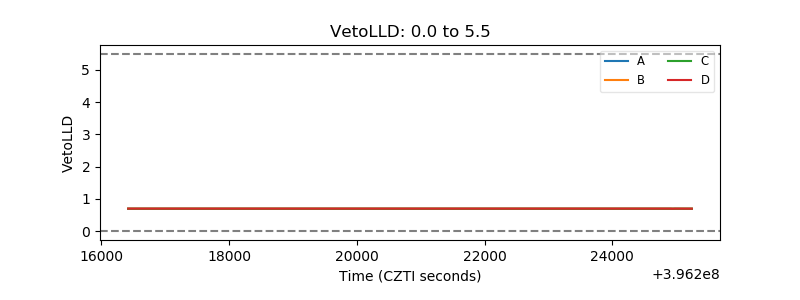 |
| Alpha Counter | 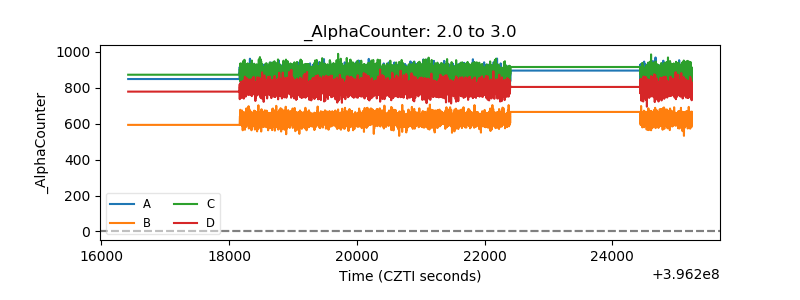 |
| _CPM_Rate | 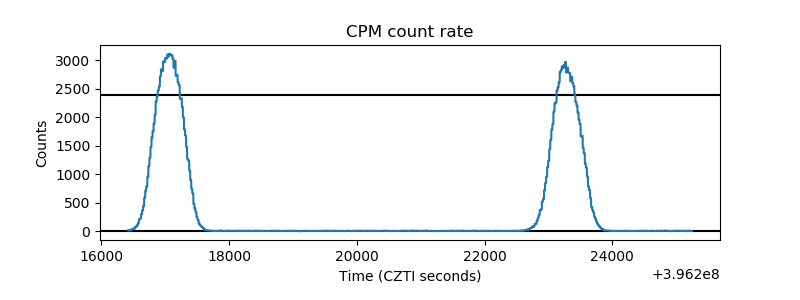 |
| CZT Counter | 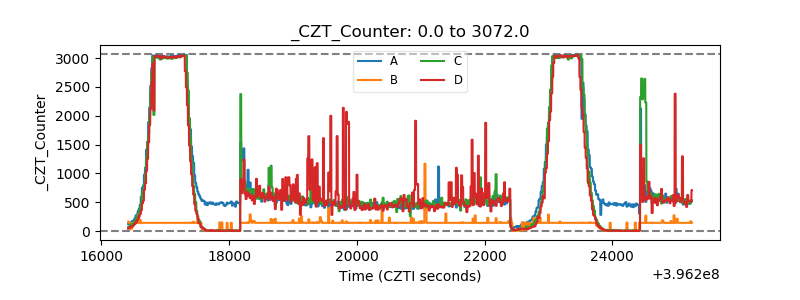 |
| +2.5 Volts monitor |  |
| +5 Volts monitor |  |
| _ROLL_ROT | 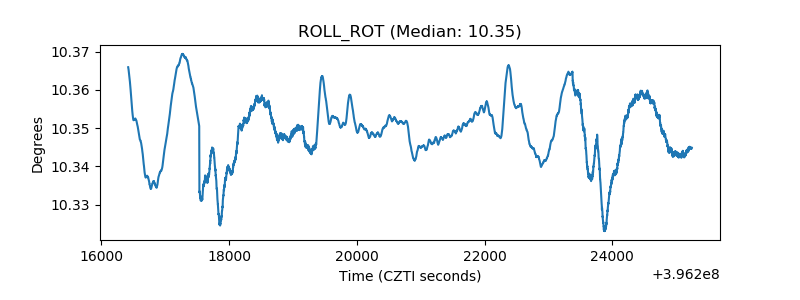 |
| _Roll_DEC |  |
| _Roll_RA | 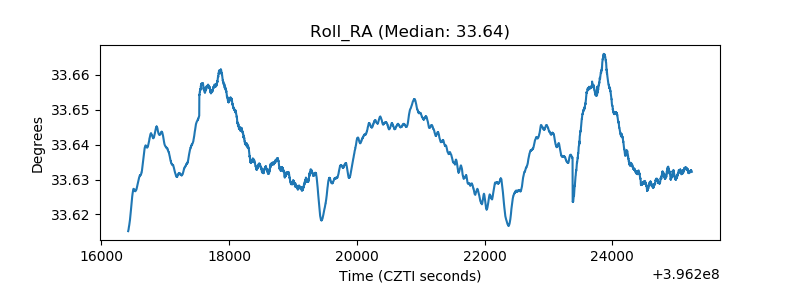 |
| Veto Counter | 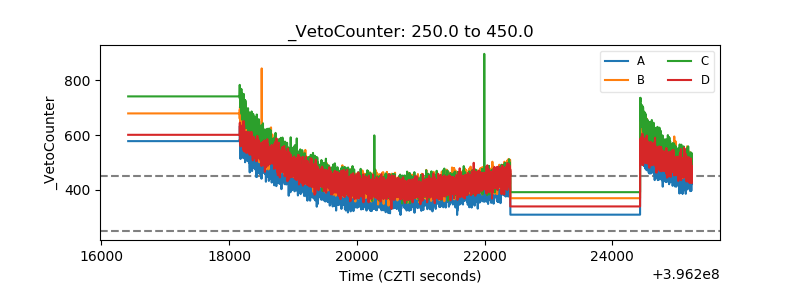 |