| Param | Original file | Final file |
|---|---|---|
| Filename | modeM0/AS1A11_075T01_9000005244_36855cztM0_level2.evt | modeM0/AS1A11_075T01_9000005244_36855cztM0_level2_quad_clean.evt |
| Size (bytes) | 330,232,320 | 70,191,360 |
| Size | 314.9 MB | 66.9 MB |
| Events in quadrant A | 2,591,728 | 591,619 |
| Events in quadrant B | 772,284 | 9,248 |
| Events in quadrant C | 2,847,057 | 605,598 |
| Events in quadrant D | 3,440,317 | 562,226 |
| Mode SS | |||
|---|---|---|---|
| Quadrant | BADHDUFLAG | Total packets | Discarded packets |
| A | 0 | 104 | 0 |
| B | 0 | 104 | 0 |
| C | 0 | 104 | 0 |
| D | 0 | 104 | 0 |
| Mode M0 | |||
|---|---|---|---|
| Quadrant | BADHDUFLAG | Total packets | Discarded packets |
| A | 0 | 10901 | 3 |
| B | 0 | 5155 | 2 |
| C | 0 | 11408 | 2 |
| D | 0 | 13680 | 2 |
| Mode M9 | |||
|---|---|---|---|
| Quadrant | BADHDUFLAG | Total packets | Discarded packets |
| A | 0 | 42 | 0 |
| B | 0 | 42 | 0 |
| C | 0 | 42 | 0 |
| D | 0 | 42 | 0 |
| Quadrant | Total seconds | Saturated seconds | Saturation percentage |
|---|---|---|---|
| A | 5063 | 11 | 0.217262% |
| B | 5063 | 5063 | 100.000000% |
| C | 5063 | 103 | 2.034367% |
| D | 5063 | 277 | 5.471065% |
Noise dominated data is calculated using 1-second bins in cleaned event files. If a bin has >2000 counts, and if more than 50% of those come from <1% of pixels, then it is considered to be noise-dominated and hence unusable.
| Quadrant | # 1 sec bins | Bins with >0 counts | Bins with >2000 counts | High rate bins dominated by noise | Noise dominated (total time) | Noise dominated (detector-on time) | Marked lightcurve |
|---|---|---|---|---|---|---|---|
| A | 9219 | 5065 | 13 | 13 | 0.14% | 0.26% | 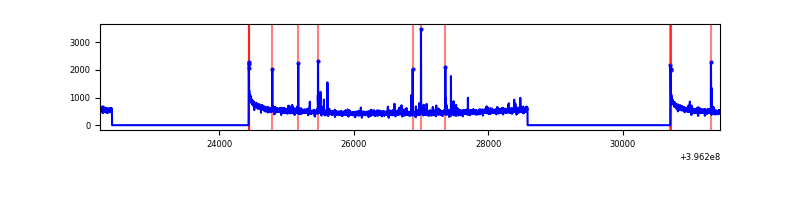 |
| B | 9218 | 5062 | 1 | 1 | 0.01% | 0.02% | 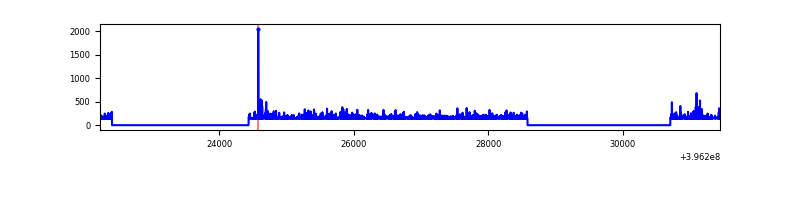 |
| C | 9219 | 5065 | 82 | 82 | 0.89% | 1.62% | 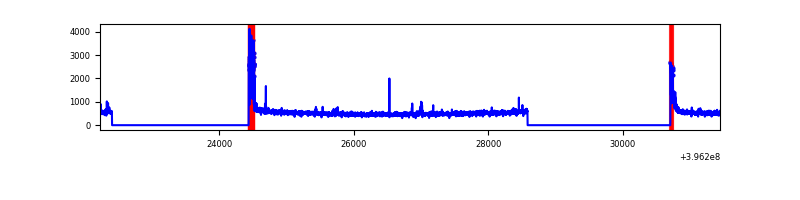 |
| D | 9219 | 5065 | 274 | 274 | 2.97% | 5.41% | 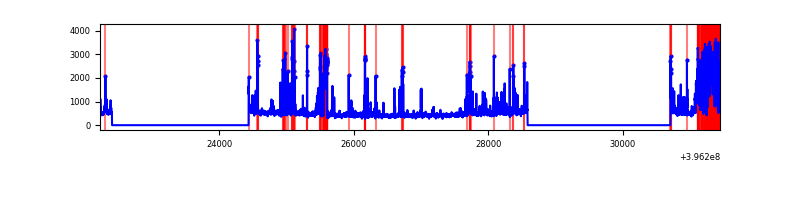 |
Top three noisy pixels from each quadrant. If the there are fewer than three noisy pixels in the level2.evt file, extra rows are filled as -1
| Pixel properties | Quadrant properties | ||||||
|---|---|---|---|---|---|---|---|
| Quadrant | DetID | PixID | Counts | Sigma | Mean | Median | Sigma |
| A | 10 | 83 | 214434 | 1786.7 | 594 | 584 | 119.7 |
| A | 9 | 143 | 41915 | 345.32 | 594 | 584 | 119.7 |
| A | 15 | 223 | 15094 | 121.23 | 594 | 584 | 119.7 |
| B | 12 | 243 | 702739 | 187444.39 | 10 | 10 | 3.7 |
| B | 12 | 144 | 12869 | 3429.98 | 10 | 10 | 3.7 |
| B | 5 | 172 | 8738 | 2328.09 | 10 | 10 | 3.7 |
| C | 0 | 10 | 282938 | 2087.19 | 588 | 592 | 135.3 |
| C | 15 | 214 | 211949 | 1562.42 | 588 | 592 | 135.3 |
| C | 3 | 233 | 33070 | 240.09 | 588 | 592 | 135.3 |
| D | 12 | 217 | 488297 | 3483.48 | 574 | 557 | 140.0 |
| D | 13 | 171 | 207563 | 1478.45 | 574 | 557 | 140.0 |
| D | 12 | 17 | 176526 | 1256.78 | 574 | 557 | 140.0 |
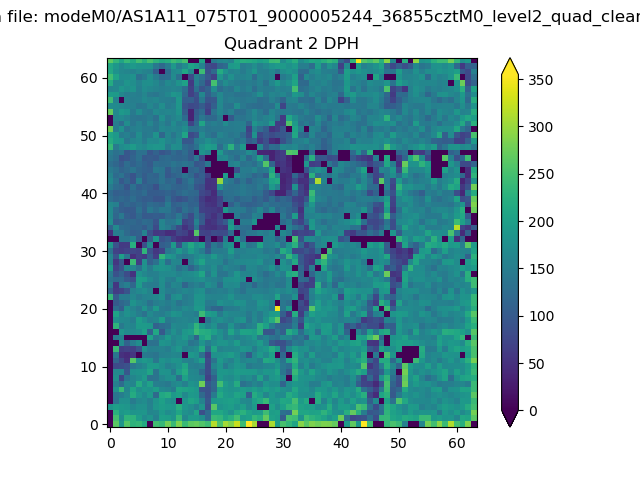
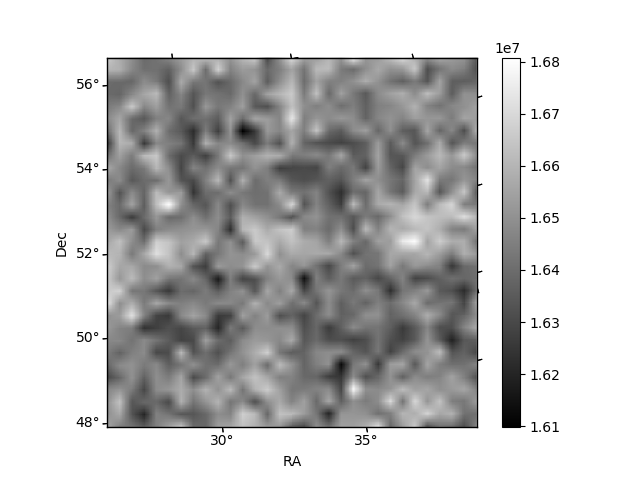
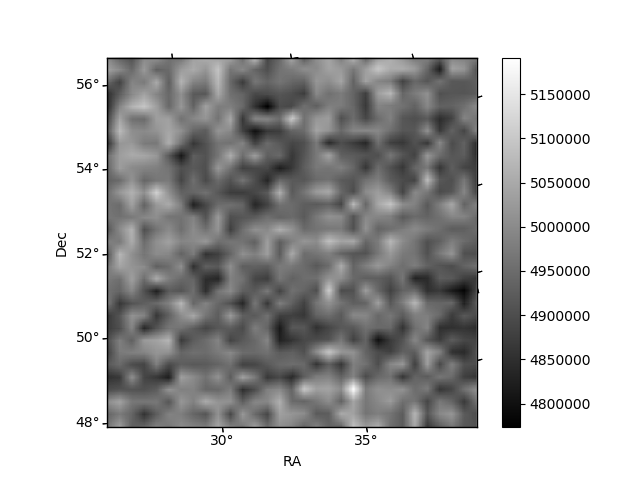
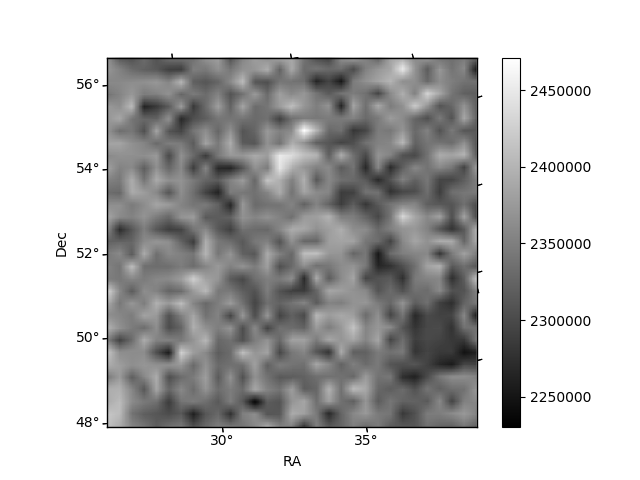
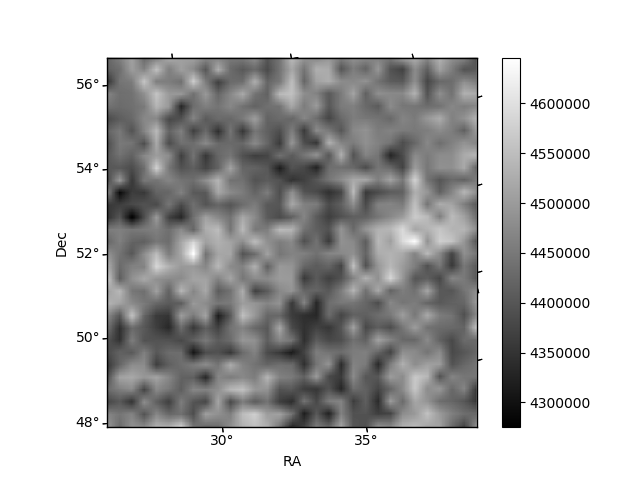
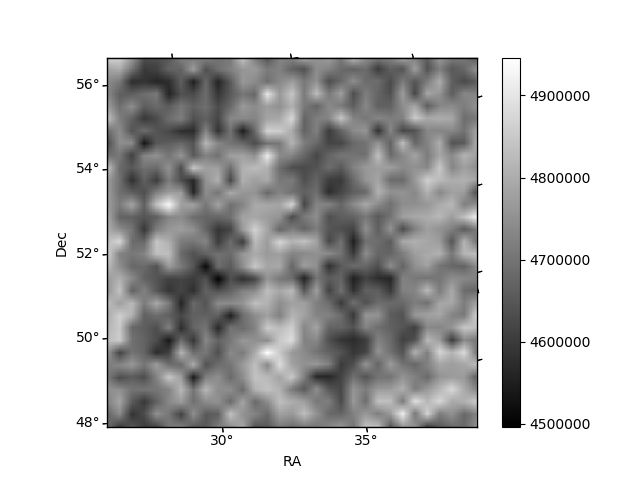
Histogram calculated using DETX and DETY for each event in the final _common_clean file
| Quadrant A | 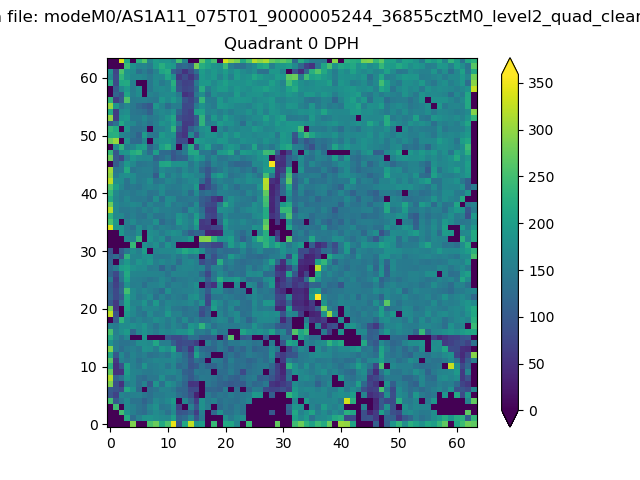 |
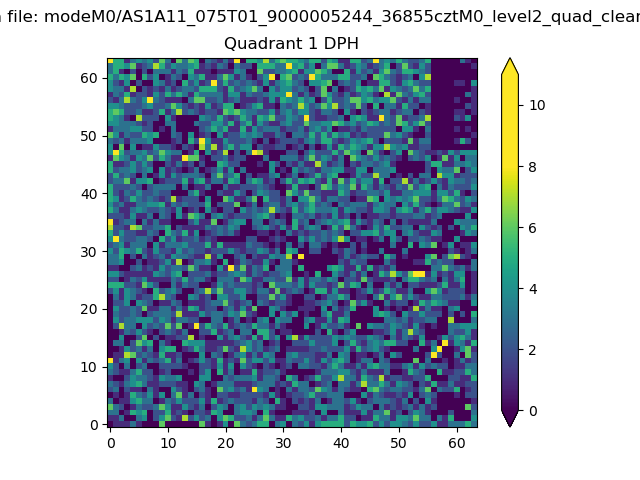 |
Quadrant B |
|---|---|---|---|
| Quadrant D | 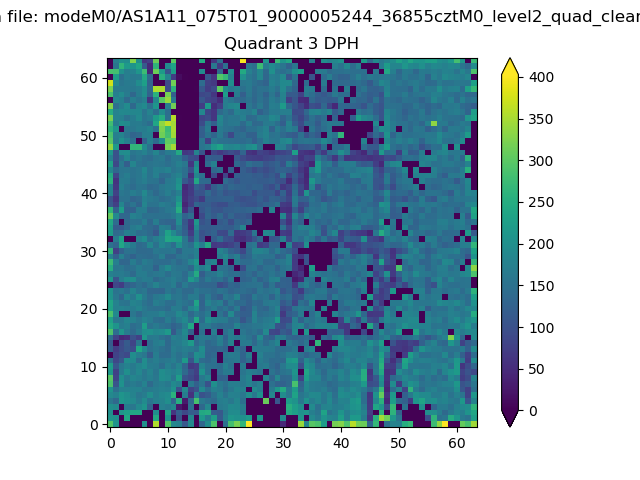 |
 |
Quadrant C |
| Plot type | Count rate plots | Images |
|---|---|---|
| Comparison with Poisson distribution Blue bars denote a histogram of data divided into 1 sec bins. Red curve is a Poisson curve with rate = median count rate of data. |
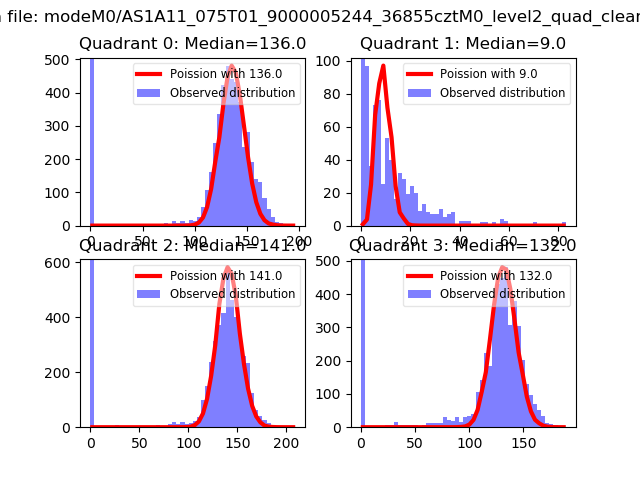 |
 |
| Quadrant-wise count rates Data is divided into 100 sec bins |
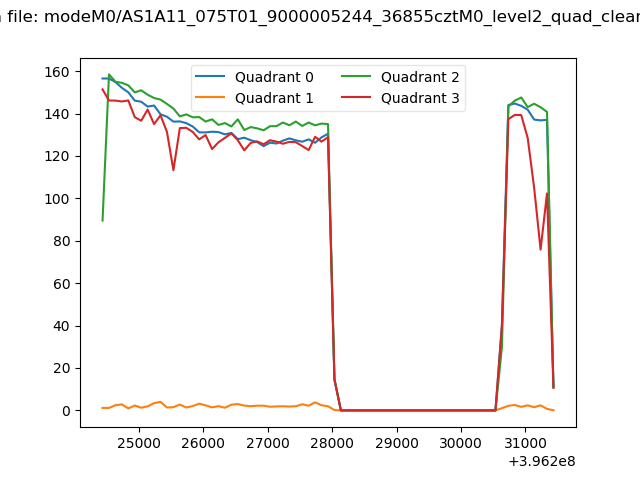 |
|
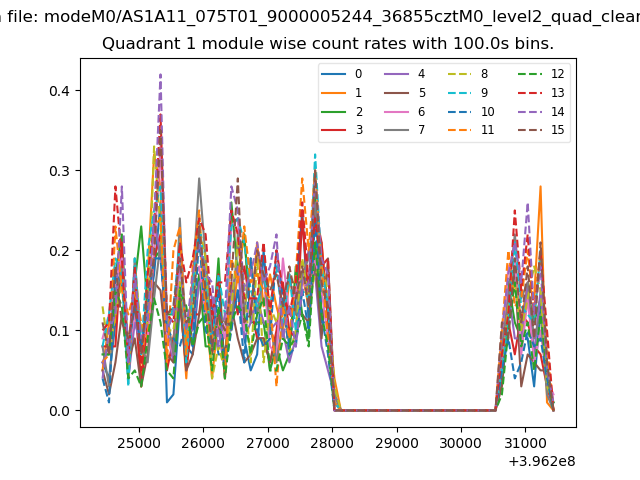
| Module-wise count rates for Quadrant A Data is divided into 100 sec bins |
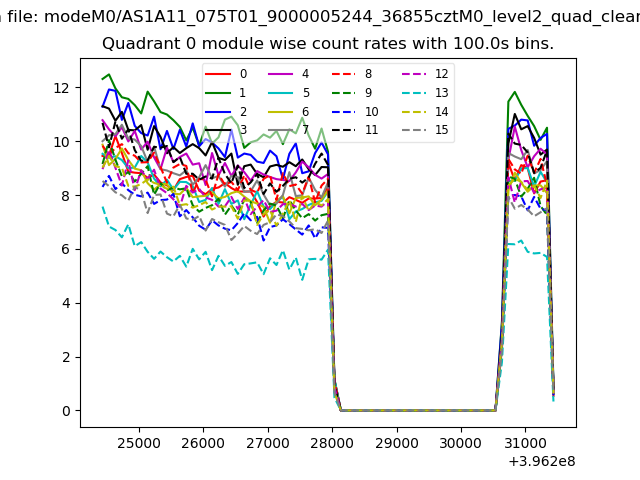 |
 |
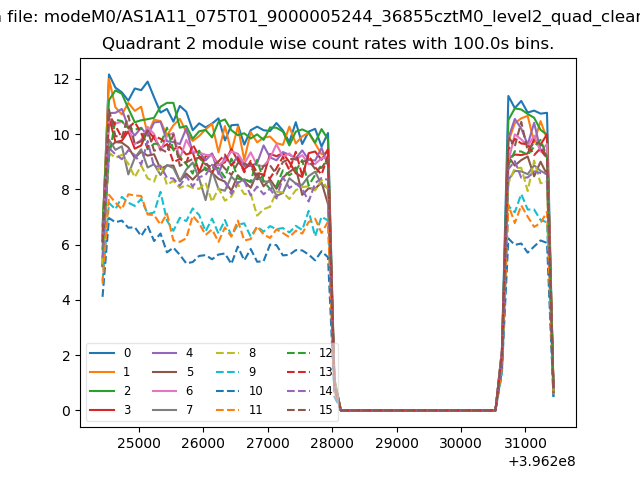
| Module-wise count rates for Quadrant B Data is divided into 100 sec bins |
 |
 |
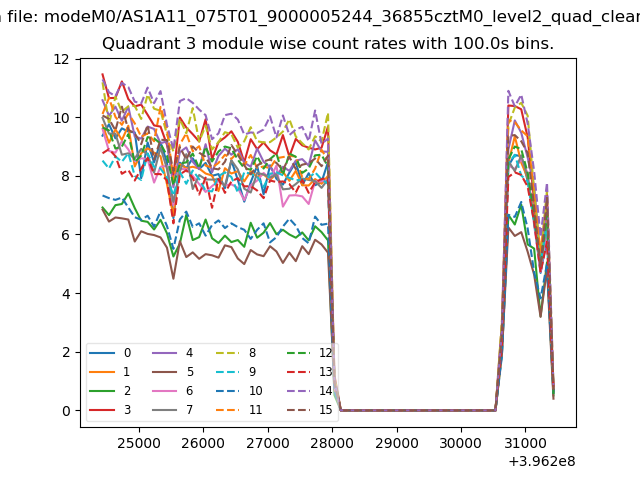
| Module-wise count rates for Quadrant C Data is divided into 100 sec bins |
 |
 |
| Module-wise count rates for Quadrant D Data is divided into 100 sec bins |
 |
 |
| Parameter | Plot |
|---|---|
| CZT HV Monitor | 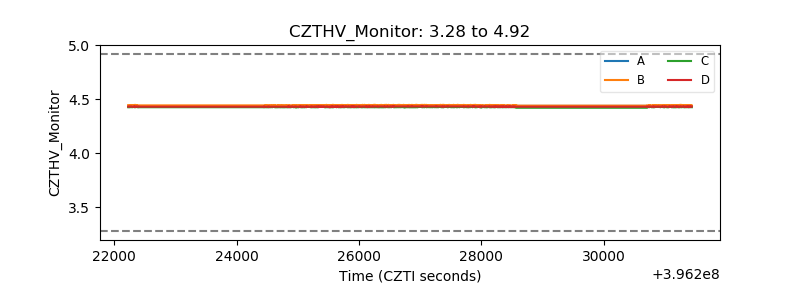 |
| D_VDD | 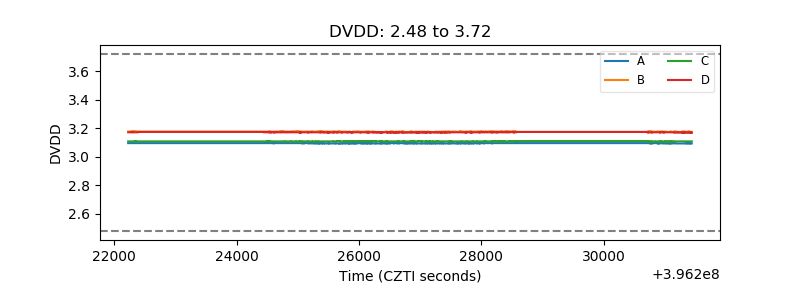 |
| Temperature 1 | 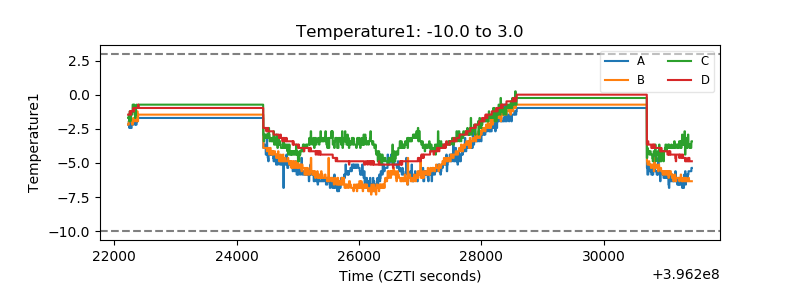 |
| Veto HV Monitor | 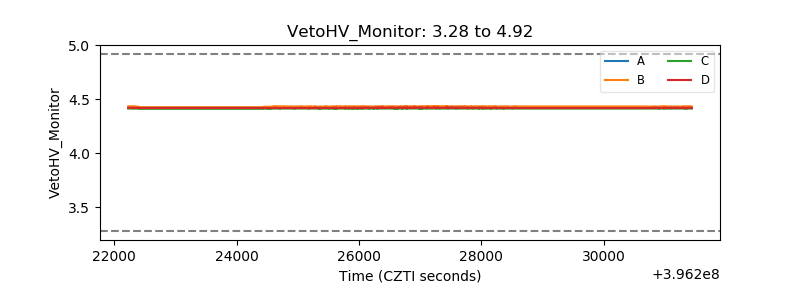 |
| Veto LLD | 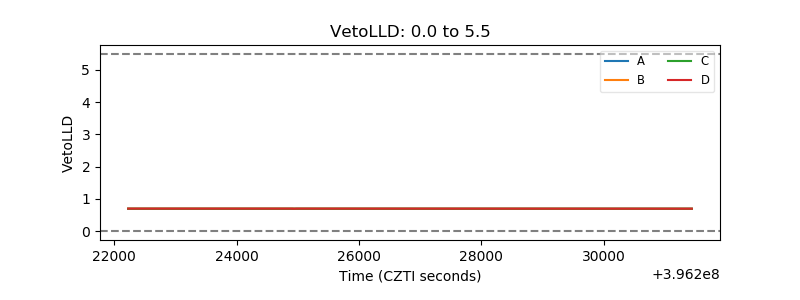 |
| Alpha Counter | 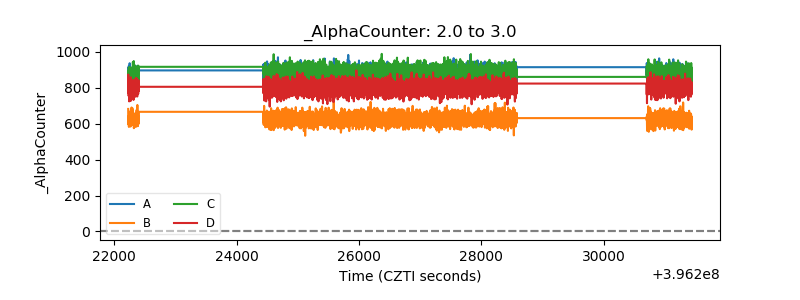 |
| _CPM_Rate | 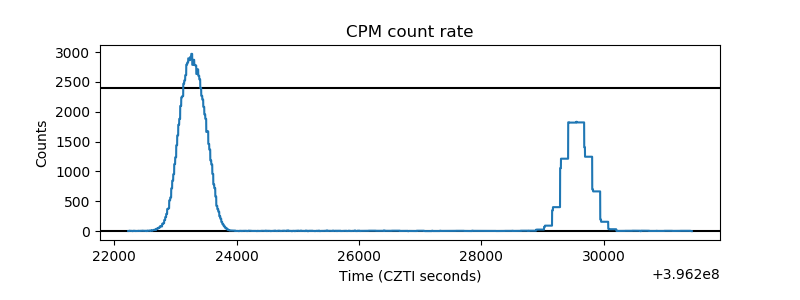 |
| CZT Counter | 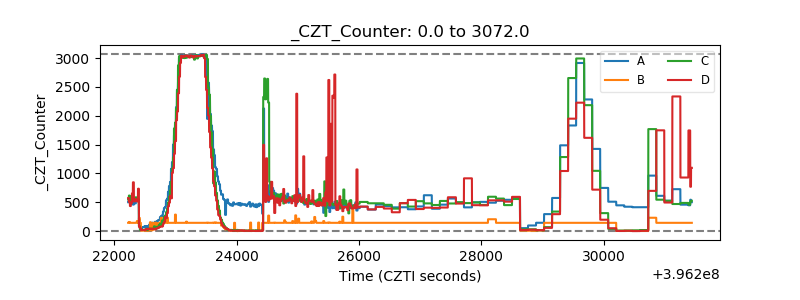 |
| +2.5 Volts monitor |  |
| +5 Volts monitor | 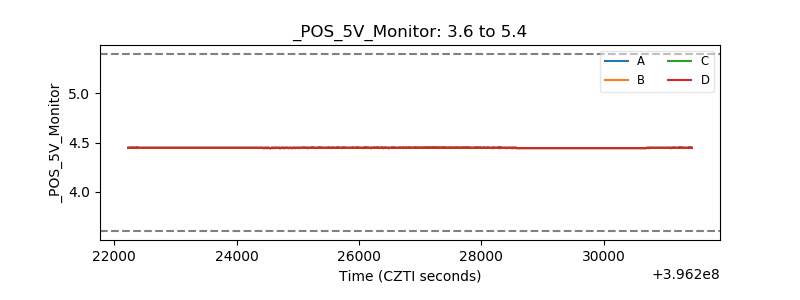 |
| _ROLL_ROT |  |
| _Roll_DEC |  |
| _Roll_RA | 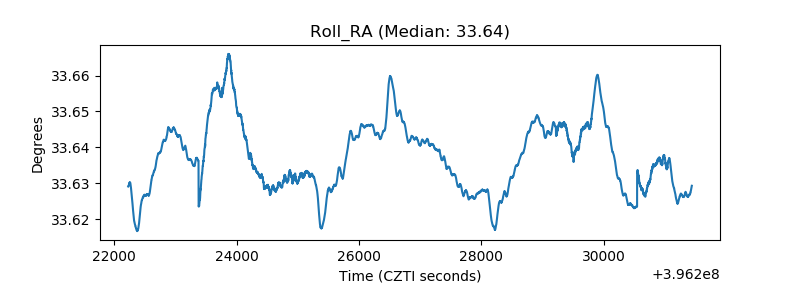 |
| Veto Counter | 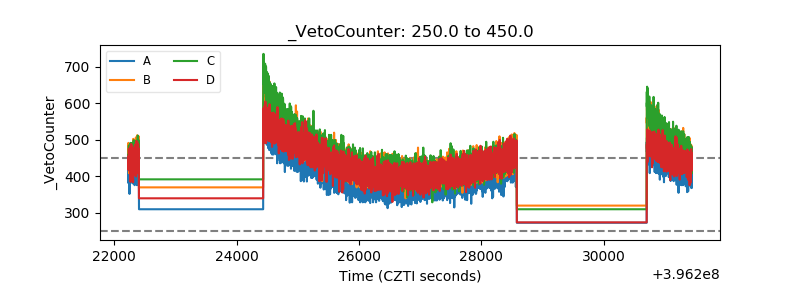 |