| Param | Original file | Final file |
|---|---|---|
| Filename | modeM0/AS1A11_075T01_9000005244_36856cztM0_level2.evt | modeM0/AS1A11_075T01_9000005244_36856cztM0_level2_quad_clean.evt |
| Size (bytes) | 359,424,000 | 61,274,880 |
| Size | 342.8 MB | 58.4 MB |
| Events in quadrant A | 2,396,287 | 509,762 |
| Events in quadrant B | 752,089 | 8,422 |
| Events in quadrant C | 2,791,930 | 524,923 |
| Events in quadrant D | 4,604,271 | 464,083 |
| Mode SS | |||
|---|---|---|---|
| Quadrant | BADHDUFLAG | Total packets | Discarded packets |
| A | 0 | 102 | 0 |
| B | 0 | 102 | 0 |
| C | 0 | 102 | 0 |
| D | 0 | 102 | 0 |
| Mode M0 | |||
|---|---|---|---|
| Quadrant | BADHDUFLAG | Total packets | Discarded packets |
| A | 0 | 10340 | 3 |
| B | 0 | 5003 | 2 |
| C | 0 | 11380 | 2 |
| D | 0 | 17050 | 2 |
| Mode M9 | |||
|---|---|---|---|
| Quadrant | BADHDUFLAG | Total packets | Discarded packets |
| A | 0 | 30 | 0 |
| B | 0 | 30 | 0 |
| C | 0 | 30 | 0 |
| D | 0 | 31 | 0 |
| Quadrant | Total seconds | Saturated seconds | Saturation percentage |
|---|---|---|---|
| A | 4927 | 6 | 0.121778% |
| B | 4927 | 4927 | 100.000000% |
| C | 4927 | 95 | 1.928151% |
| D | 4927 | 566 | 11.487721% |
Noise dominated data is calculated using 1-second bins in cleaned event files. If a bin has >2000 counts, and if more than 50% of those come from <1% of pixels, then it is considered to be noise-dominated and hence unusable.
| Quadrant | # 1 sec bins | Bins with >0 counts | Bins with >2000 counts | High rate bins dominated by noise | Noise dominated (total time) | Noise dominated (detector-on time) | Marked lightcurve |
|---|---|---|---|---|---|---|---|
| A | 7050 | 4928 | 4 | 4 | 0.06% | 0.08% | 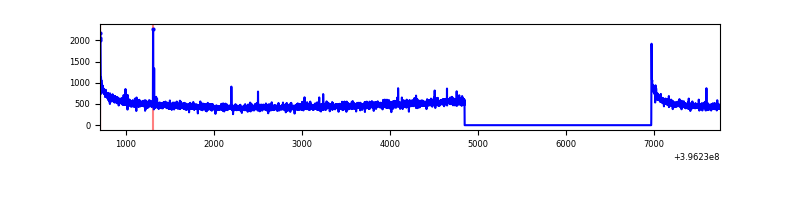 |
| B | 7049 | 4926 | 0 | 0 | 0.00% | 0.00% | 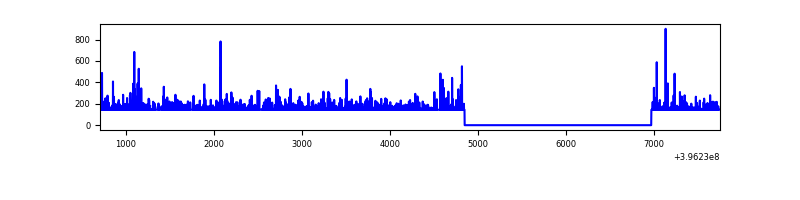 |
| C | 7050 | 4928 | 62 | 62 | 0.88% | 1.26% | 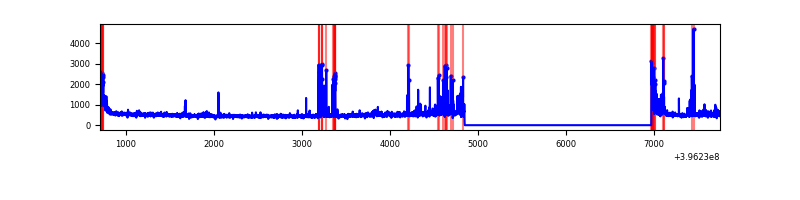 |
| D | 7050 | 4928 | 572 | 572 | 8.11% | 11.61% | 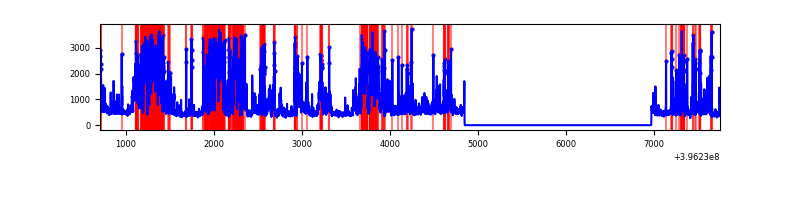 |
Top three noisy pixels from each quadrant. If the there are fewer than three noisy pixels in the level2.evt file, extra rows are filled as -1
| Pixel properties | Quadrant properties | ||||||
|---|---|---|---|---|---|---|---|
| Quadrant | DetID | PixID | Counts | Sigma | Mean | Median | Sigma |
| A | 10 | 83 | 212039 | 1881.95 | 556 | 545 | 112.4 |
| A | 13 | 6 | 16888 | 145.43 | 556 | 545 | 112.4 |
| A | 13 | 254 | 7836 | 64.88 | 556 | 545 | 112.4 |
| B | 12 | 243 | 683776 | 182527.51 | 10 | 10 | 3.7 |
| B | 12 | 144 | 12478 | 3328.26 | 10 | 10 | 3.7 |
| B | 0 | 213 | 5407 | 1440.7 | 10 | 10 | 3.7 |
| C | 14 | 254 | 235747 | 1845.31 | 547 | 551 | 127.5 |
| C | 15 | 214 | 208405 | 1630.79 | 547 | 551 | 127.5 |
| C | 0 | 10 | 203320 | 1590.9 | 547 | 551 | 127.5 |
| D | 12 | 17 | 1423800 | 11278.62 | 520 | 505 | 126.2 |
| D | 12 | 217 | 506159 | 4006.96 | 520 | 505 | 126.2 |
| D | 13 | 249 | 264735 | 2093.84 | 520 | 505 | 126.2 |
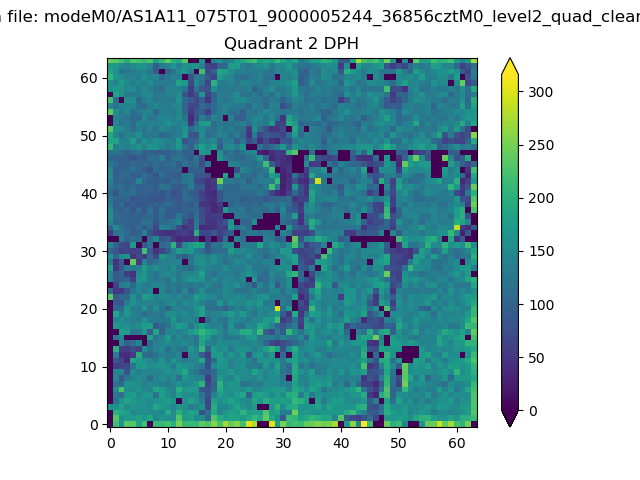
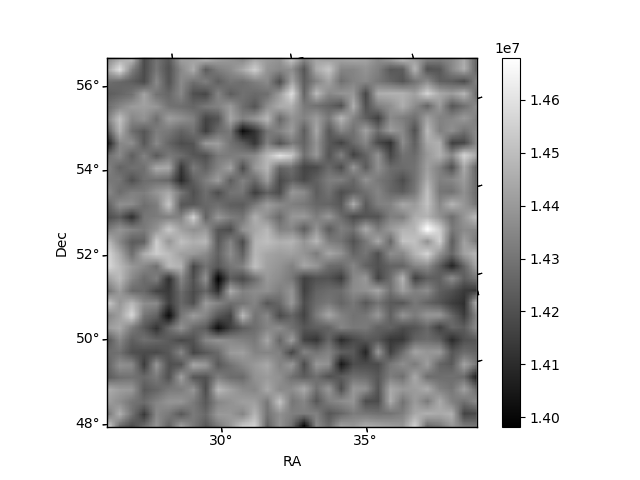
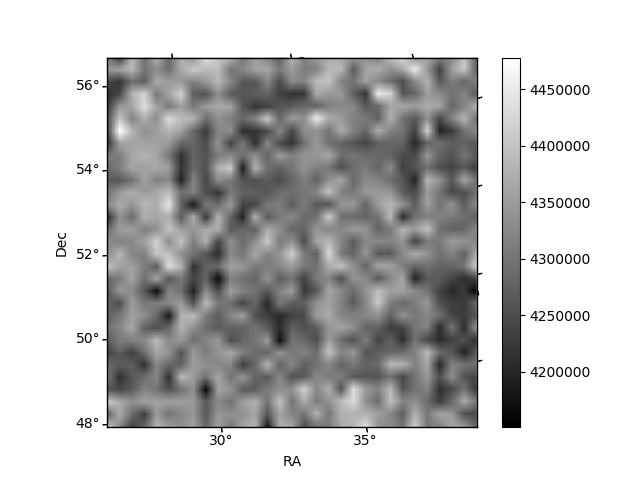
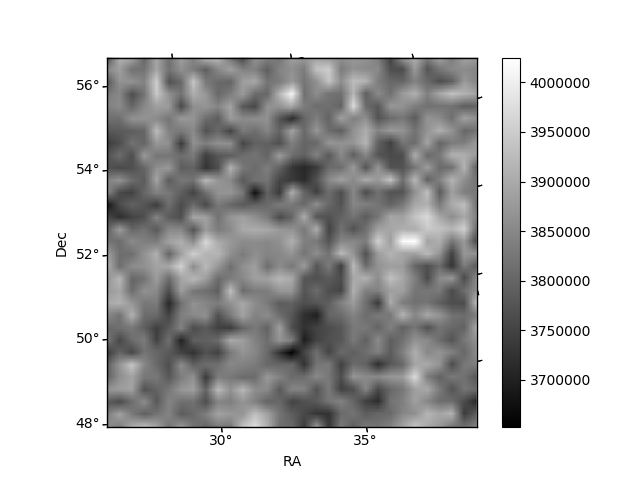
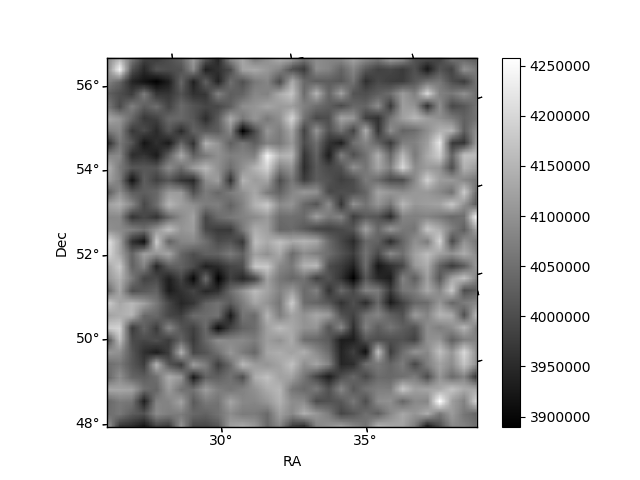
Histogram calculated using DETX and DETY for each event in the final _common_clean file
| Quadrant A | 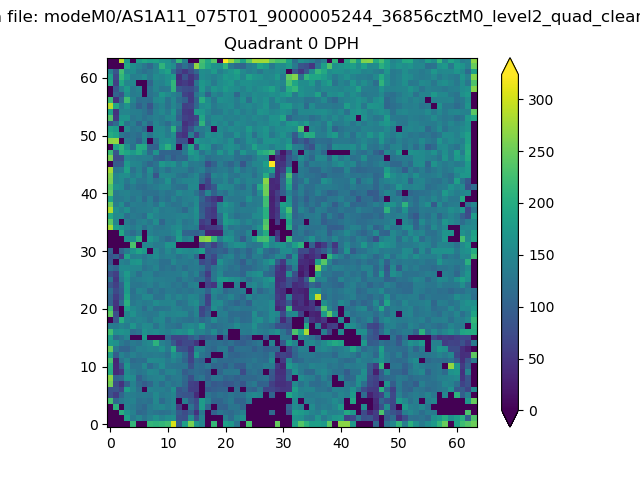 |
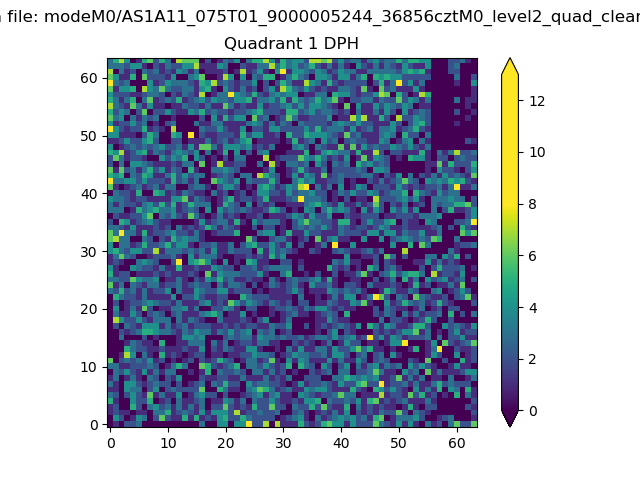 |
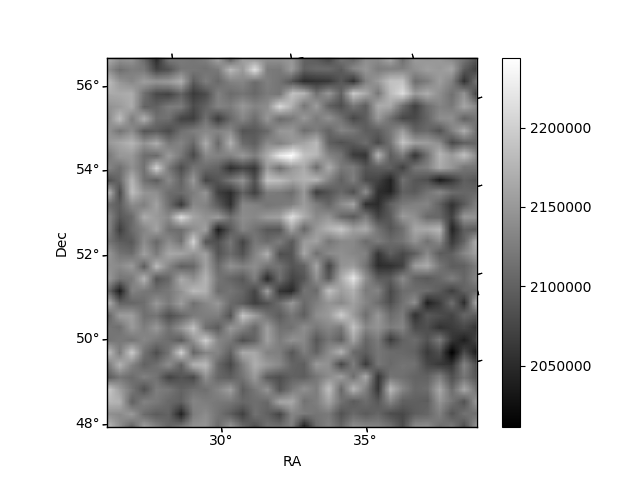
Quadrant B |
|---|---|---|---|
| Quadrant D | 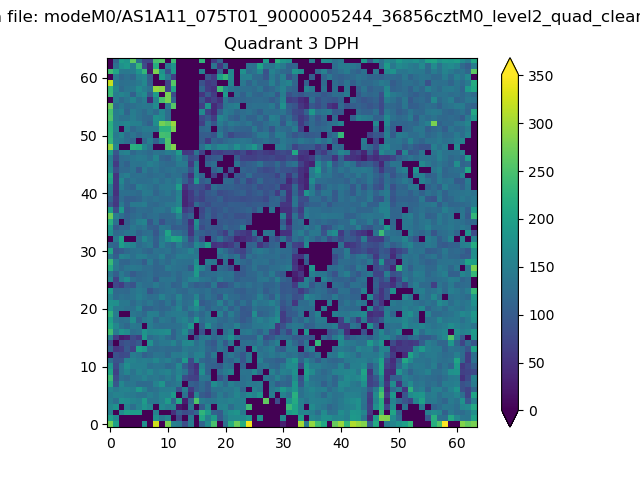 |
 |
Quadrant C |
| Plot type | Count rate plots | Images |
|---|---|---|
| Comparison with Poisson distribution Blue bars denote a histogram of data divided into 1 sec bins. Red curve is a Poisson curve with rate = median count rate of data. |
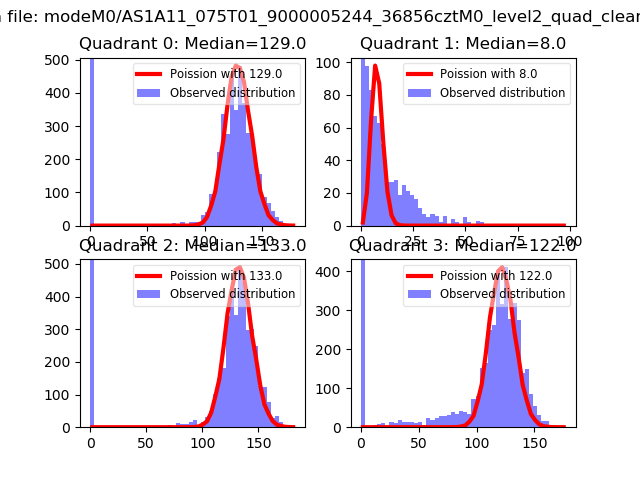 |
 |
| Quadrant-wise count rates Data is divided into 100 sec bins |
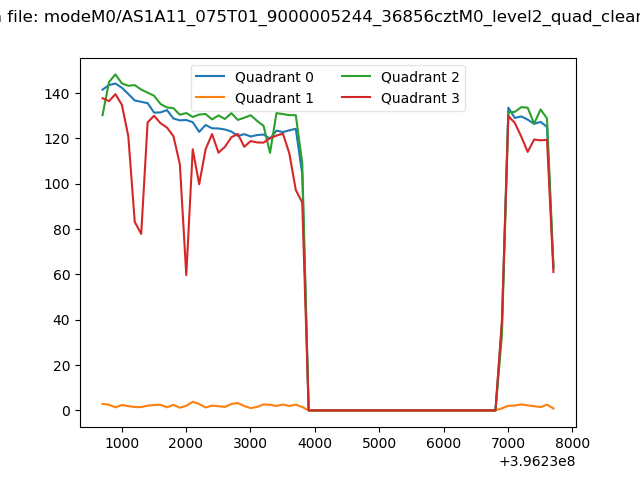 |
|
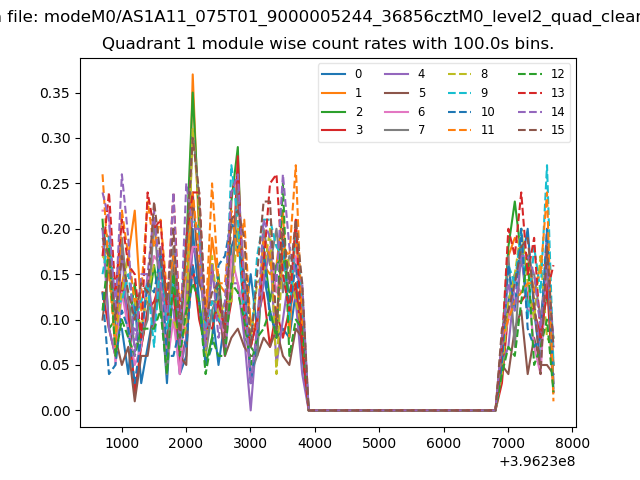
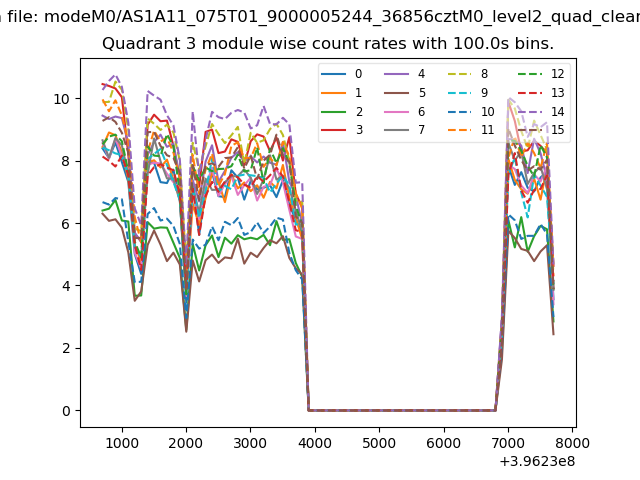
| Module-wise count rates for Quadrant A Data is divided into 100 sec bins |
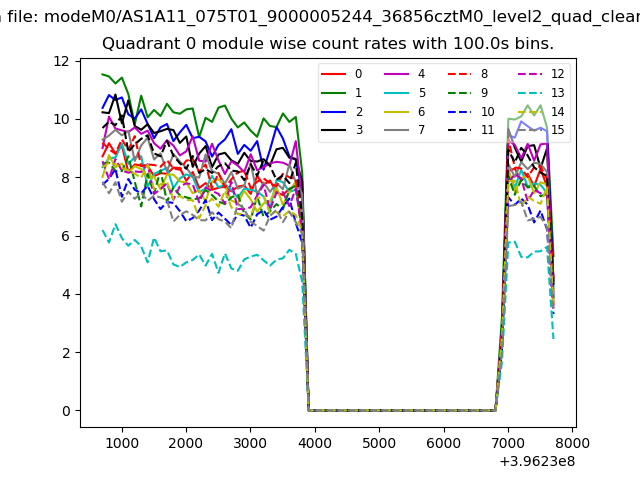 |
 |
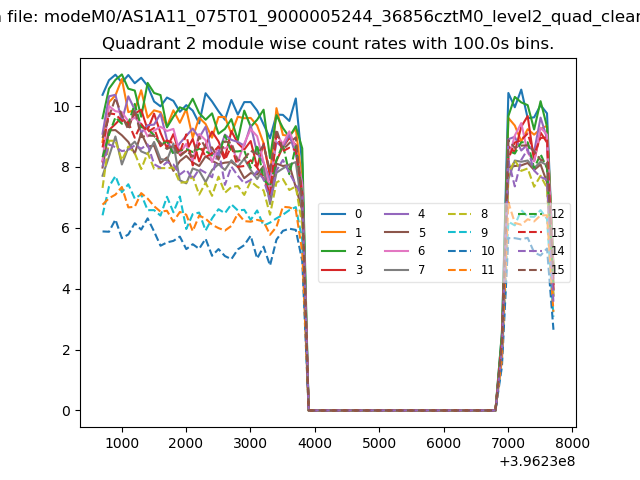
| Module-wise count rates for Quadrant B Data is divided into 100 sec bins |
 |
 |
| Module-wise count rates for Quadrant C Data is divided into 100 sec bins |
 |
 |
| Module-wise count rates for Quadrant D Data is divided into 100 sec bins |
 |
 |
| Parameter | Plot |
|---|---|
| CZT HV Monitor | 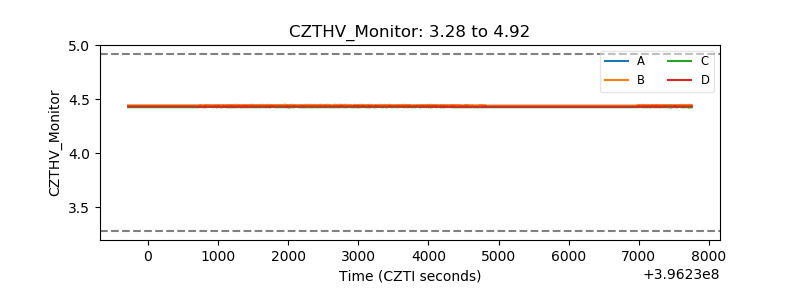 |
| D_VDD | 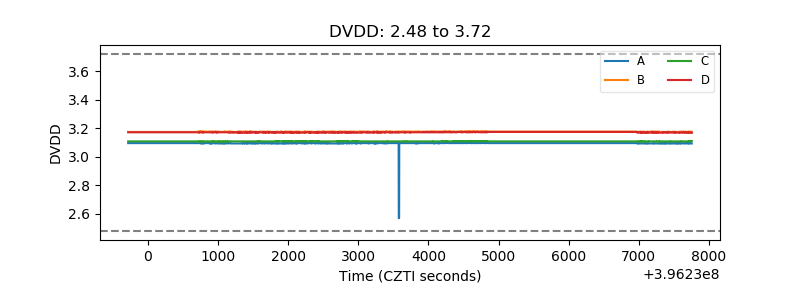 |
| Temperature 1 | 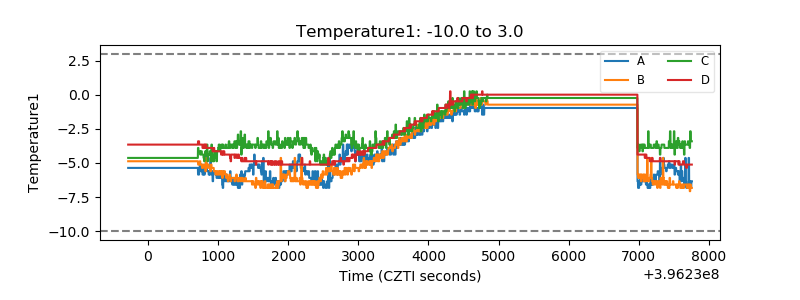 |
| Veto HV Monitor | 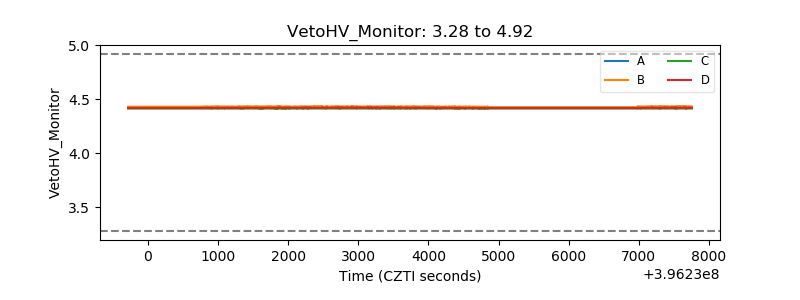 |
| Veto LLD | 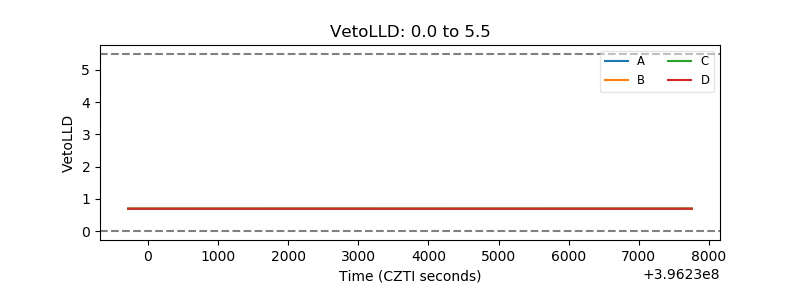 |
| Alpha Counter | 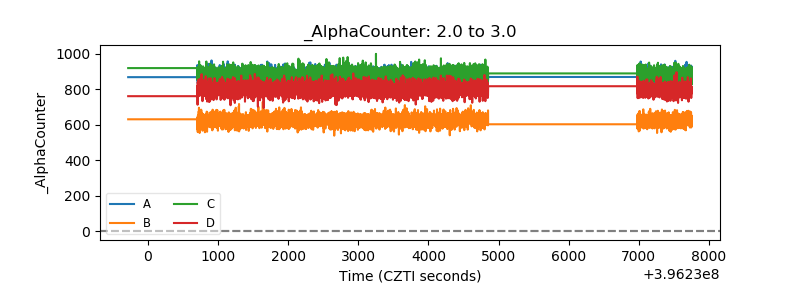 |
| _CPM_Rate | 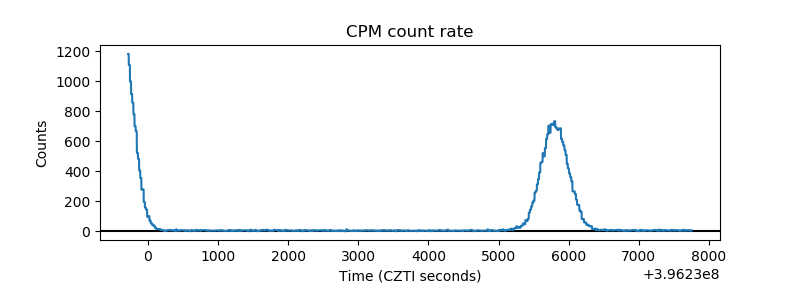 |
| CZT Counter | 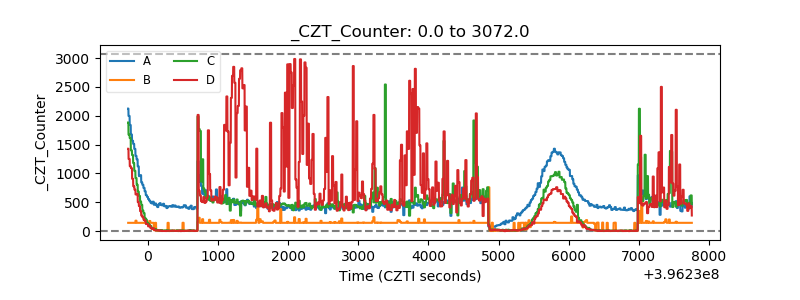 |
| +2.5 Volts monitor | 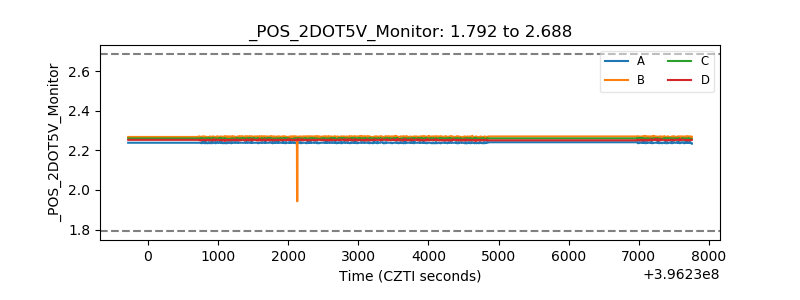 |
| +5 Volts monitor | 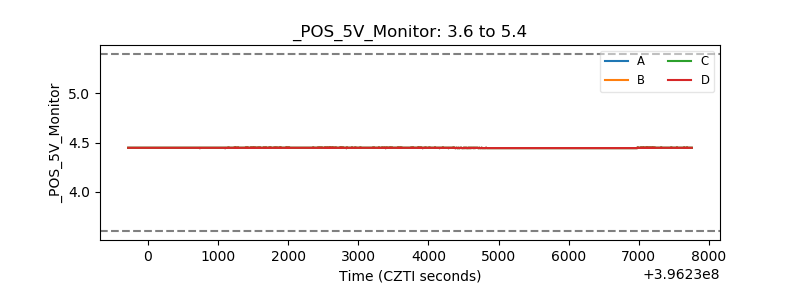 |
| _ROLL_ROT | 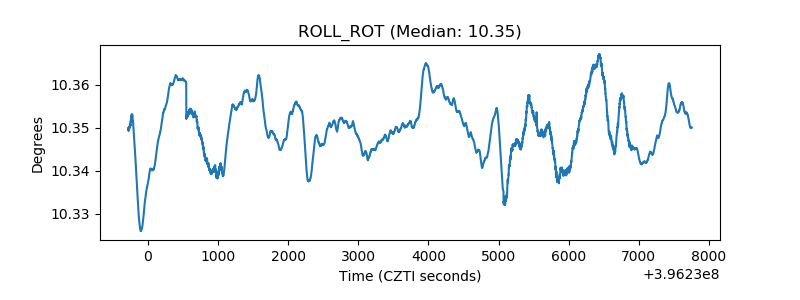 |
| _Roll_DEC |  |
| _Roll_RA | 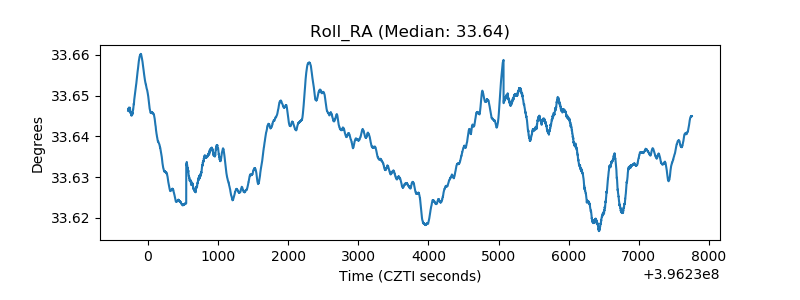 |
| Veto Counter | 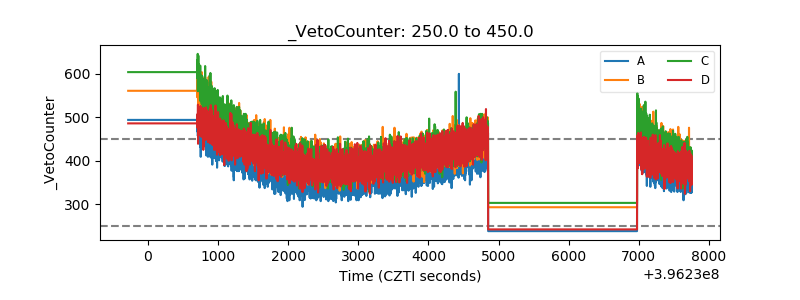 |