| Param | Original file | Final file |
|---|---|---|
| Filename | modeM0/AS1A11_075T01_9000005244_36857cztM0_level2.evt | modeM0/AS1A11_075T01_9000005244_36857cztM0_level2_quad_clean.evt |
| Size (bytes) | 372,801,600 | 58,334,400 |
| Size | 355.5 MB | 55.6 MB |
| Events in quadrant A | 2,541,809 | 464,672 |
| Events in quadrant B | 816,634 | 7,591 |
| Events in quadrant C | 2,862,109 | 477,842 |
| Events in quadrant D | 4,699,944 | 438,953 |
| Mode SS | |||
|---|---|---|---|
| Quadrant | BADHDUFLAG | Total packets | Discarded packets |
| A | 0 | 110 | 0 |
| B | 0 | 110 | 0 |
| C | 0 | 110 | 0 |
| D | 0 | 110 | 0 |
| Mode M0 | |||
|---|---|---|---|
| Quadrant | BADHDUFLAG | Total packets | Discarded packets |
| A | 0 | 11137 | 3 |
| B | 0 | 5437 | 2 |
| C | 0 | 11925 | 2 |
| D | 0 | 17711 | 2 |
| Mode M9 | |||
|---|---|---|---|
| Quadrant | BADHDUFLAG | Total packets | Discarded packets |
| A | 0 | 38 | 0 |
| B | 0 | 38 | 0 |
| C | 0 | 38 | 0 |
| D | 0 | 39 | 0 |
| Quadrant | Total seconds | Saturated seconds | Saturation percentage |
|---|---|---|---|
| A | 5354 | 8 | 0.149421% |
| B | 5354 | 5354 | 100.000000% |
| C | 5354 | 46 | 0.859171% |
| D | 5354 | 478 | 8.927904% |
Noise dominated data is calculated using 1-second bins in cleaned event files. If a bin has >2000 counts, and if more than 50% of those come from <1% of pixels, then it is considered to be noise-dominated and hence unusable.
| Quadrant | # 1 sec bins | Bins with >0 counts | Bins with >2000 counts | High rate bins dominated by noise | Noise dominated (total time) | Noise dominated (detector-on time) | Marked lightcurve |
|---|---|---|---|---|---|---|---|
| A | 7357 | 5355 | 1 | 1 | 0.01% | 0.02% | 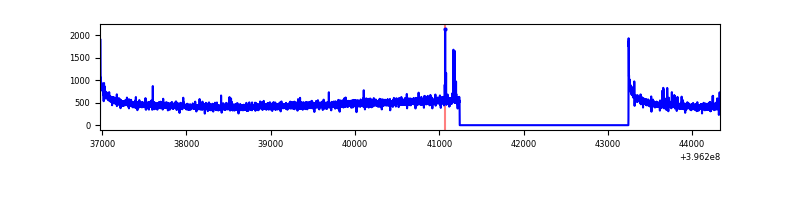 |
| B | 7356 | 5353 | 0 | 0 | 0.00% | 0.00% | 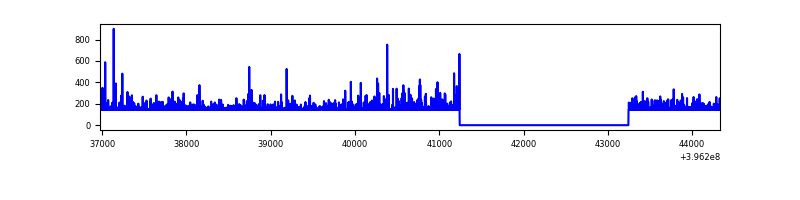 |
| C | 7357 | 5355 | 33 | 33 | 0.45% | 0.62% | 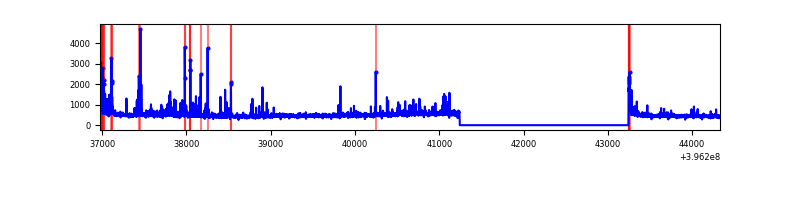 |
| D | 7357 | 5355 | 438 | 438 | 5.95% | 8.18% | 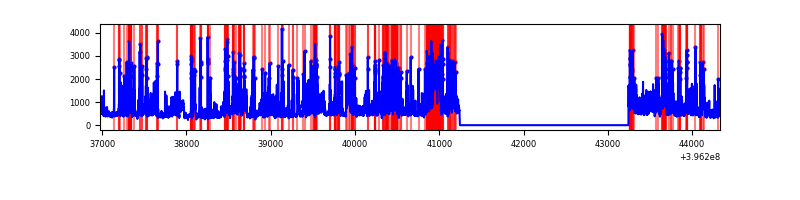 |
Top three noisy pixels from each quadrant. If the there are fewer than three noisy pixels in the level2.evt file, extra rows are filled as -1
| Pixel properties | Quadrant properties | ||||||
|---|---|---|---|---|---|---|---|
| Quadrant | DetID | PixID | Counts | Sigma | Mean | Median | Sigma |
| A | 10 | 83 | 225906 | 1909.37 | 586 | 575 | 118.0 |
| A | 13 | 248 | 16480 | 134.77 | 586 | 575 | 118.0 |
| A | 13 | 6 | 14631 | 119.11 | 586 | 575 | 118.0 |
| B | 12 | 243 | 742940 | 178603.84 | 12 | 11 | 4.2 |
| B | 12 | 144 | 13843 | 3325.28 | 12 | 11 | 4.2 |
| B | 0 | 213 | 4788 | 1148.41 | 12 | 11 | 4.2 |
| C | 0 | 10 | 248847 | 1857.94 | 574 | 580 | 133.6 |
| C | 15 | 214 | 229773 | 1715.2 | 574 | 580 | 133.6 |
| C | 14 | 254 | 109495 | 815.08 | 574 | 580 | 133.6 |
| D | 13 | 171 | 781676 | 5842.17 | 548 | 531 | 133.7 |
| D | 12 | 227 | 449153 | 3355.23 | 548 | 531 | 133.7 |
| D | 13 | 249 | 369706 | 2761.05 | 548 | 531 | 133.7 |
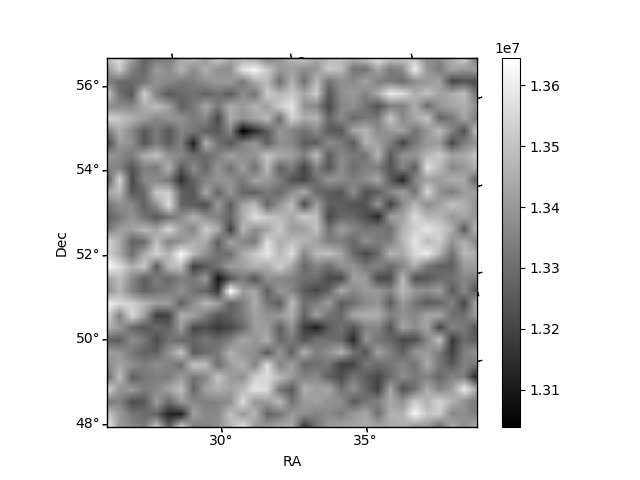
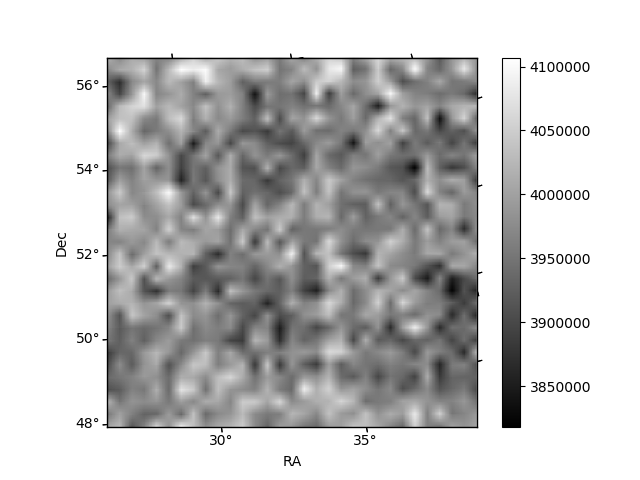
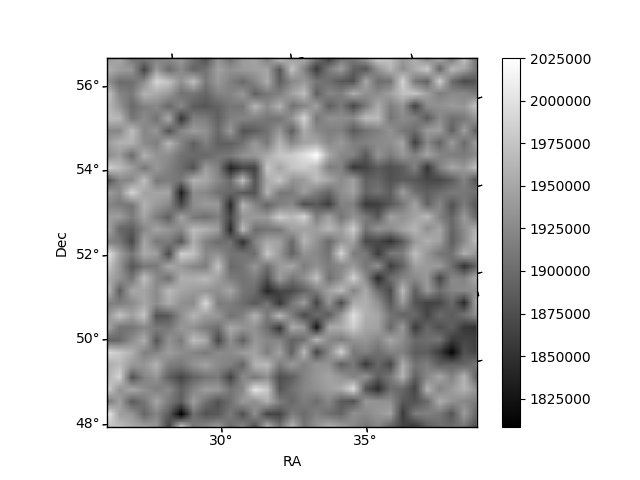
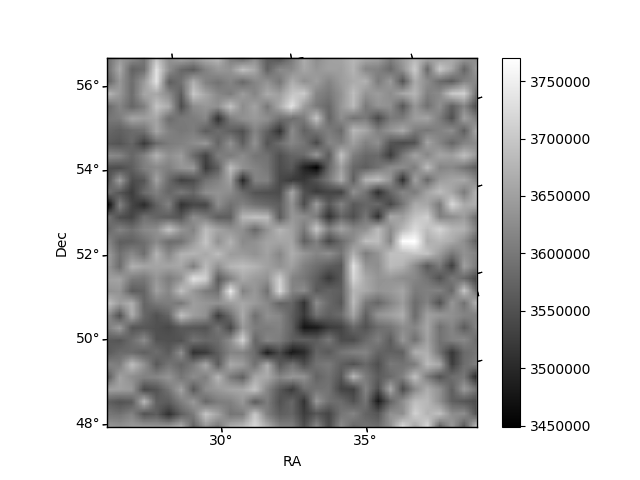
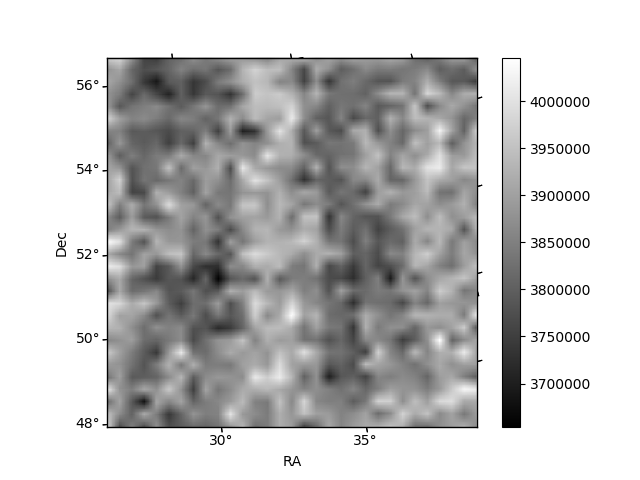
Histogram calculated using DETX and DETY for each event in the final _common_clean file
| Quadrant A | 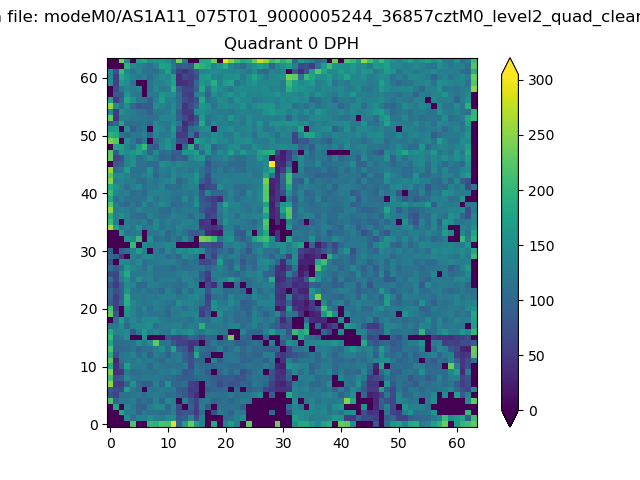 |
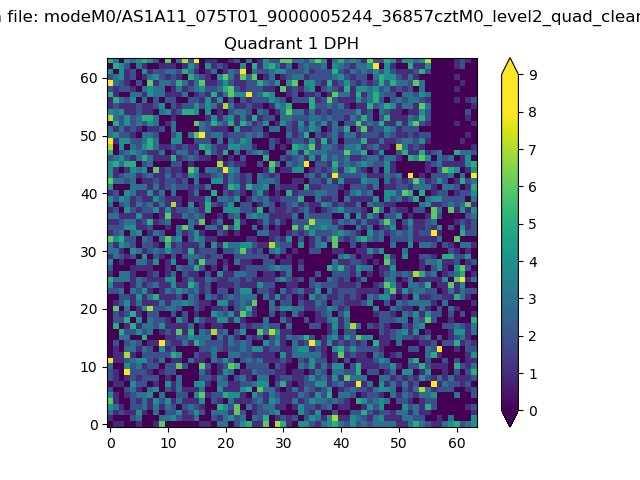 |
Quadrant B |
|---|---|---|---|
| Quadrant D |  |
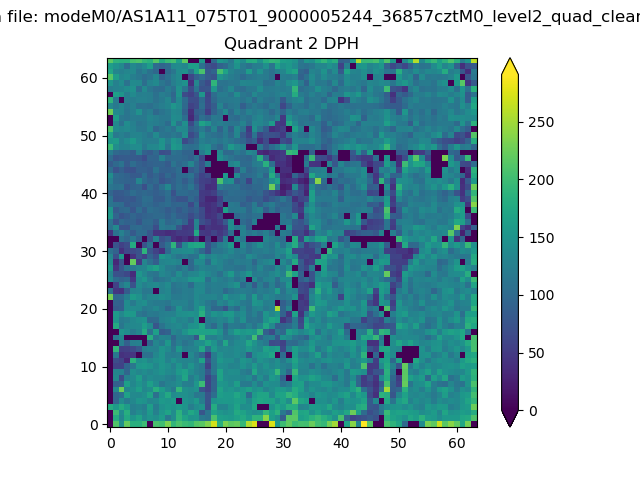 |
Quadrant C |
| Plot type | Count rate plots | Images |
|---|---|---|
| Comparison with Poisson distribution Blue bars denote a histogram of data divided into 1 sec bins. Red curve is a Poisson curve with rate = median count rate of data. |
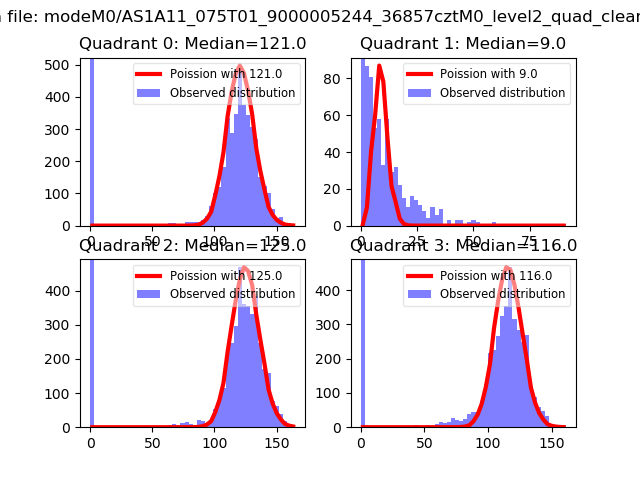 |
 |
| Quadrant-wise count rates Data is divided into 100 sec bins |
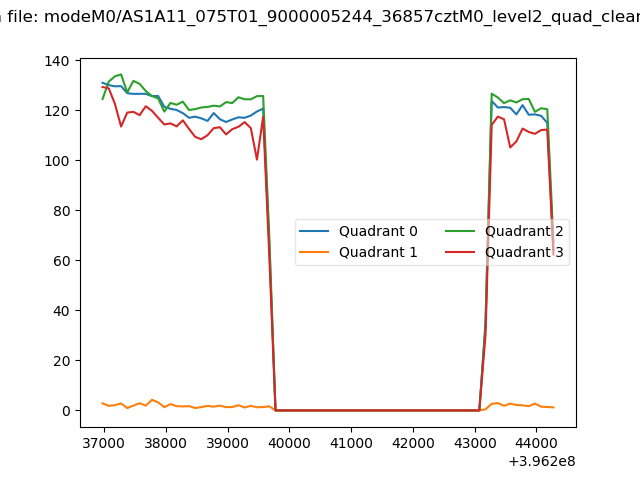 |
|
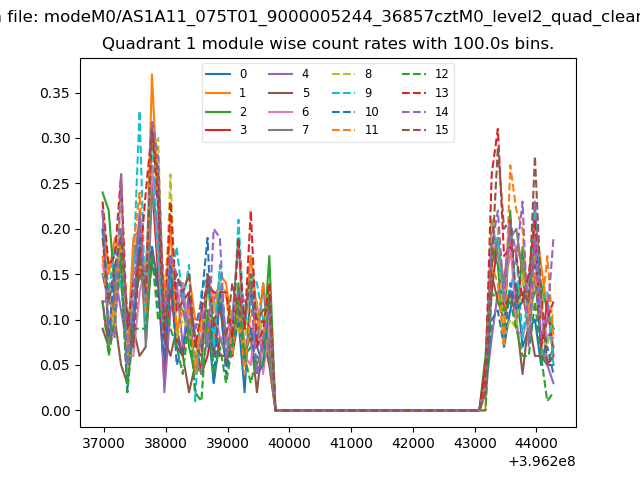
| Module-wise count rates for Quadrant A Data is divided into 100 sec bins |
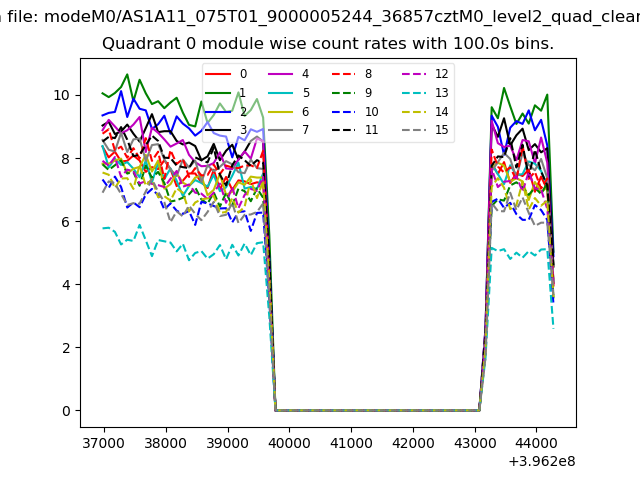 |
 |
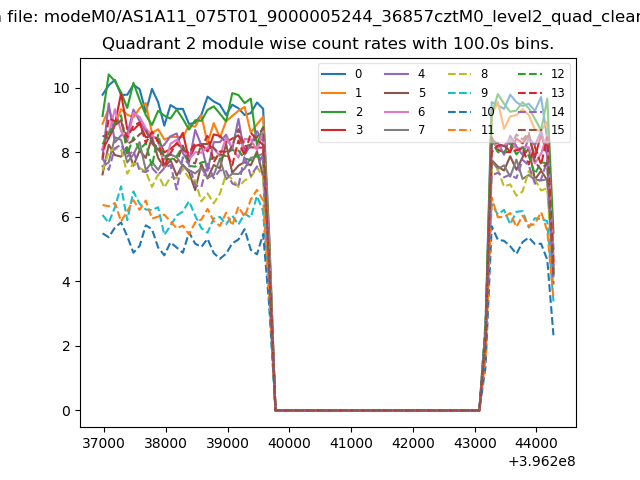
| Module-wise count rates for Quadrant B Data is divided into 100 sec bins |
 |
 |
| Module-wise count rates for Quadrant C Data is divided into 100 sec bins |
 |
 |
| Module-wise count rates for Quadrant D Data is divided into 100 sec bins |
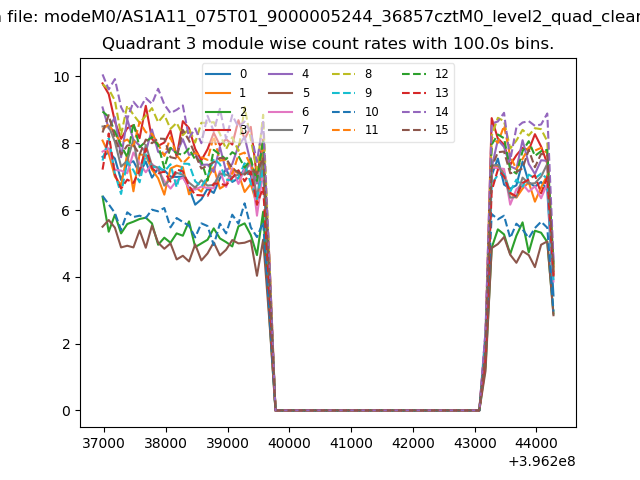 |
 |
| Parameter | Plot |
|---|---|
| CZT HV Monitor | 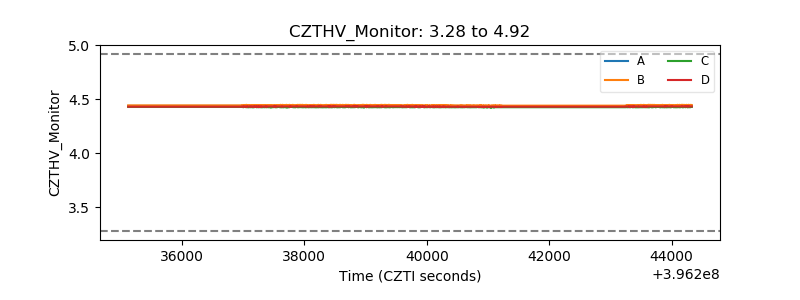 |
| D_VDD | 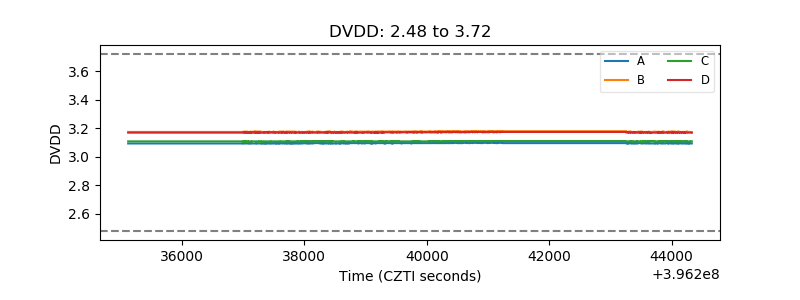 |
| Temperature 1 | 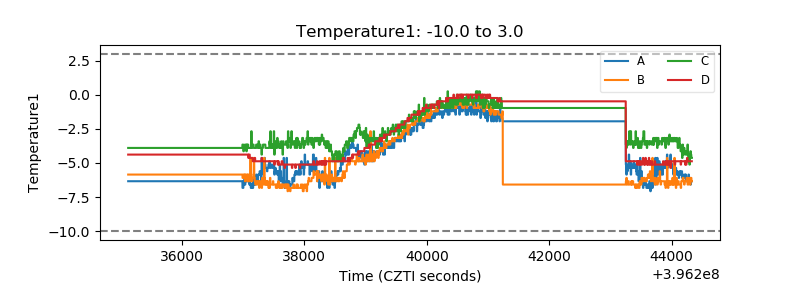 |
| Veto HV Monitor | 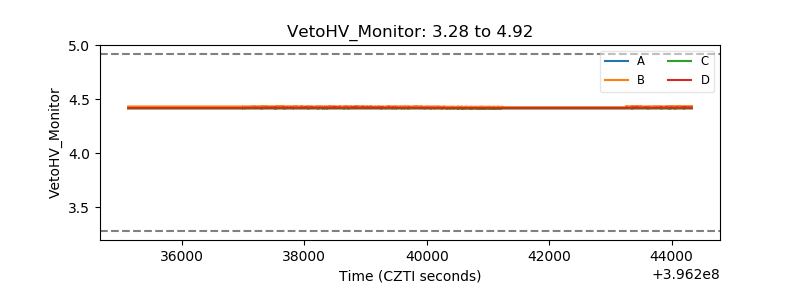 |
| Veto LLD | 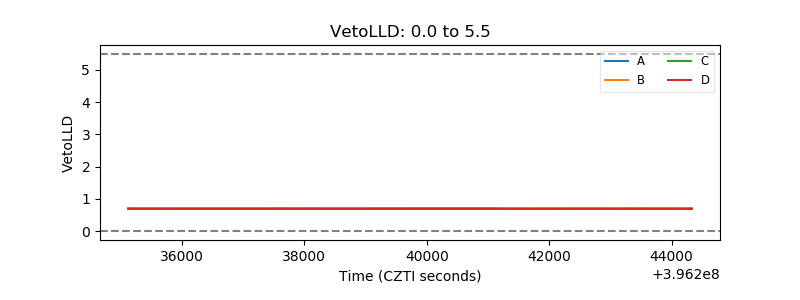 |
| Alpha Counter | 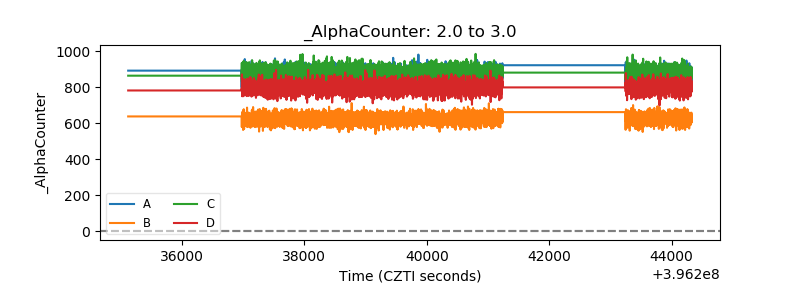 |
| _CPM_Rate |  |
| CZT Counter | 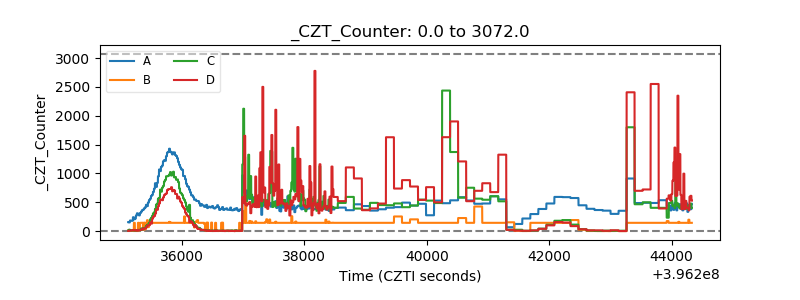 |
| +2.5 Volts monitor | 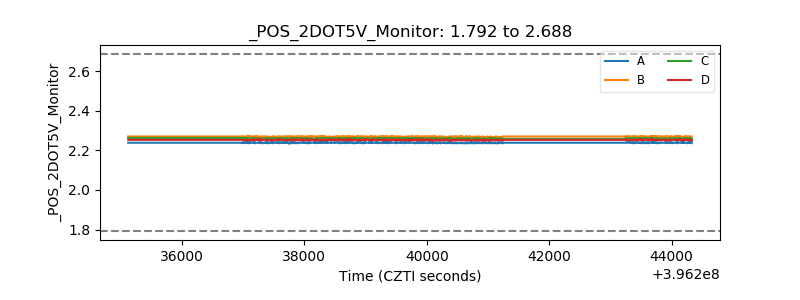 |
| +5 Volts monitor | 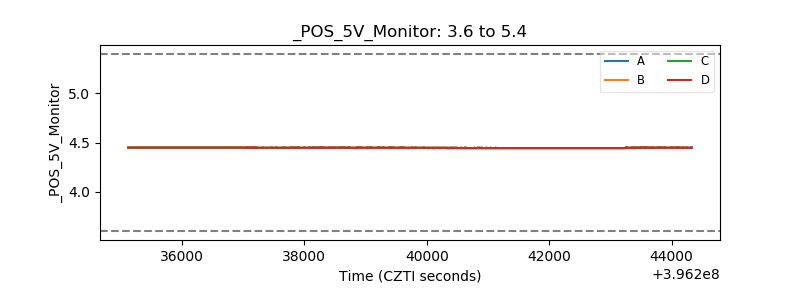 |
| _ROLL_ROT | 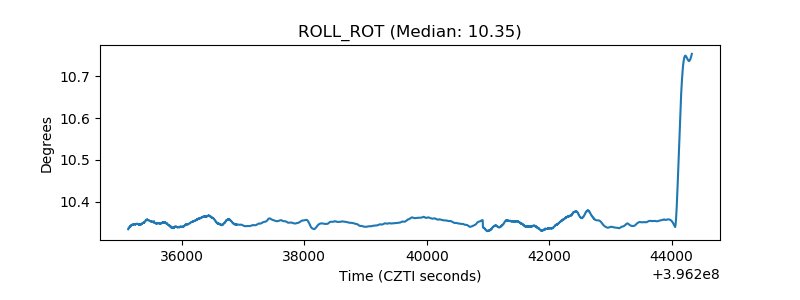 |
| _Roll_DEC | 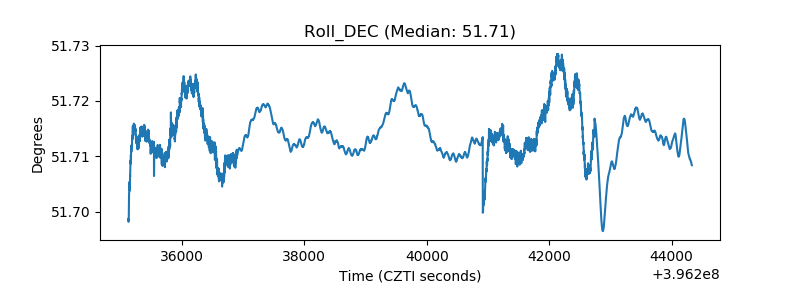 |
| _Roll_RA | 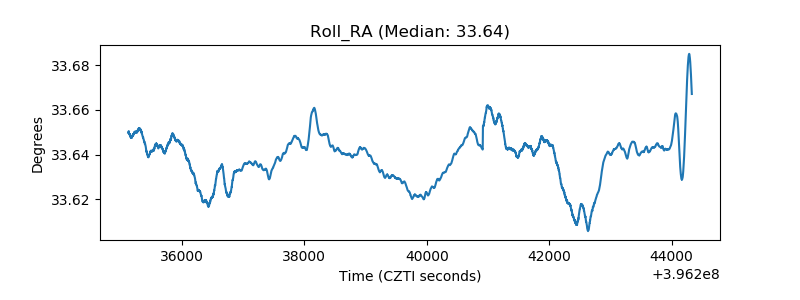 |
| Veto Counter | 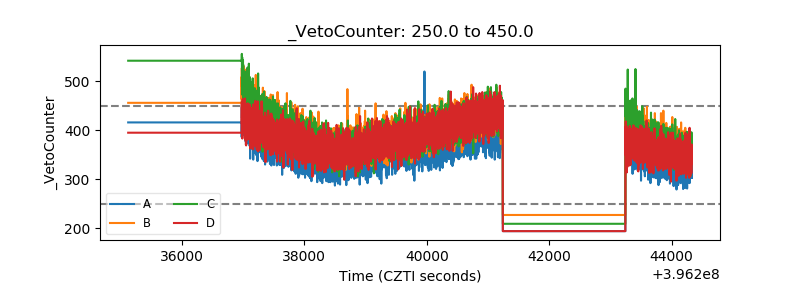 |