| Param | Original file | Final file |
|---|---|---|
| Filename | modeM0/AS1A11_075T01_9000005244_36858cztM0_level2.evt | modeM0/AS1A11_075T01_9000005244_36858cztM0_level2_quad_clean.evt |
| Size (bytes) | 308,292,480 | 51,696,000 |
| Size | 294.0 MB | 49.3 MB |
| Events in quadrant A | 2,522,195 | 393,475 |
| Events in quadrant B | 831,679 | 7,590 |
| Events in quadrant C | 2,610,509 | 407,976 |
| Events in quadrant D | 2,999,422 | 377,273 |
| Mode SS | |||
|---|---|---|---|
| Quadrant | BADHDUFLAG | Total packets | Discarded packets |
| A | 0 | 114 | 0 |
| B | 0 | 114 | 2 |
| C | 0 | 114 | 2 |
| D | 0 | 113 | 1 |
| Mode M0 | |||
|---|---|---|---|
| Quadrant | BADHDUFLAG | Total packets | Discarded packets |
| A | 0 | 11467 | 457 |
| B | 0 | 5605 | 67 |
| C | 0 | 11710 | 473 |
| D | 0 | 13706 | 956 |
| Mode M9 | |||
|---|---|---|---|
| Quadrant | BADHDUFLAG | Total packets | Discarded packets |
| A | 0 | 16 | 0 |
| B | 0 | 16 | 0 |
| C | 0 | 16 | 0 |
| D | 0 | 16 | 0 |
| Quadrant | Total seconds | Saturated seconds | Saturation percentage |
|---|---|---|---|
| A | 5360 | 6 | 0.111940% |
| B | 5475 | 5475 | 100.000000% |
| C | 5360 | 28 | 0.522388% |
| D | 5304 | 73 | 1.376320% |
Noise dominated data is calculated using 1-second bins in cleaned event files. If a bin has >2000 counts, and if more than 50% of those come from <1% of pixels, then it is considered to be noise-dominated and hence unusable.
| Quadrant | # 1 sec bins | Bins with >0 counts | Bins with >2000 counts | High rate bins dominated by noise | Noise dominated (total time) | Noise dominated (detector-on time) | Marked lightcurve |
|---|---|---|---|---|---|---|---|
| A | 7237 | 5469 | 2 | 2 | 0.03% | 0.04% | 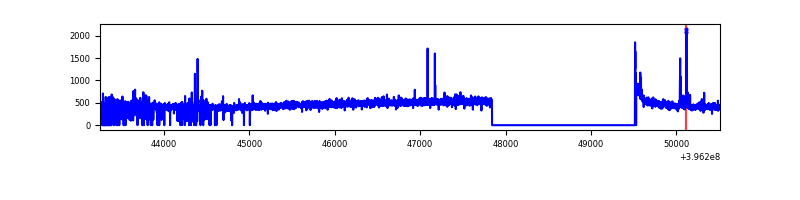 |
| B | 7258 | 5474 | 0 | 0 | 0.00% | 0.00% | 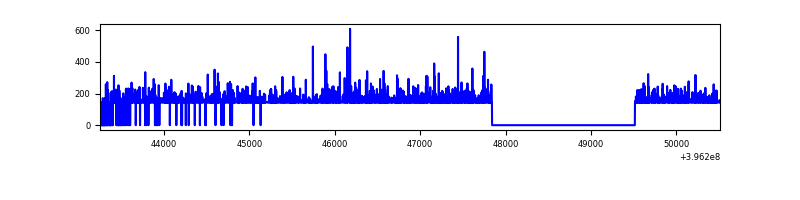 |
| C | 7214 | 5473 | 23 | 23 | 0.32% | 0.42% | 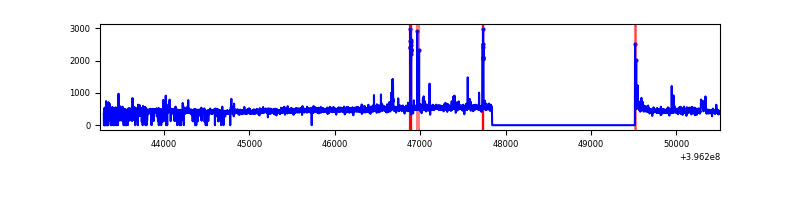 |
| D | 7256 | 5434 | 81 | 81 | 1.12% | 1.49% | 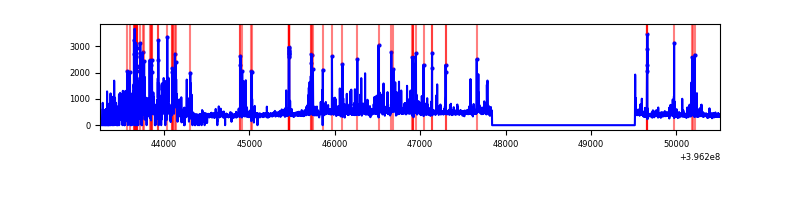 |
Top three noisy pixels from each quadrant. If the there are fewer than three noisy pixels in the level2.evt file, extra rows are filled as -1
| Pixel properties | Quadrant properties | ||||||
|---|---|---|---|---|---|---|---|
| Quadrant | DetID | PixID | Counts | Sigma | Mean | Median | Sigma |
| A | 10 | 83 | 194592 | 1622.63 | 585 | 574 | 119.6 |
| A | 9 | 143 | 43669 | 360.42 | 585 | 574 | 119.6 |
| A | 13 | 6 | 12004 | 95.59 | 585 | 574 | 119.6 |
| B | 12 | 243 | 759761 | 176733.26 | 12 | 12 | 4.3 |
| B | 12 | 144 | 14097 | 3276.46 | 12 | 12 | 4.3 |
| B | 0 | 213 | 3321 | 769.74 | 12 | 12 | 4.3 |
| C | 15 | 214 | 229576 | 1717.1 | 571 | 575 | 133.4 |
| C | 14 | 254 | 55254 | 410.0 | 571 | 575 | 133.4 |
| C | 3 | 233 | 51447 | 381.45 | 571 | 575 | 133.4 |
| D | 12 | 227 | 235460 | 1719.08 | 561 | 545 | 136.7 |
| D | 12 | 17 | 140073 | 1021.05 | 561 | 545 | 136.7 |
| D | 13 | 249 | 94941 | 690.78 | 561 | 545 | 136.7 |
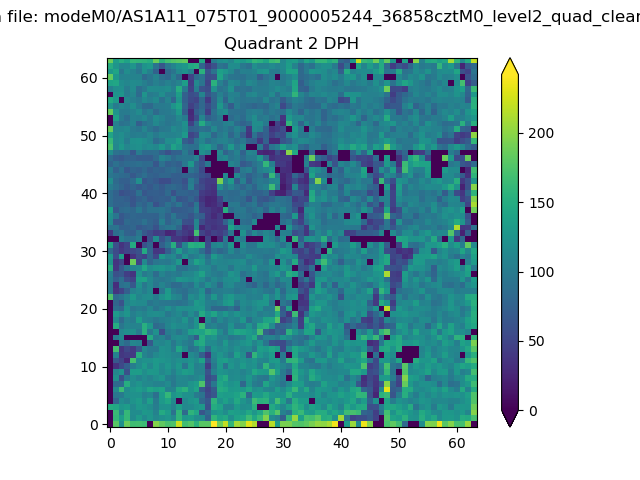
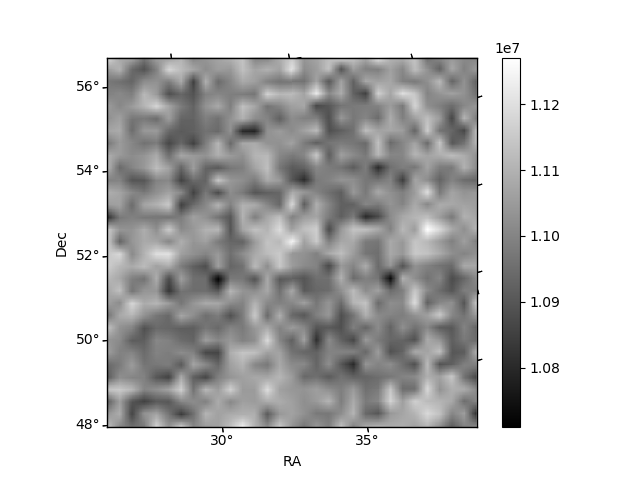
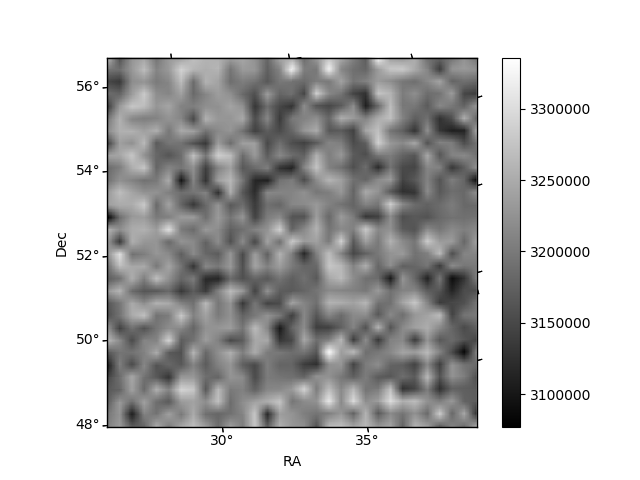
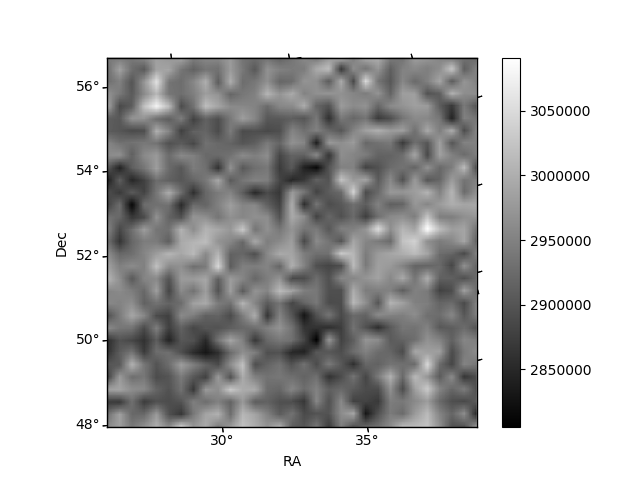
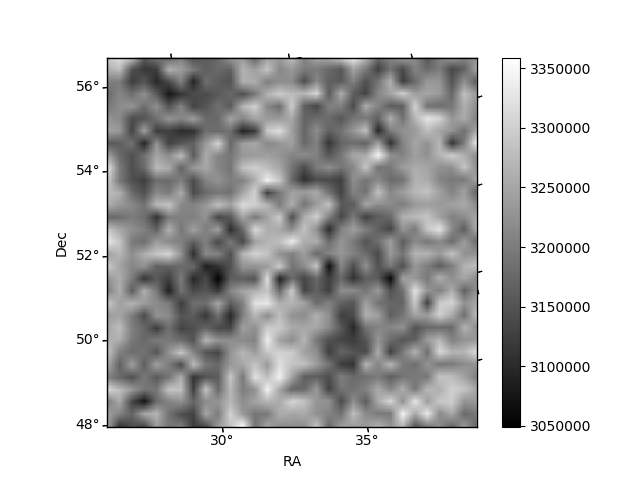
Histogram calculated using DETX and DETY for each event in the final _common_clean file
| Quadrant A | 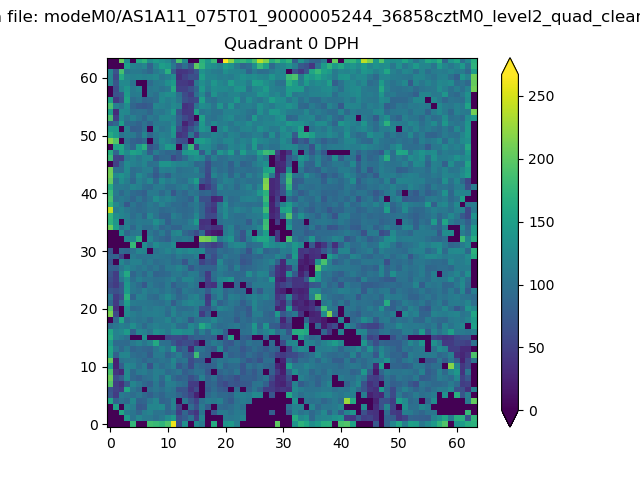 |
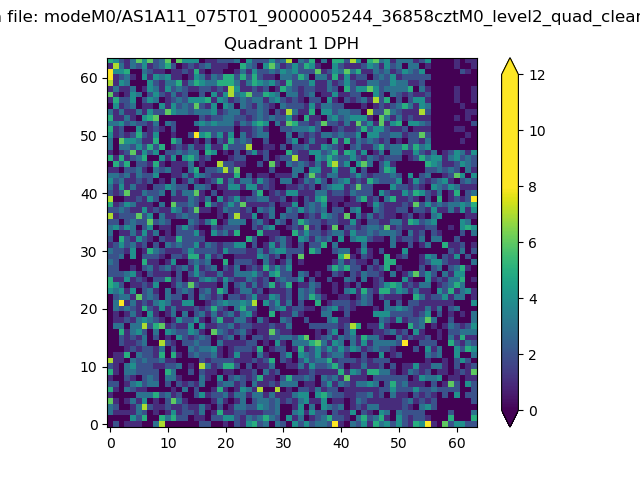 |
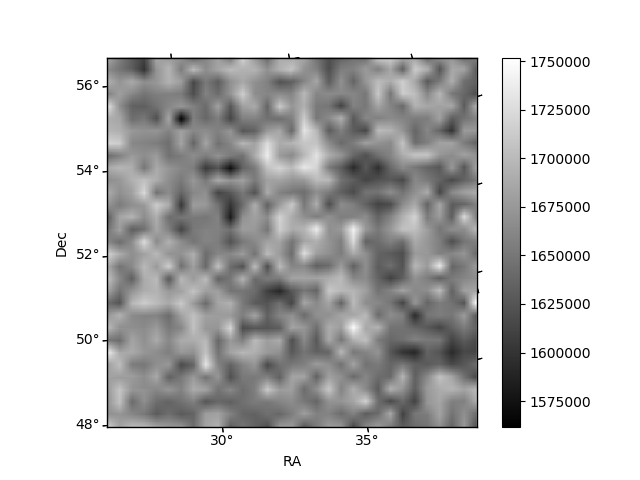
Quadrant B |
|---|---|---|---|
| Quadrant D | 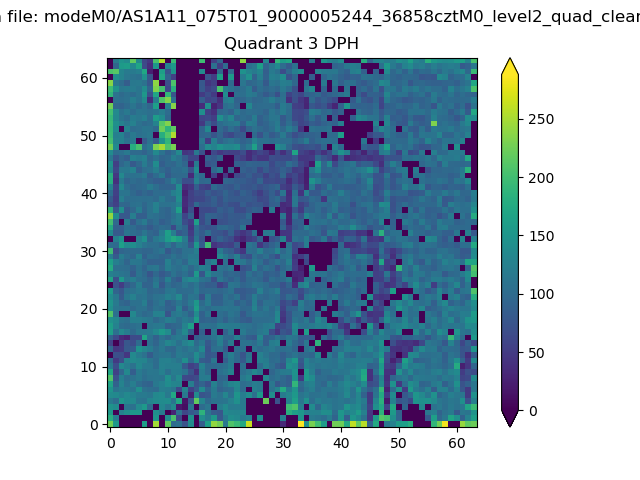 |
 |
Quadrant C |
| Plot type | Count rate plots | Images |
|---|---|---|
| Comparison with Poisson distribution Blue bars denote a histogram of data divided into 1 sec bins. Red curve is a Poisson curve with rate = median count rate of data. |
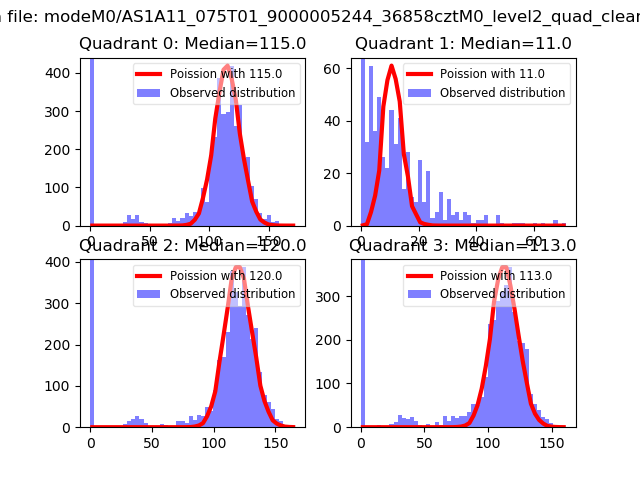 |
 |
| Quadrant-wise count rates Data is divided into 100 sec bins |
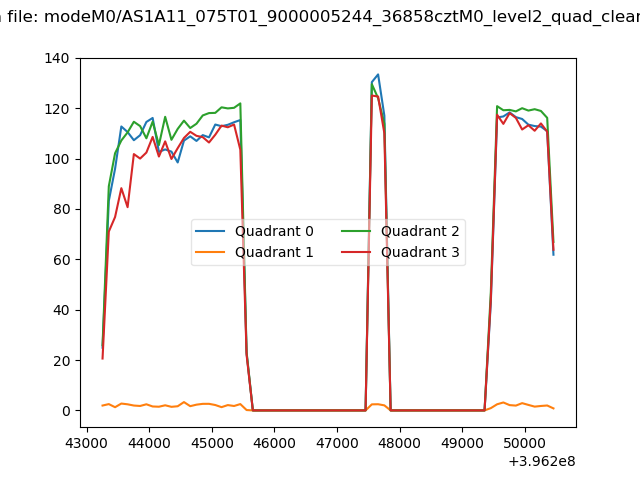 |
|
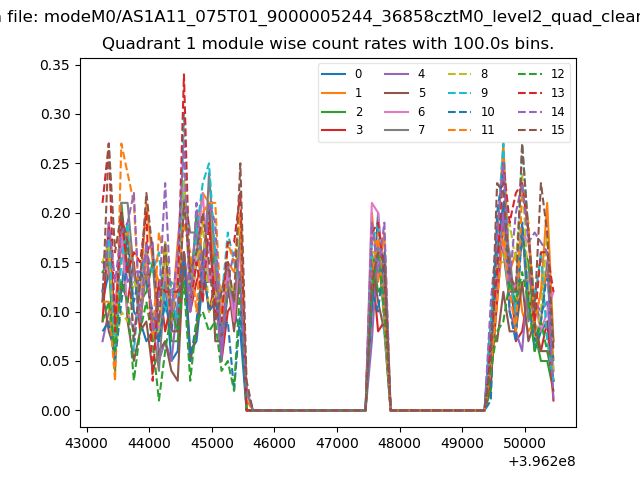
| Module-wise count rates for Quadrant A Data is divided into 100 sec bins |
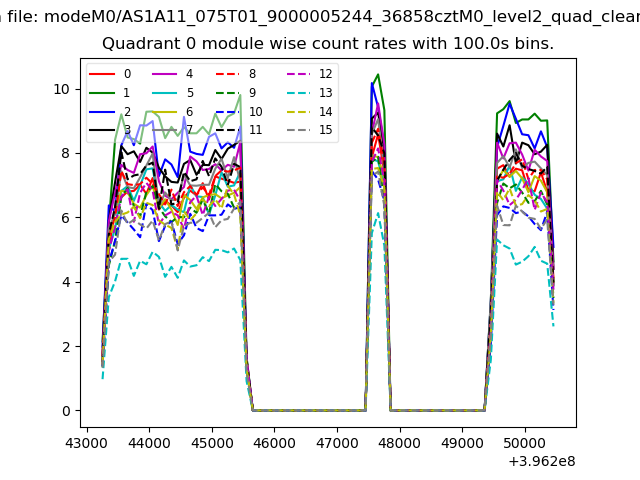 |
 |
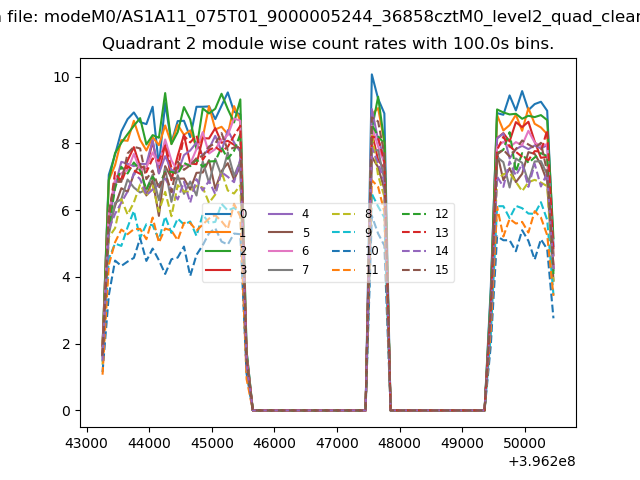
| Module-wise count rates for Quadrant B Data is divided into 100 sec bins |
 |
 |
| Module-wise count rates for Quadrant C Data is divided into 100 sec bins |
 |
 |
| Module-wise count rates for Quadrant D Data is divided into 100 sec bins |
 |
 |
| Parameter | Plot |
|---|---|
| CZT HV Monitor | 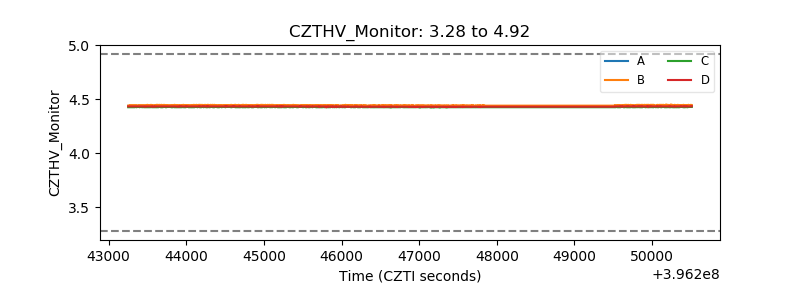 |
| D_VDD | 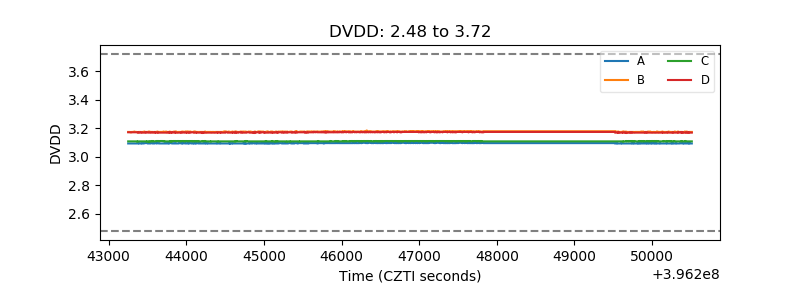 |
| Temperature 1 | 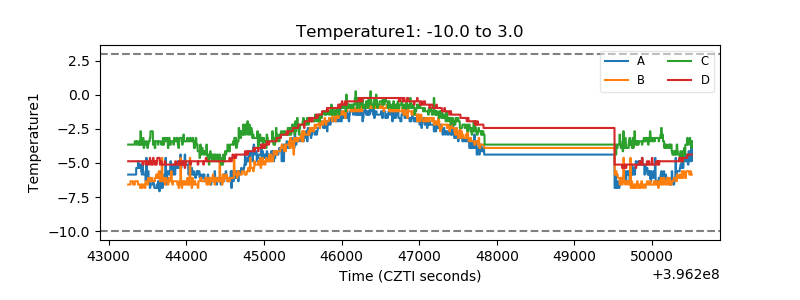 |
| Veto HV Monitor | 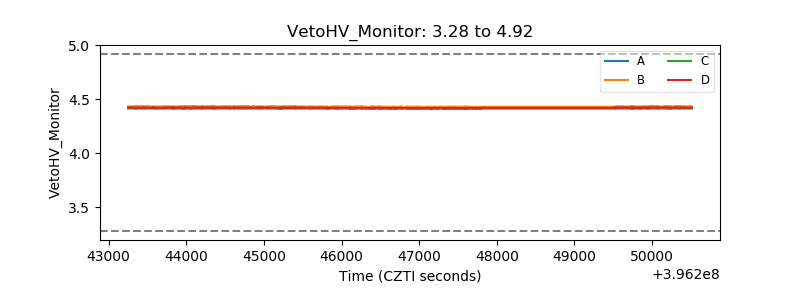 |
| Veto LLD | 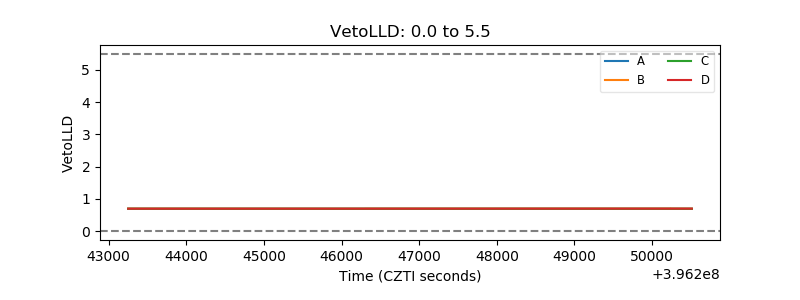 |
| Alpha Counter | 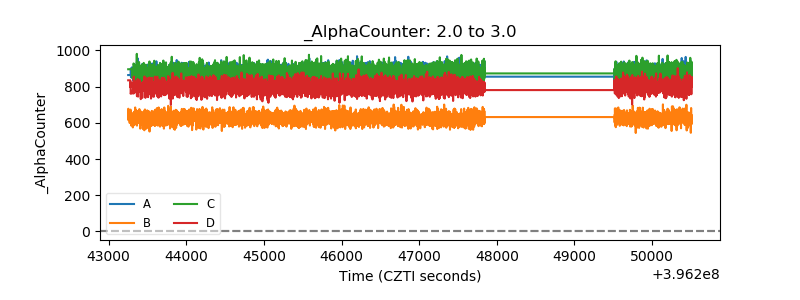 |
| _CPM_Rate | 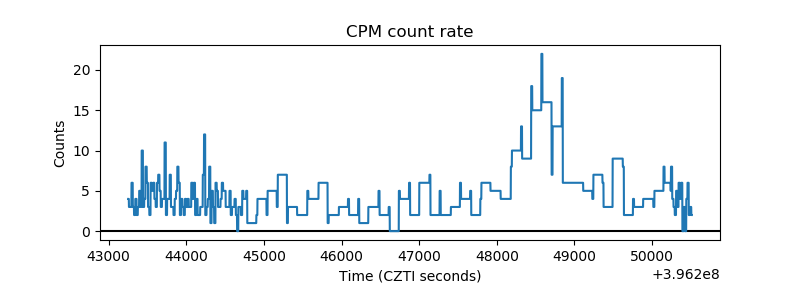 |
| CZT Counter | 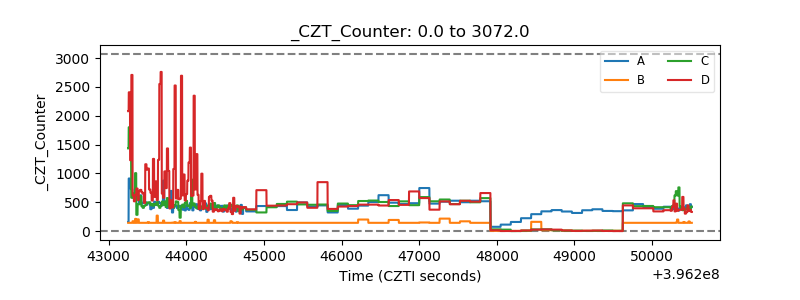 |
| +2.5 Volts monitor | 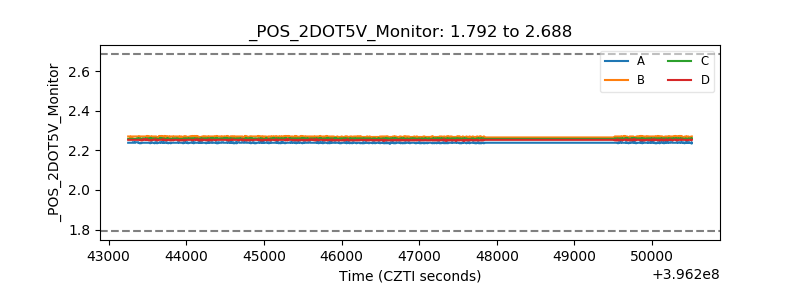 |
| +5 Volts monitor | 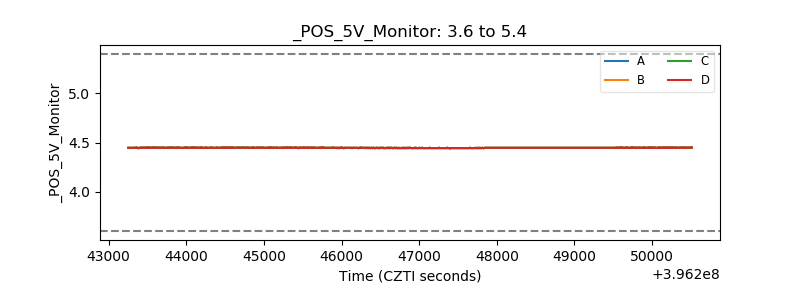 |
| _ROLL_ROT | 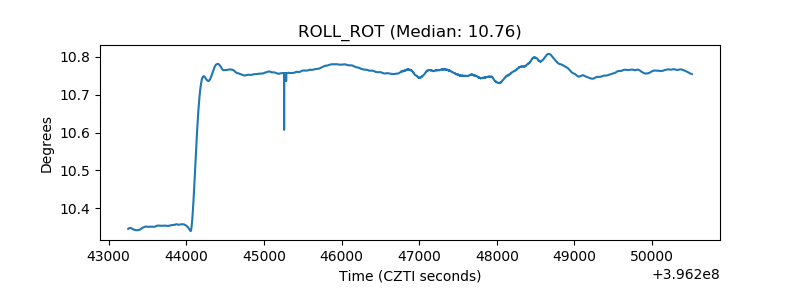 |
| _Roll_DEC |  |
| _Roll_RA | 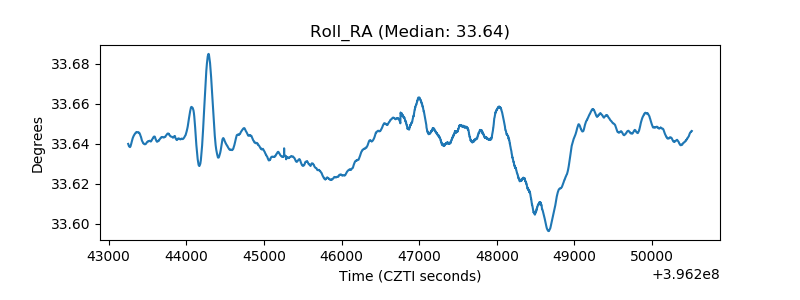 |
| Veto Counter | 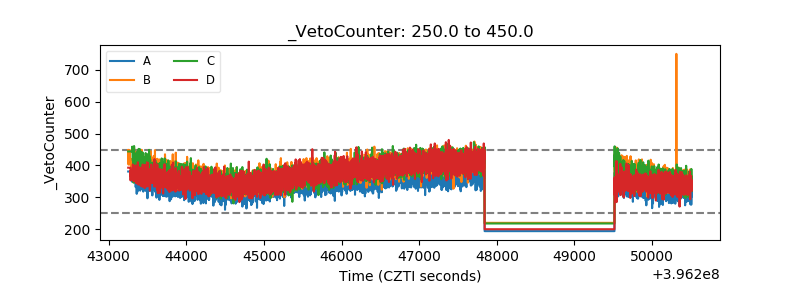 |